| Param | Original file | Final file |
|---|---|---|
| Filename | modeM0/AS1A11_030T02_9000005310_37322cztM0_level2.evt | modeM0/AS1A11_030T02_9000005310_37322cztM0_level2_quad_clean.evt |
| Size (bytes) | 434,998,080 | 55,411,200 |
| Size | 414.8 MB | 52.8 MB |
| Events in quadrant A | 3,216,210 | 322,929 |
| Events in quadrant B | 3,093,512 | 324,856 |
| Events in quadrant C | 3,122,169 | 316,446 |
| Events in quadrant D | 3,342,202 | 302,048 |
| Mode M0 | |||
|---|---|---|---|
| Quadrant | BADHDUFLAG | Total packets | Discarded packets |
| A | 0 | 13141 | 3 |
| B | 0 | 12926 | 2 |
| C | 0 | 12752 | 2 |
| D | 0 | 13878 | 2 |
| Mode SS | |||
|---|---|---|---|
| Quadrant | BADHDUFLAG | Total packets | Discarded packets |
| A | 0 | 120 | 0 |
| B | 0 | 120 | 0 |
| C | 0 | 120 | 0 |
| D | 0 | 120 | 0 |
| Mode M9 | |||
|---|---|---|---|
| Quadrant | BADHDUFLAG | Total packets | Discarded packets |
| A | 0 | 23 | 0 |
| B | 0 | 23 | 0 |
| C | 0 | 23 | 0 |
| D | 0 | 24 | 0 |
| Quadrant | Total seconds | Saturated seconds | Saturation percentage |
|---|---|---|---|
| A | 5883 | 53 | 0.900901% |
| B | 5883 | 66 | 1.121877% |
| C | 5883 | 46 | 0.781914% |
| D | 5883 | 124 | 2.107768% |
Noise dominated data is calculated using 1-second bins in cleaned event files. If a bin has >2000 counts, and if more than 50% of those come from <1% of pixels, then it is considered to be noise-dominated and hence unusable.
| Quadrant | # 1 sec bins | Bins with >0 counts | Bins with >2000 counts | High rate bins dominated by noise | Noise dominated (total time) | Noise dominated (detector-on time) | Marked lightcurve |
|---|---|---|---|---|---|---|---|
| A | 7346 | 5884 | 38 | 38 | 0.52% | 0.65% | 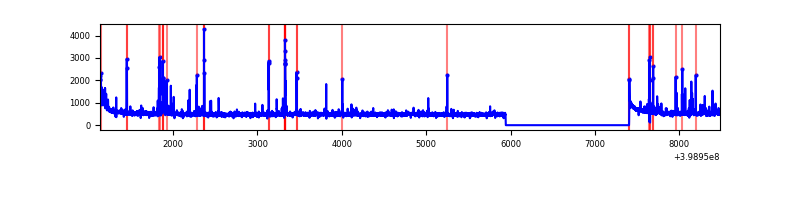 |
| B | 7346 | 5884 | 38 | 38 | 0.52% | 0.65% | 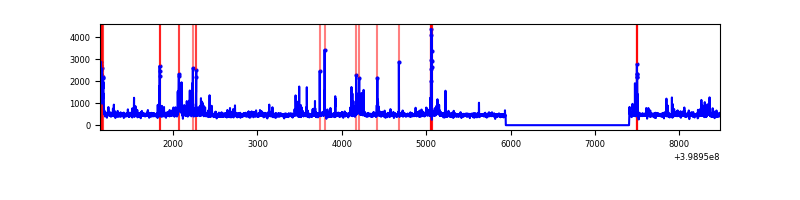 |
| C | 7346 | 5884 | 39 | 39 | 0.53% | 0.66% | 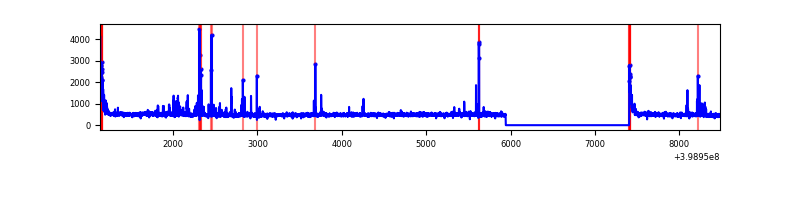 |
| D | 7346 | 5884 | 94 | 94 | 1.28% | 1.60% | 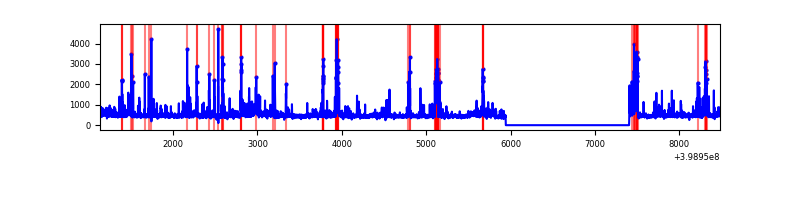 |
Top three noisy pixels from each quadrant. If the there are fewer than three noisy pixels in the level2.evt file, extra rows are filled as -1
| Pixel properties | Quadrant properties | ||||||
|---|---|---|---|---|---|---|---|
| Quadrant | DetID | PixID | Counts | Sigma | Mean | Median | Sigma |
| A | 10 | 83 | 291932 | 2150.08 | 669 | 656 | 135.5 |
| A | 13 | 248 | 98076 | 719.12 | 669 | 656 | 135.5 |
| A | 15 | 237 | 93985 | 688.92 | 669 | 656 | 135.5 |
| B | 0 | 190 | 168352 | 1315.28 | 664 | 648 | 127.5 |
| B | 4 | 171 | 131106 | 1023.16 | 664 | 648 | 127.5 |
| B | 5 | 172 | 110961 | 865.17 | 664 | 648 | 127.5 |
| C | 15 | 214 | 245240 | 1593.01 | 653 | 657 | 153.5 |
| C | 1 | 23 | 139877 | 906.76 | 653 | 657 | 153.5 |
| C | 0 | 10 | 130147 | 843.39 | 653 | 657 | 153.5 |
| D | 2 | 249 | 328486 | 2026.53 | 654 | 635 | 161.8 |
| D | 13 | 249 | 140822 | 866.53 | 654 | 635 | 161.8 |
| D | 12 | 17 | 118553 | 728.88 | 654 | 635 | 161.8 |
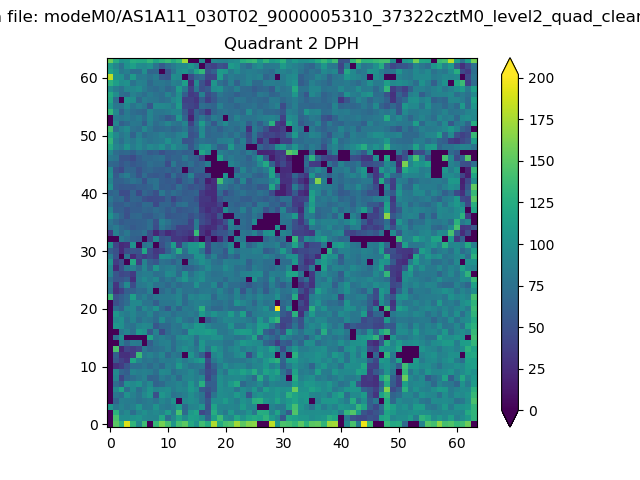
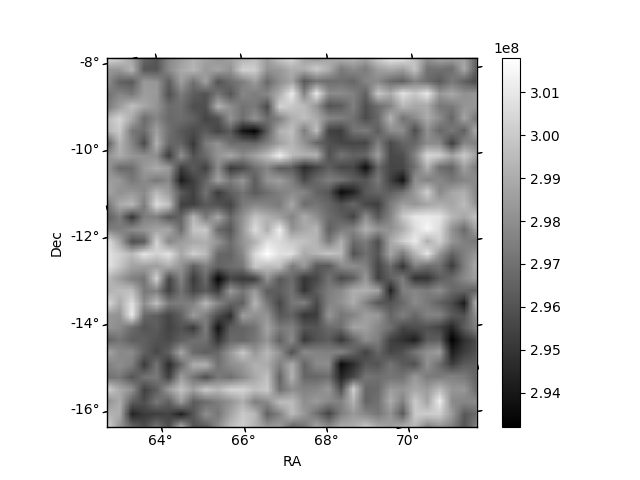
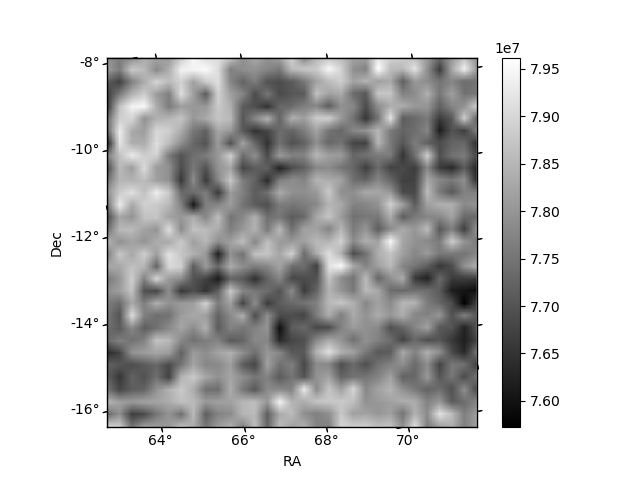
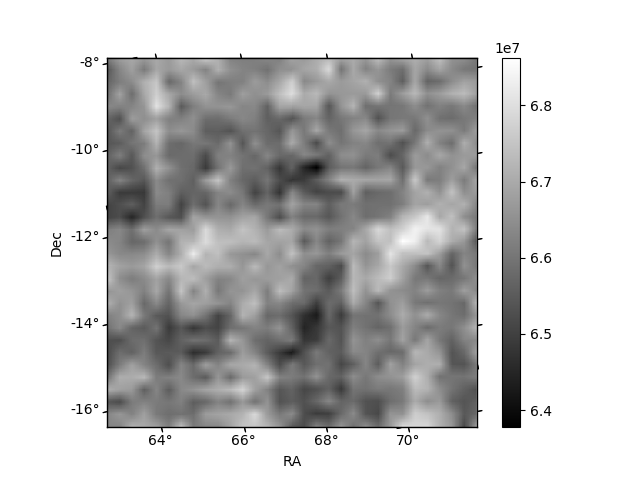
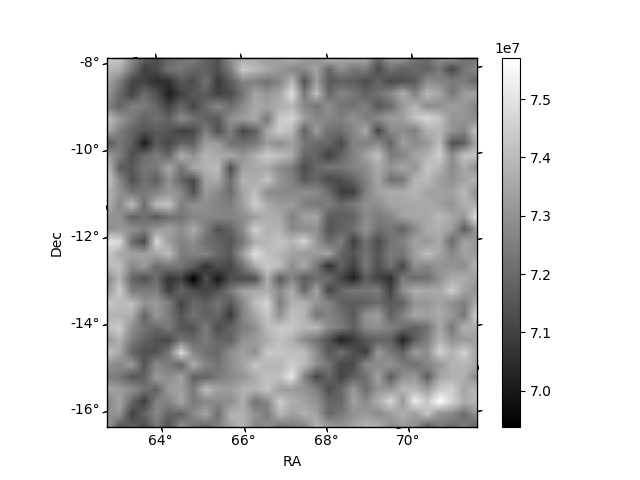
Histogram calculated using DETX and DETY for each event in the final _common_clean file
| Quadrant A | 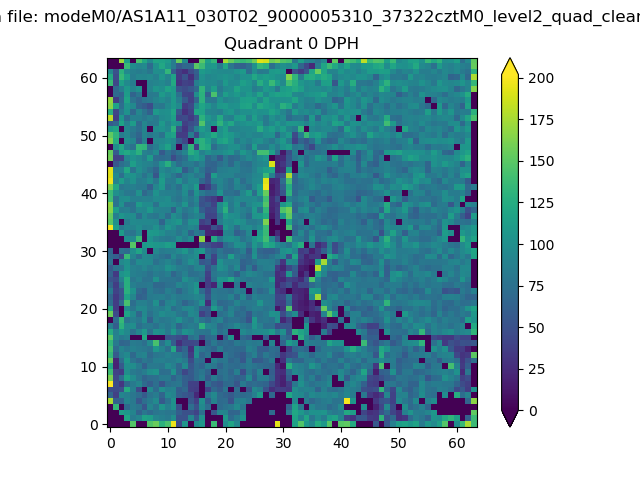 |
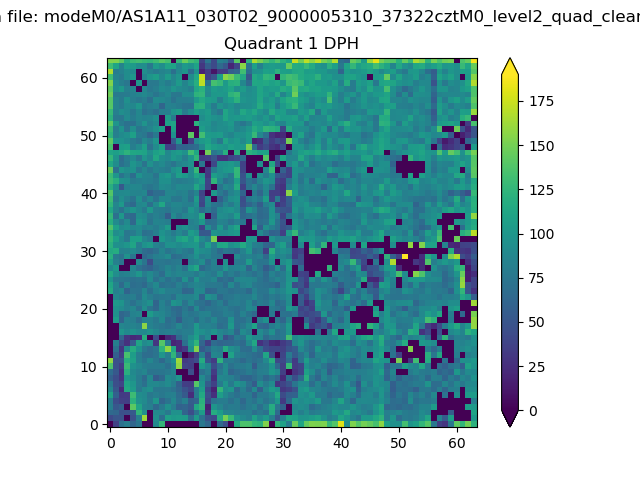 |
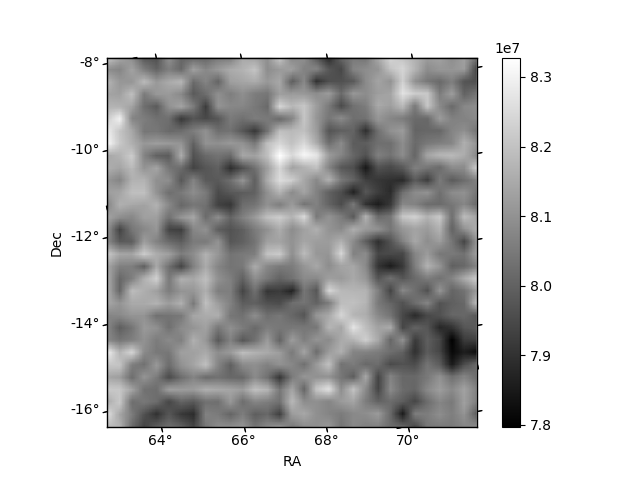
Quadrant B |
|---|---|---|---|
| Quadrant D | 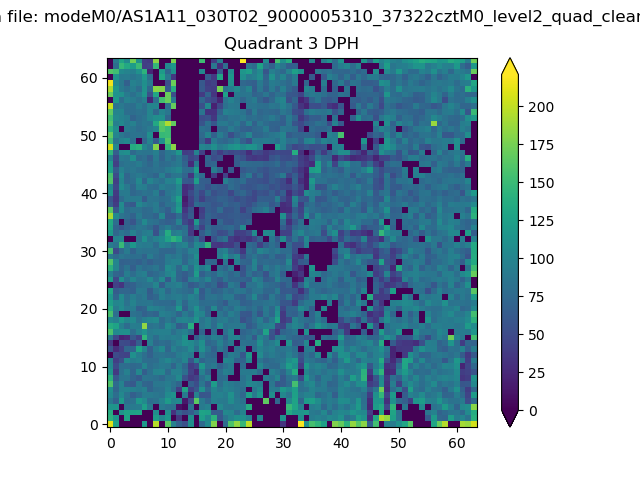 |
 |
Quadrant C |
| Plot type | Count rate plots | Images |
|---|---|---|
| Comparison with Poisson distribution Blue bars denote a histogram of data divided into 1 sec bins. Red curve is a Poisson curve with rate = median count rate of data. |
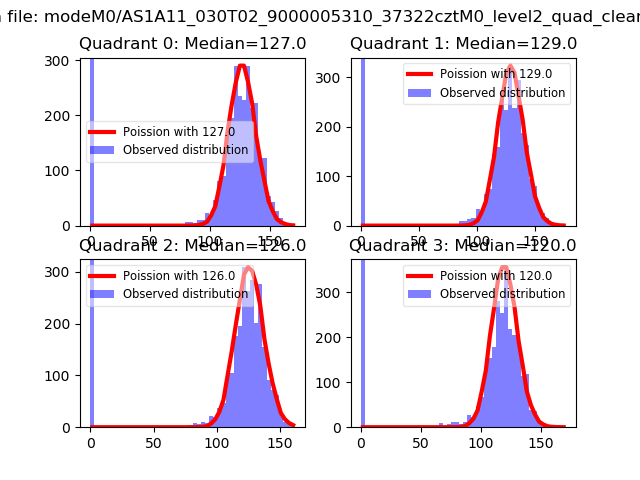 |
 |
| Quadrant-wise count rates Data is divided into 100 sec bins |
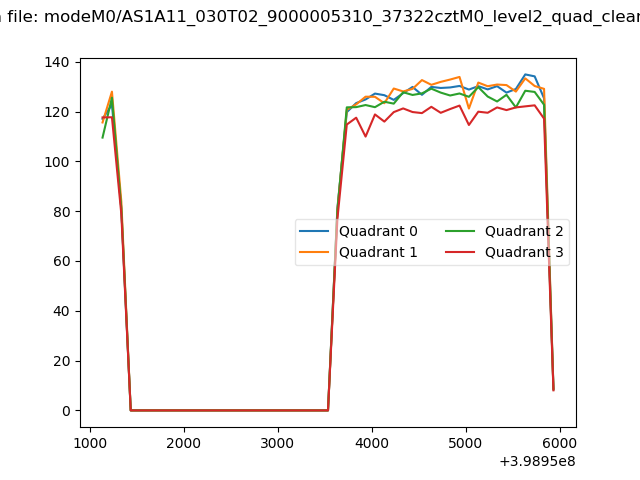 |
|
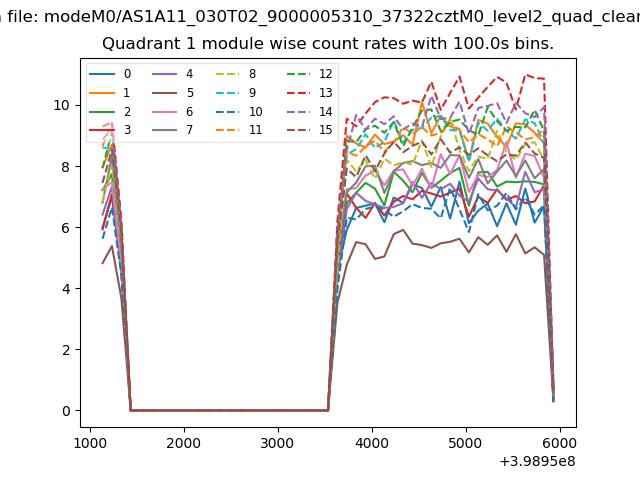
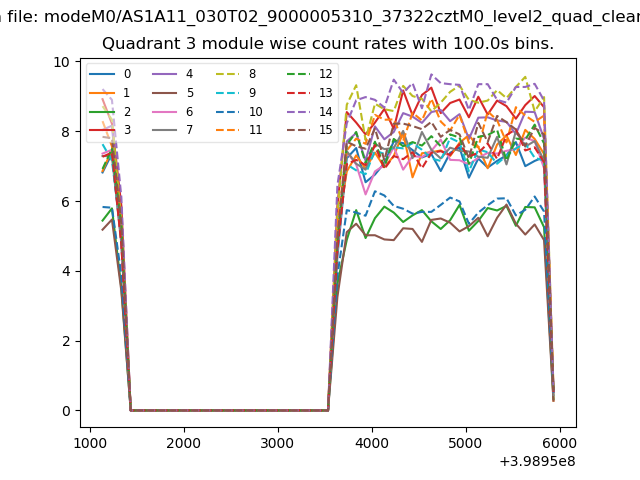
| Module-wise count rates for Quadrant A Data is divided into 100 sec bins |
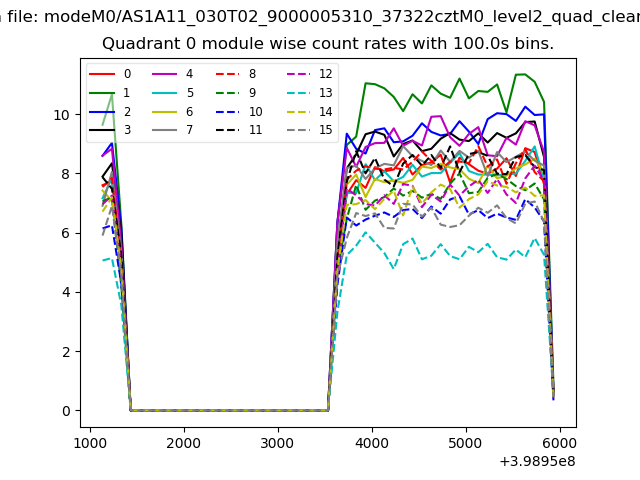 |
 |
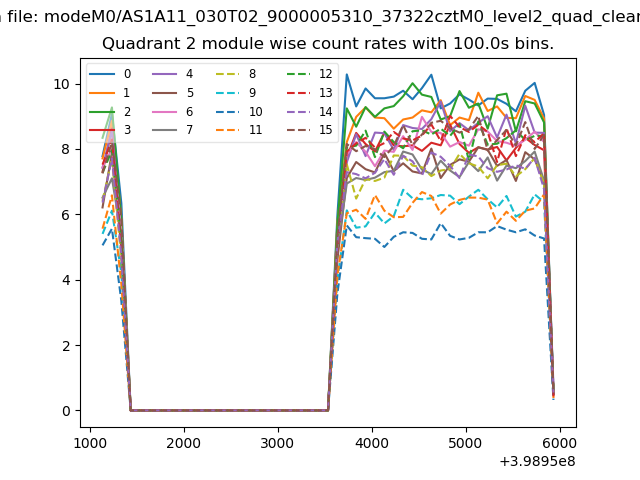
| Module-wise count rates for Quadrant B Data is divided into 100 sec bins |
 |
 |
| Module-wise count rates for Quadrant C Data is divided into 100 sec bins |
 |
 |
| Module-wise count rates for Quadrant D Data is divided into 100 sec bins |
 |
 |
| Parameter | Plot |
|---|---|
| CZT HV Monitor | 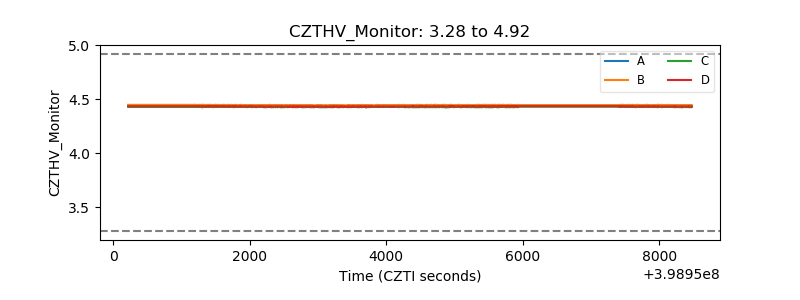 |
| D_VDD | 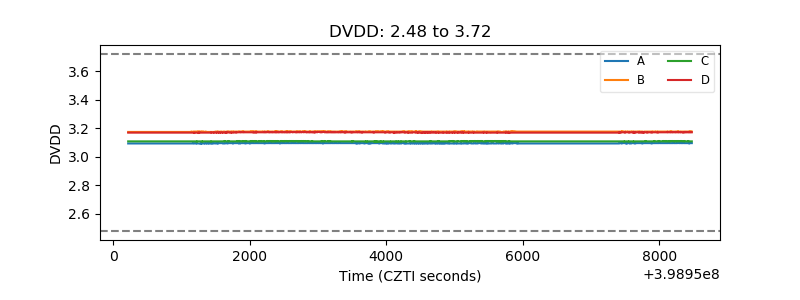 |
| Temperature 1 | 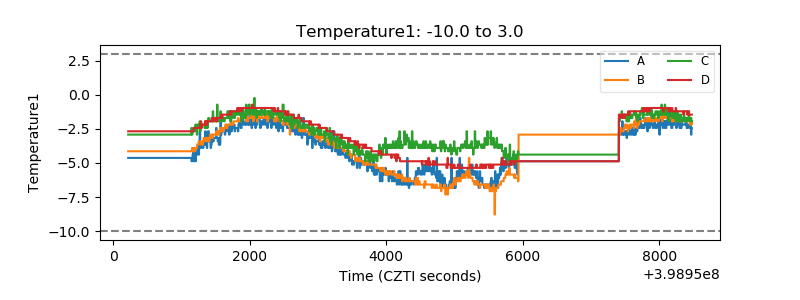 |
| Veto HV Monitor | 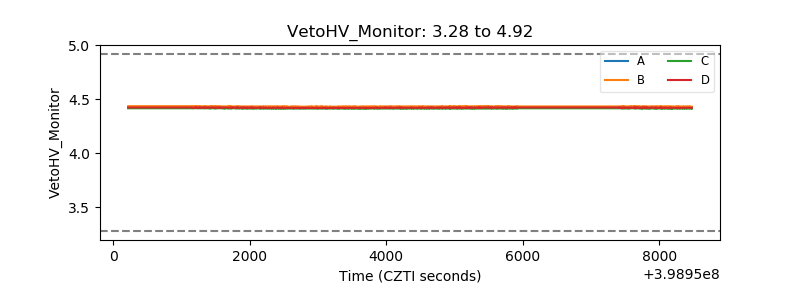 |
| Veto LLD | 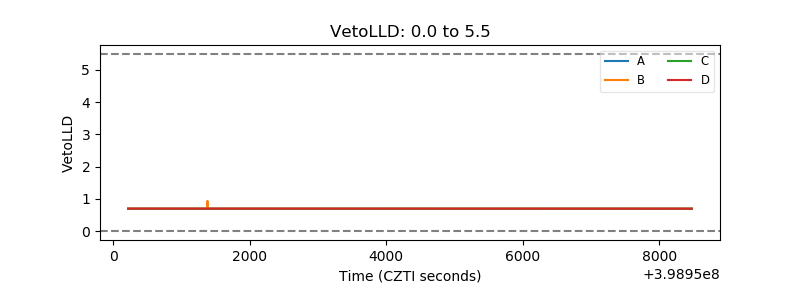 |
| Alpha Counter | 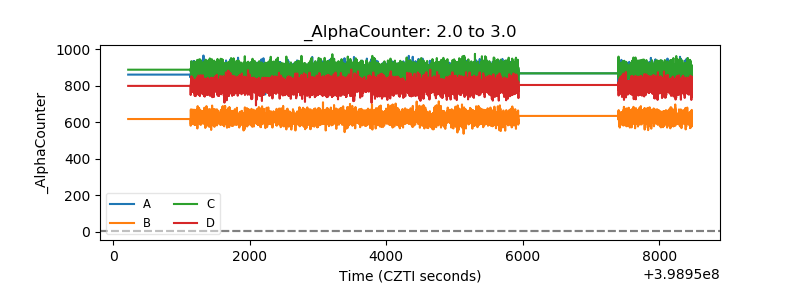 |
| _CPM_Rate | 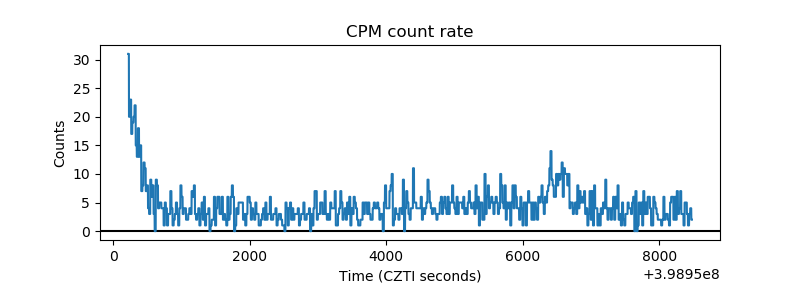 |
| CZT Counter | 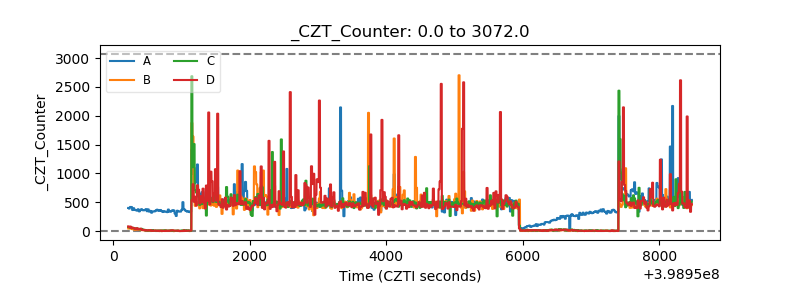 |
| +2.5 Volts monitor | 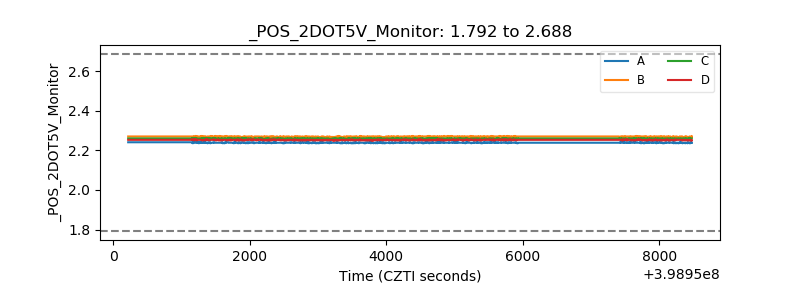 |
| +5 Volts monitor | 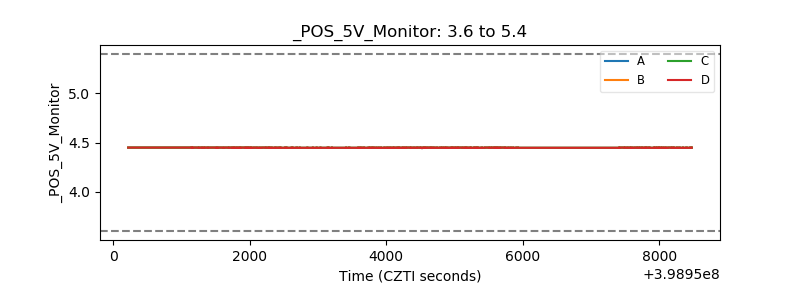 |
| _ROLL_ROT |  |
| _Roll_DEC | 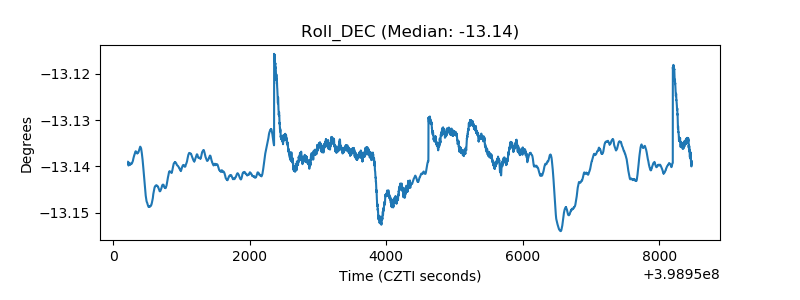 |
| _Roll_RA | 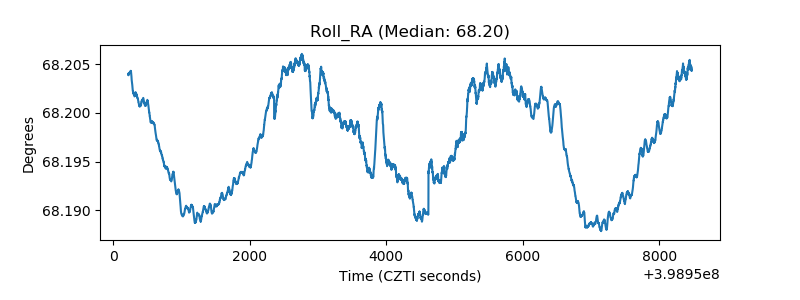 |
| Veto Counter | 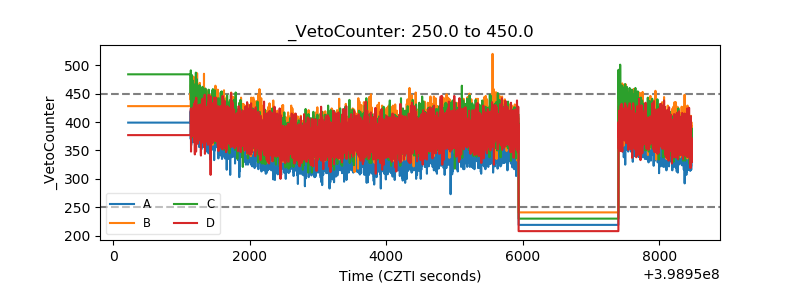 |