| Param | Original file | Final file |
|---|---|---|
| Filename | modeM0/AS1A11_030T02_9000005310_37323cztM0_level2.evt | modeM0/AS1A11_030T02_9000005310_37323cztM0_level2_quad_clean.evt |
| Size (bytes) | 477,460,800 | 59,388,480 |
| Size | 455.3 MB | 56.6 MB |
| Events in quadrant A | 3,388,078 | 357,026 |
| Events in quadrant B | 3,216,028 | 359,934 |
| Events in quadrant C | 3,805,506 | 337,888 |
| Events in quadrant D | 3,650,281 | 331,281 |
| Mode M0 | |||
|---|---|---|---|
| Quadrant | BADHDUFLAG | Total packets | Discarded packets |
| A | 0 | 13714 | 3 |
| B | 0 | 13292 | 2 |
| C | 0 | 14881 | 2 |
| D | 0 | 14870 | 2 |
| Mode SS | |||
|---|---|---|---|
| Quadrant | BADHDUFLAG | Total packets | Discarded packets |
| A | 0 | 120 | 0 |
| B | 0 | 120 | 0 |
| C | 0 | 120 | 0 |
| D | 0 | 120 | 0 |
| Mode M9 | |||
|---|---|---|---|
| Quadrant | BADHDUFLAG | Total packets | Discarded packets |
| A | 0 | 21 | 0 |
| B | 0 | 21 | 0 |
| C | 0 | 21 | 0 |
| D | 0 | 22 | 0 |
| Quadrant | Total seconds | Saturated seconds | Saturation percentage |
|---|---|---|---|
| A | 5893 | 97 | 1.646021% |
| B | 5893 | 119 | 2.019345% |
| C | 5893 | 316 | 5.362294% |
| D | 5893 | 169 | 2.867809% |
Noise dominated data is calculated using 1-second bins in cleaned event files. If a bin has >2000 counts, and if more than 50% of those come from <1% of pixels, then it is considered to be noise-dominated and hence unusable.
| Quadrant | # 1 sec bins | Bins with >0 counts | Bins with >2000 counts | High rate bins dominated by noise | Noise dominated (total time) | Noise dominated (detector-on time) | Marked lightcurve |
|---|---|---|---|---|---|---|---|
| A | 7206 | 5894 | 56 | 56 | 0.78% | 0.95% | 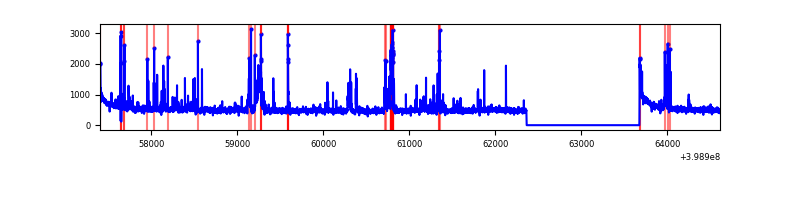 |
| B | 7206 | 5894 | 56 | 56 | 0.78% | 0.95% | 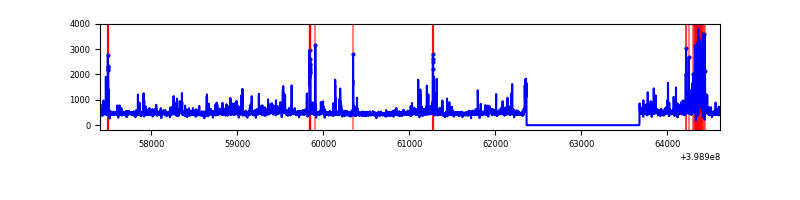 |
| C | 7206 | 5894 | 260 | 260 | 3.61% | 4.41% | 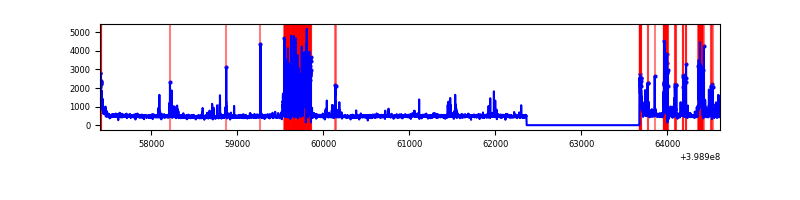 |
| D | 7206 | 5894 | 138 | 138 | 1.92% | 2.34% | 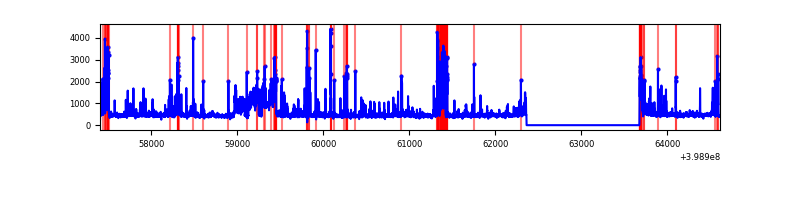 |
Top three noisy pixels from each quadrant. If the there are fewer than three noisy pixels in the level2.evt file, extra rows are filled as -1
| Pixel properties | Quadrant properties | ||||||
|---|---|---|---|---|---|---|---|
| Quadrant | DetID | PixID | Counts | Sigma | Mean | Median | Sigma |
| A | 10 | 83 | 298731 | 2199.21 | 667 | 653 | 135.5 |
| A | 13 | 248 | 223911 | 1647.19 | 667 | 653 | 135.5 |
| A | 15 | 237 | 161610 | 1187.54 | 667 | 653 | 135.5 |
| B | 12 | 18 | 134533 | 1053.88 | 657 | 638 | 127.0 |
| B | 0 | 190 | 112812 | 882.92 | 657 | 638 | 127.0 |
| B | 12 | 2 | 110136 | 861.85 | 657 | 638 | 127.0 |
| C | 1 | 23 | 727931 | 4882.7 | 634 | 637 | 149.0 |
| C | 14 | 254 | 260012 | 1741.32 | 634 | 637 | 149.0 |
| C | 15 | 214 | 239188 | 1601.52 | 634 | 637 | 149.0 |
| D | 2 | 249 | 440375 | 2783.85 | 647 | 630 | 158.0 |
| D | 13 | 249 | 359689 | 2273.06 | 647 | 630 | 158.0 |
| D | 12 | 217 | 91877 | 577.65 | 647 | 630 | 158.0 |
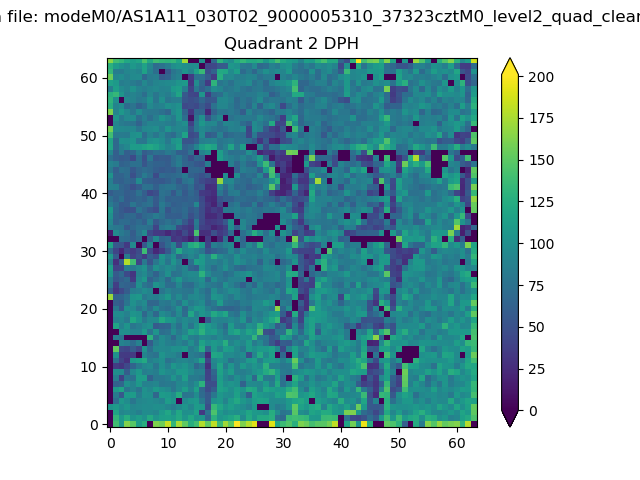
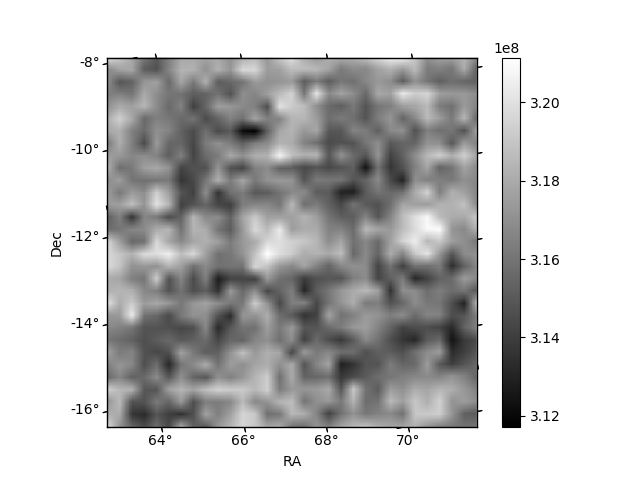
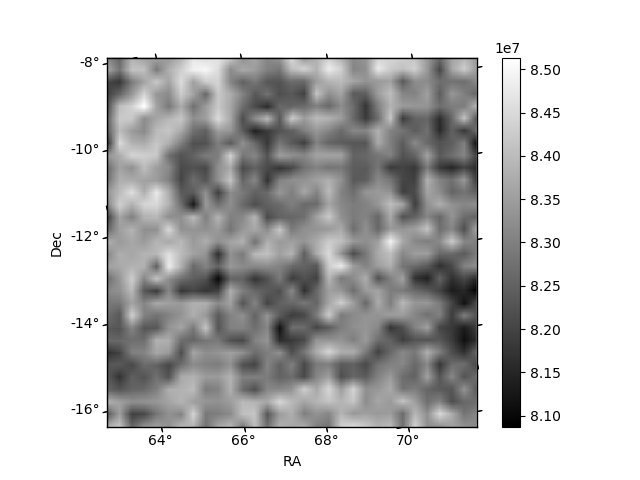
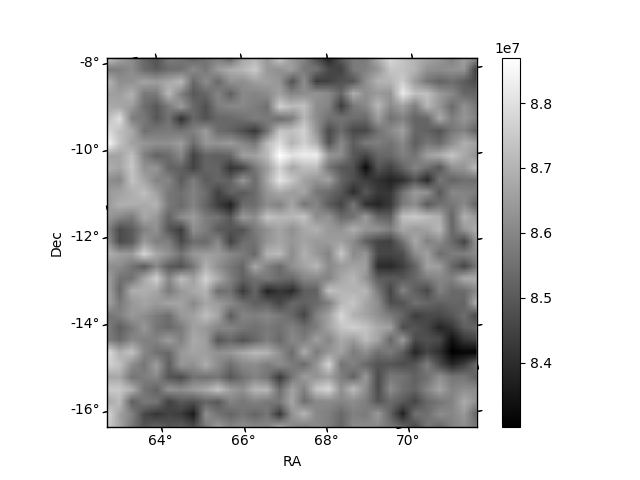
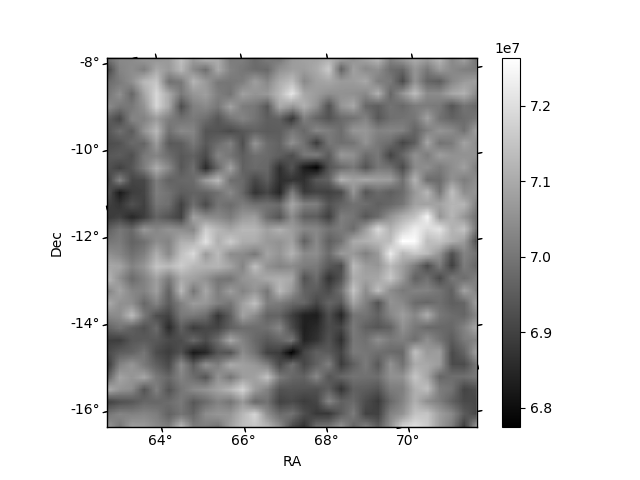
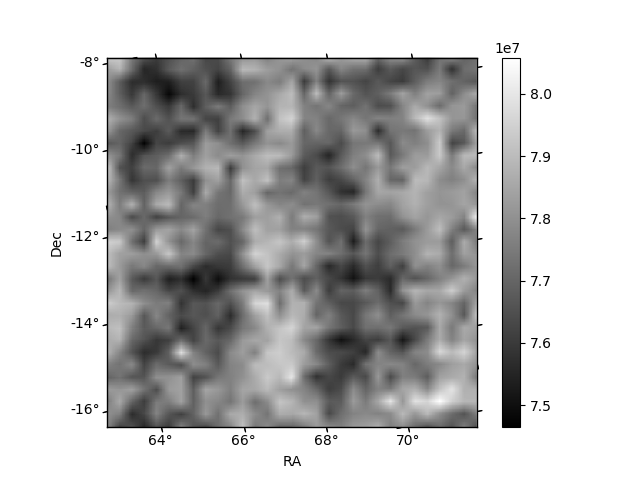
Histogram calculated using DETX and DETY for each event in the final _common_clean file
| Quadrant A | 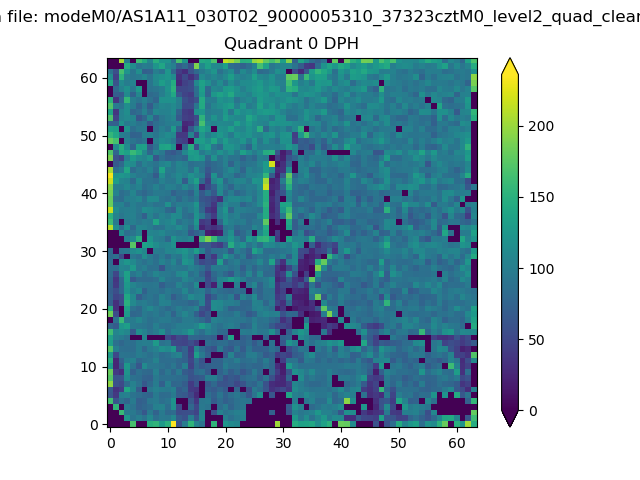 |
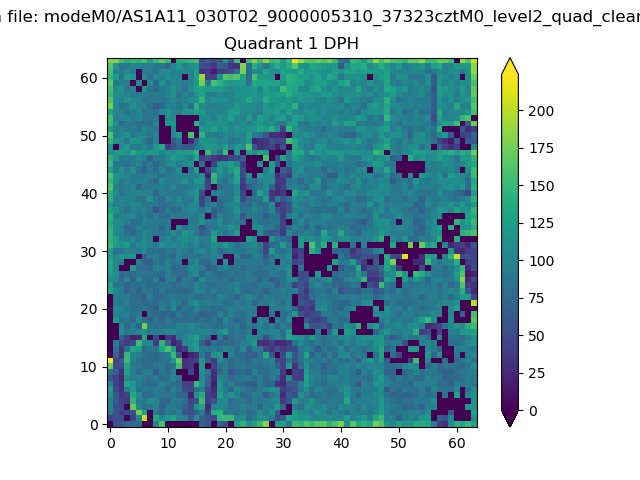 |
Quadrant B |
|---|---|---|---|
| Quadrant D | 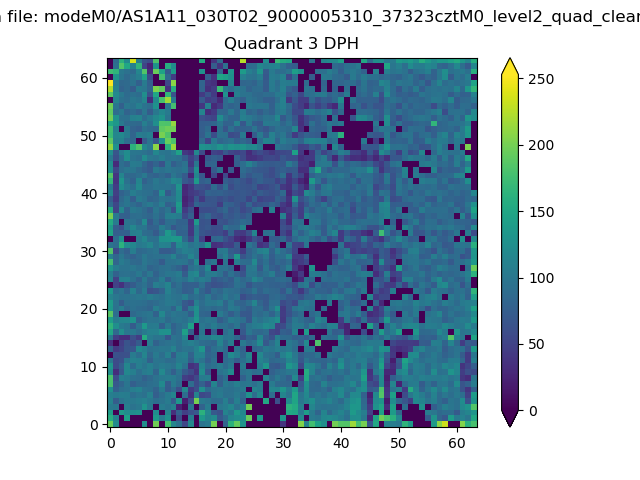 |
 |
Quadrant C |
| Plot type | Count rate plots | Images |
|---|---|---|
| Comparison with Poisson distribution Blue bars denote a histogram of data divided into 1 sec bins. Red curve is a Poisson curve with rate = median count rate of data. |
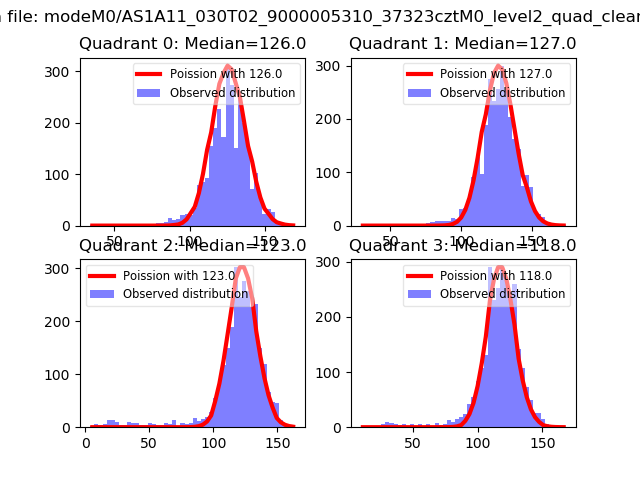 |
 |
| Quadrant-wise count rates Data is divided into 100 sec bins |
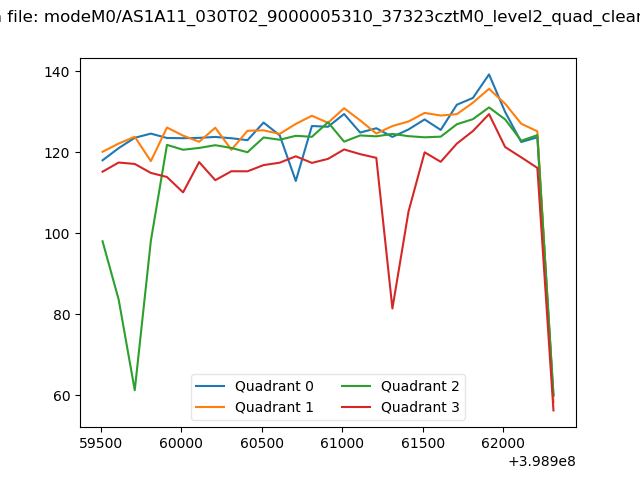 |
|
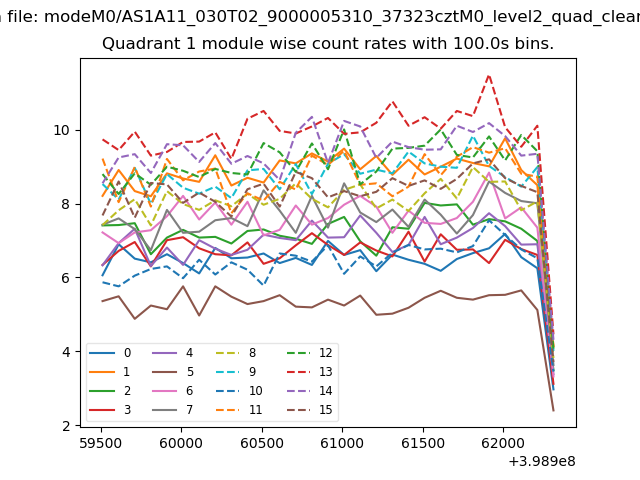
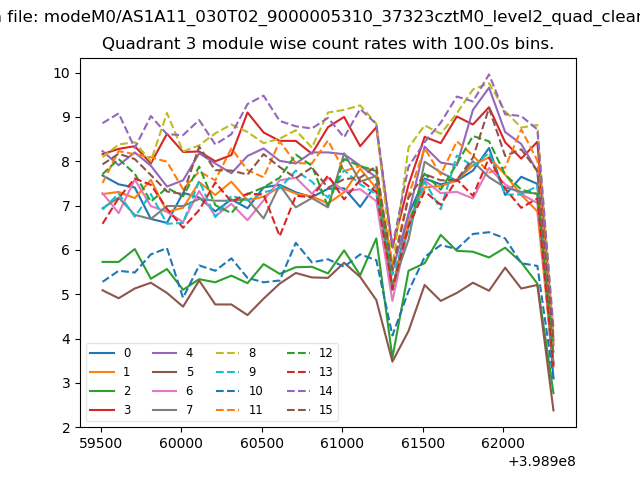
| Module-wise count rates for Quadrant A Data is divided into 100 sec bins |
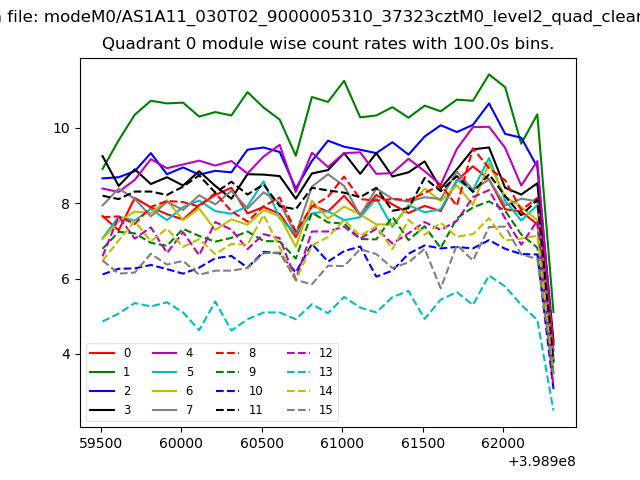 |
 |
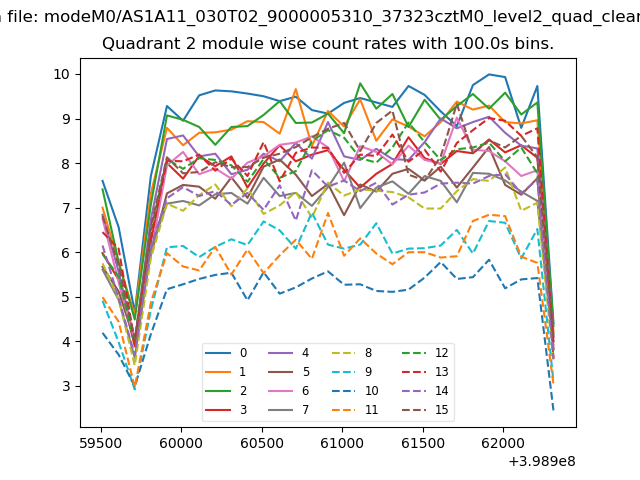
| Module-wise count rates for Quadrant B Data is divided into 100 sec bins |
 |
 |
| Module-wise count rates for Quadrant C Data is divided into 100 sec bins |
 |
 |
| Module-wise count rates for Quadrant D Data is divided into 100 sec bins |
 |
 |
| Parameter | Plot |
|---|---|
| CZT HV Monitor | 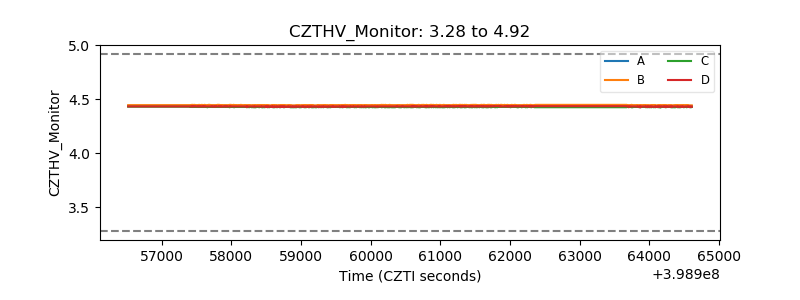 |
| D_VDD | 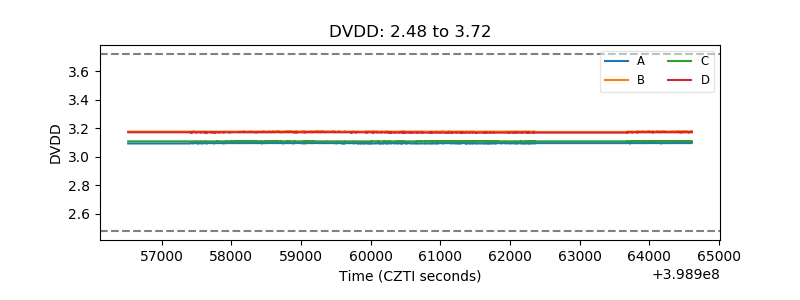 |
| Temperature 1 | 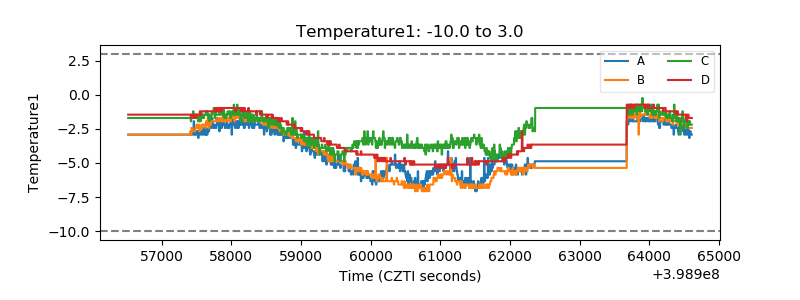 |
| Veto HV Monitor | 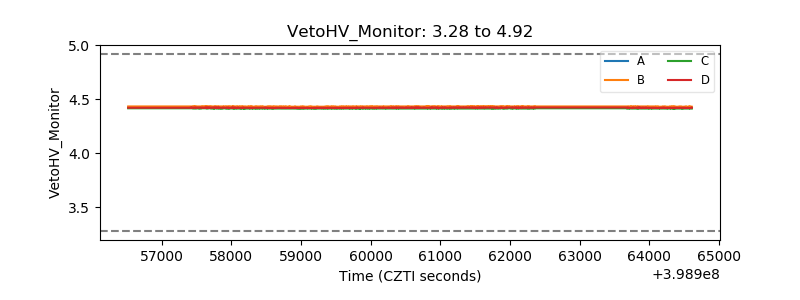 |
| Veto LLD | 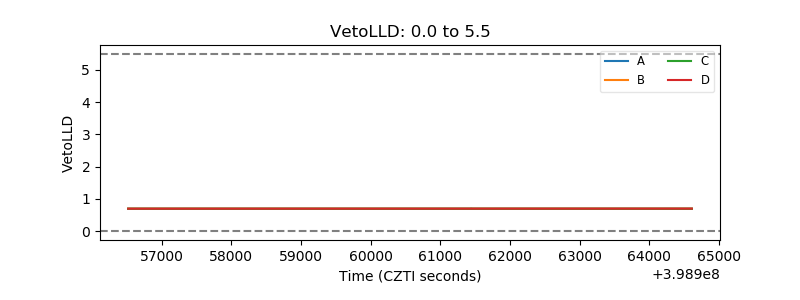 |
| Alpha Counter | 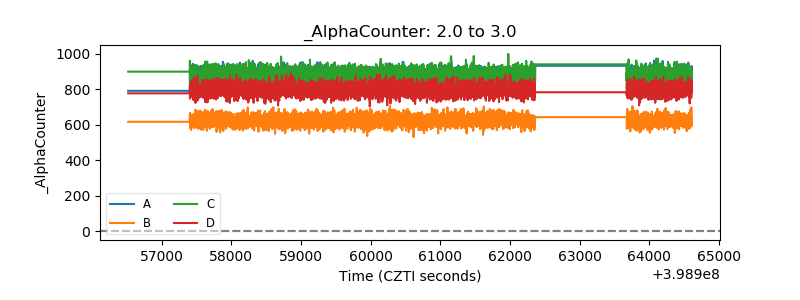 |
| _CPM_Rate | 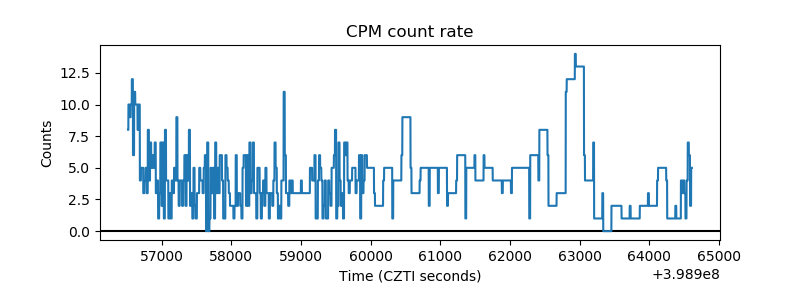 |
| CZT Counter | 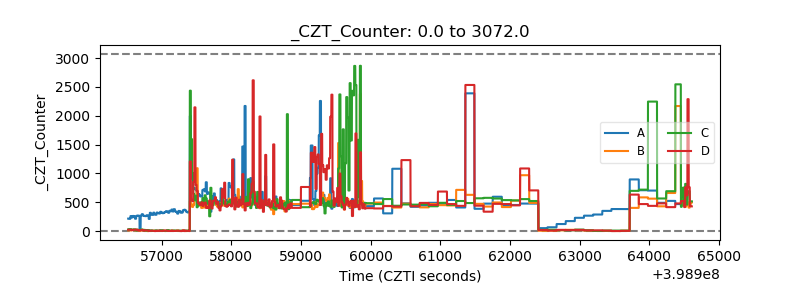 |
| +2.5 Volts monitor | 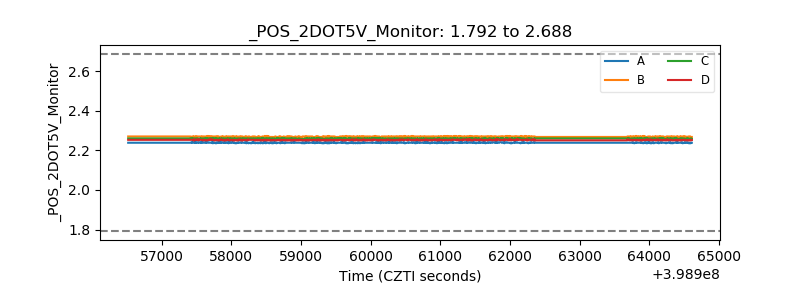 |
| +5 Volts monitor | 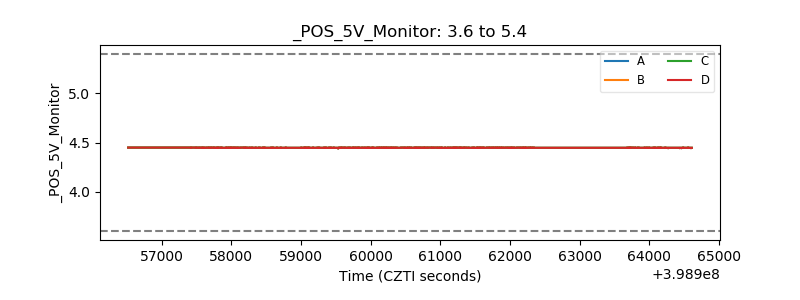 |
| _ROLL_ROT | 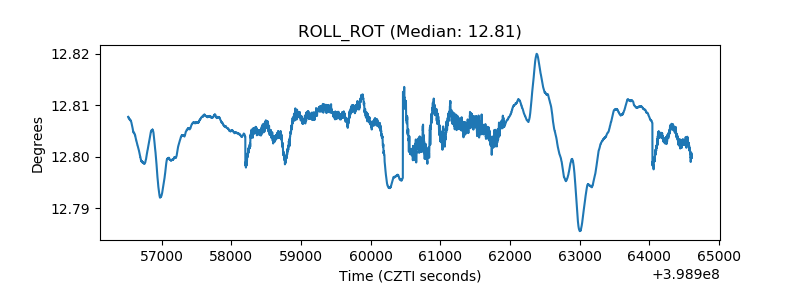 |
| _Roll_DEC | 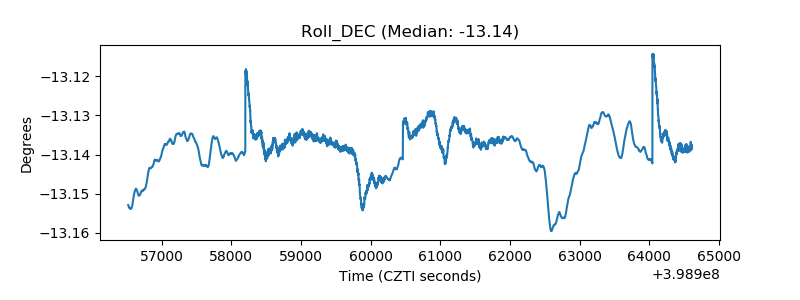 |
| _Roll_RA | 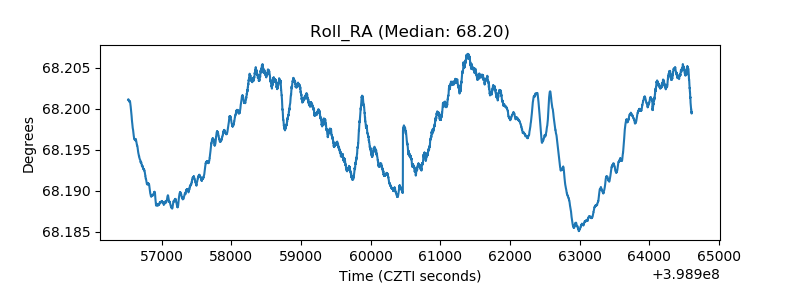 |
| Veto Counter | 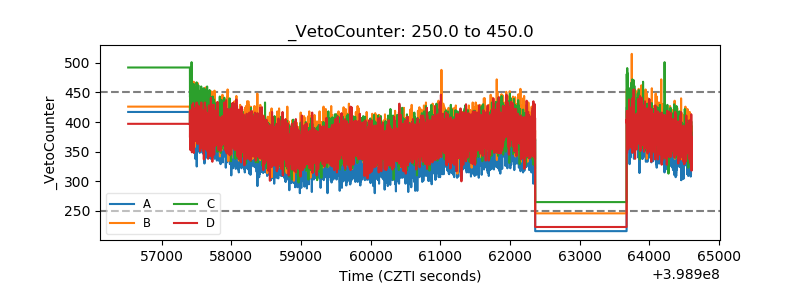 |