| Param | Original file | Final file |
|---|---|---|
| Filename | modeM0/AS1A11_030T02_9000005310_37324cztM0_level2.evt | modeM0/AS1A11_030T02_9000005310_37324cztM0_level2_quad_clean.evt |
| Size (bytes) | 540,527,040 | 65,998,080 |
| Size | 515.5 MB | 62.9 MB |
| Events in quadrant A | 3,346,425 | 404,663 |
| Events in quadrant B | 3,121,171 | 410,577 |
| Events in quadrant C | 4,738,872 | 390,404 |
| Events in quadrant D | 4,756,664 | 373,271 |
| Mode M0 | |||
|---|---|---|---|
| Quadrant | BADHDUFLAG | Total packets | Discarded packets |
| A | 0 | 13720 | 3 |
| B | 0 | 13113 | 2 |
| C | 0 | 17882 | 2 |
| D | 0 | 18137 | 2 |
| Mode SS | |||
|---|---|---|---|
| Quadrant | BADHDUFLAG | Total packets | Discarded packets |
| A | 0 | 122 | 0 |
| B | 0 | 122 | 0 |
| C | 0 | 122 | 0 |
| D | 0 | 122 | 0 |
| Mode M9 | |||
|---|---|---|---|
| Quadrant | BADHDUFLAG | Total packets | Discarded packets |
| A | 0 | 24 | 0 |
| B | 0 | 24 | 0 |
| C | 0 | 24 | 0 |
| D | 0 | 25 | 0 |
| Quadrant | Total seconds | Saturated seconds | Saturation percentage |
|---|---|---|---|
| A | 6002 | 77 | 1.282906% |
| B | 6002 | 117 | 1.949350% |
| C | 6002 | 430 | 7.164279% |
| D | 6002 | 556 | 9.263579% |
Noise dominated data is calculated using 1-second bins in cleaned event files. If a bin has >2000 counts, and if more than 50% of those come from <1% of pixels, then it is considered to be noise-dominated and hence unusable.
| Quadrant | # 1 sec bins | Bins with >0 counts | Bins with >2000 counts | High rate bins dominated by noise | Noise dominated (total time) | Noise dominated (detector-on time) | Marked lightcurve |
|---|---|---|---|---|---|---|---|
| A | 7315 | 6003 | 46 | 46 | 0.63% | 0.77% | 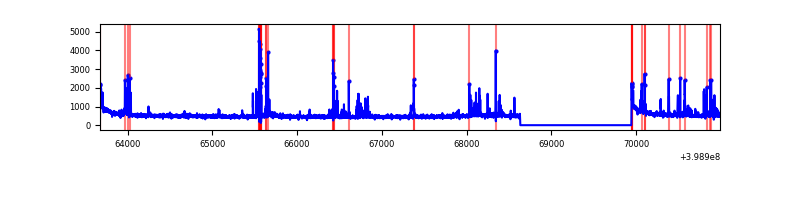 |
| B | 7315 | 6003 | 51 | 51 | 0.70% | 0.85% | 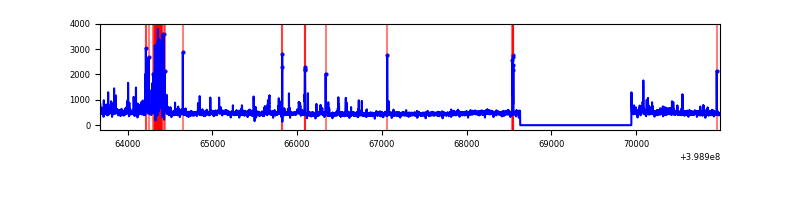 |
| C | 7315 | 6003 | 378 | 378 | 5.17% | 6.30% | 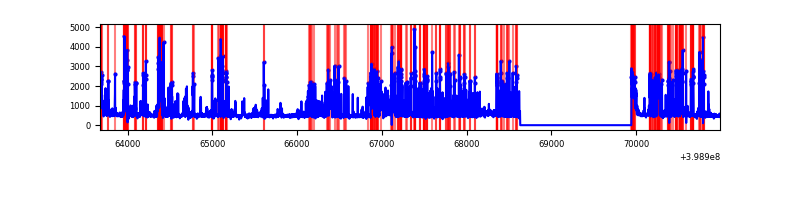 |
| D | 7315 | 6003 | 439 | 439 | 6.00% | 7.31% | 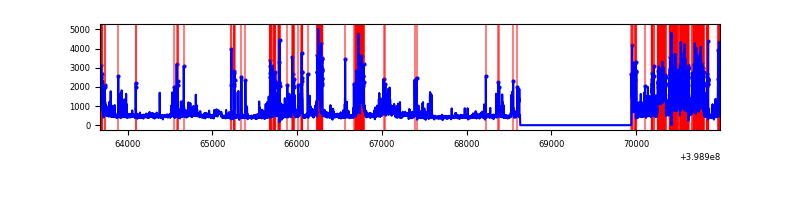 |
Top three noisy pixels from each quadrant. If the there are fewer than three noisy pixels in the level2.evt file, extra rows are filled as -1
| Pixel properties | Quadrant properties | ||||||
|---|---|---|---|---|---|---|---|
| Quadrant | DetID | PixID | Counts | Sigma | Mean | Median | Sigma |
| A | 10 | 83 | 311507 | 2268.6 | 678 | 665 | 137.0 |
| A | 13 | 248 | 182844 | 1329.59 | 678 | 665 | 137.0 |
| A | 15 | 237 | 101803 | 738.13 | 678 | 665 | 137.0 |
| B | 12 | 2 | 117750 | 907.53 | 671 | 655 | 129.0 |
| B | 12 | 18 | 113393 | 873.77 | 671 | 655 | 129.0 |
| B | 0 | 190 | 83099 | 638.98 | 671 | 655 | 129.0 |
| C | 1 | 23 | 1570243 | 10427.65 | 645 | 648 | 150.5 |
| C | 14 | 254 | 270715 | 1794.2 | 645 | 648 | 150.5 |
| C | 15 | 214 | 246056 | 1630.37 | 645 | 648 | 150.5 |
| D | 2 | 249 | 1107950 | 7006.01 | 639 | 620 | 158.1 |
| D | 13 | 249 | 511165 | 3230.19 | 639 | 620 | 158.1 |
| D | 13 | 171 | 365465 | 2308.35 | 639 | 620 | 158.1 |
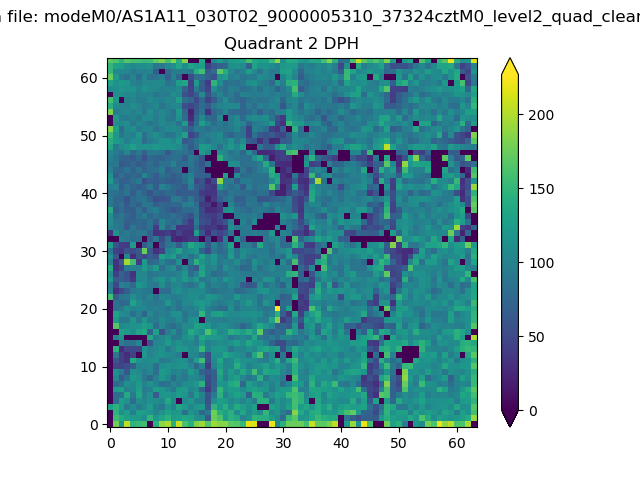
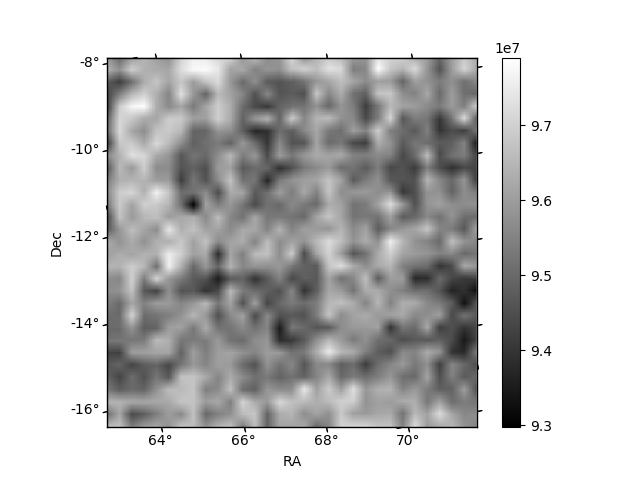
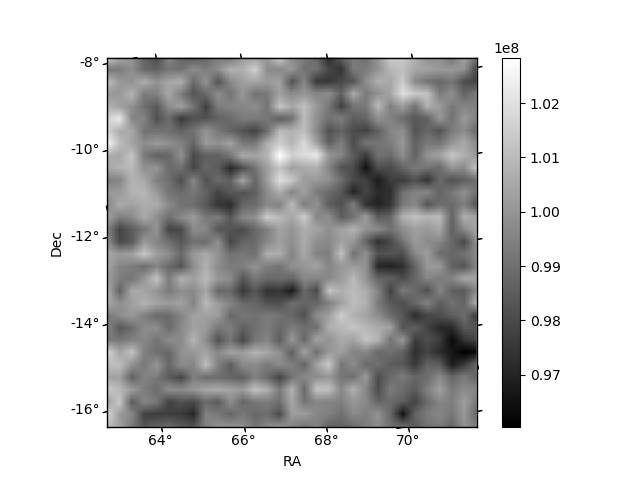
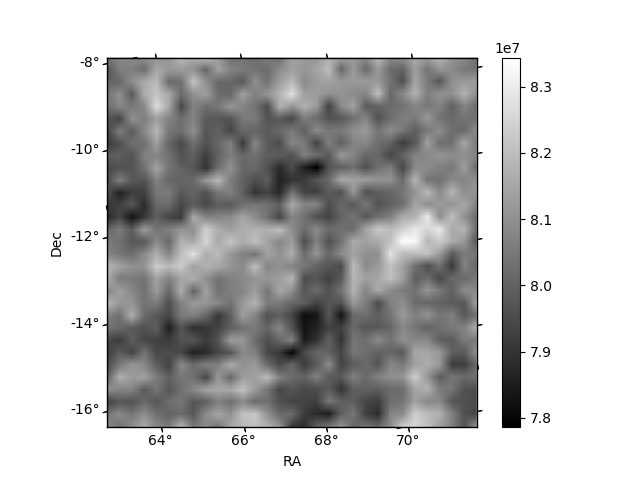
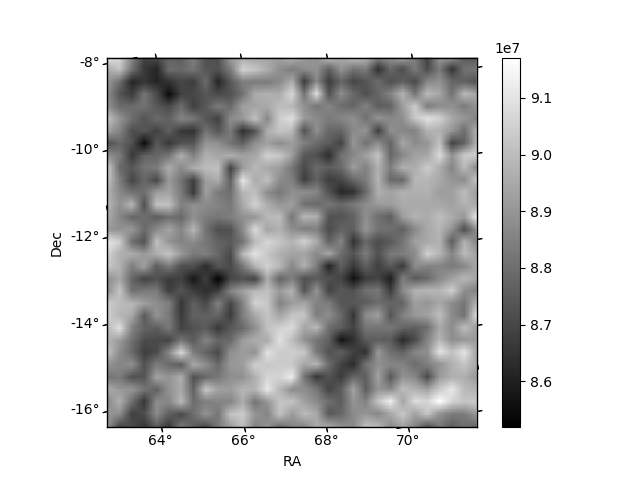
Histogram calculated using DETX and DETY for each event in the final _common_clean file
| Quadrant A | 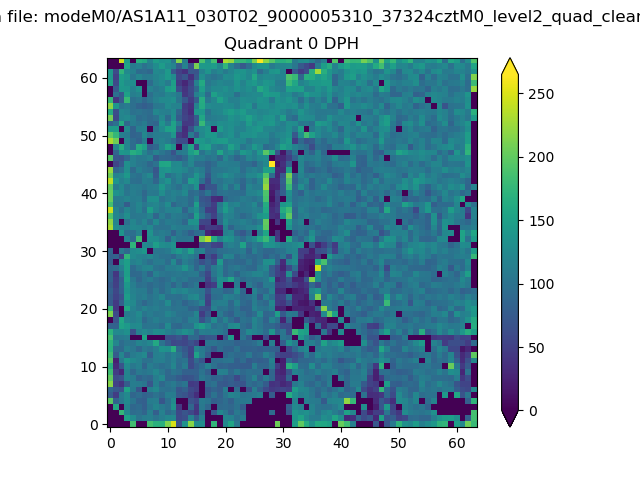 |
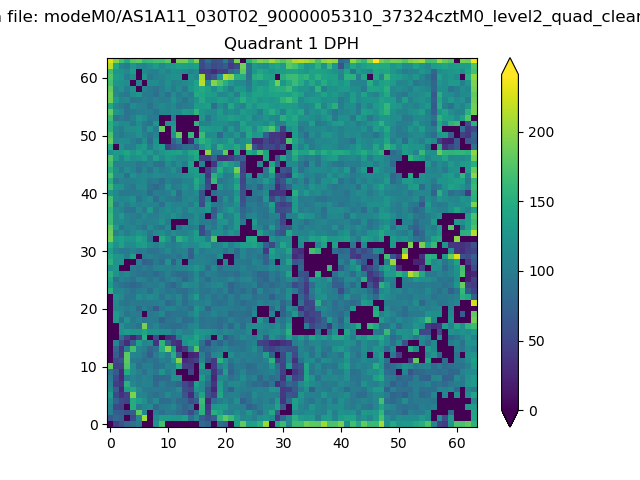 |
Quadrant B |
|---|---|---|---|
| Quadrant D | 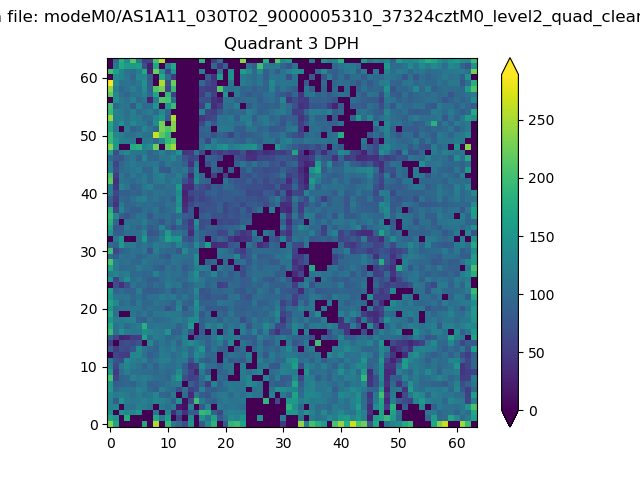 |
 |
Quadrant C |
| Plot type | Count rate plots | Images |
|---|---|---|
| Comparison with Poisson distribution Blue bars denote a histogram of data divided into 1 sec bins. Red curve is a Poisson curve with rate = median count rate of data. |
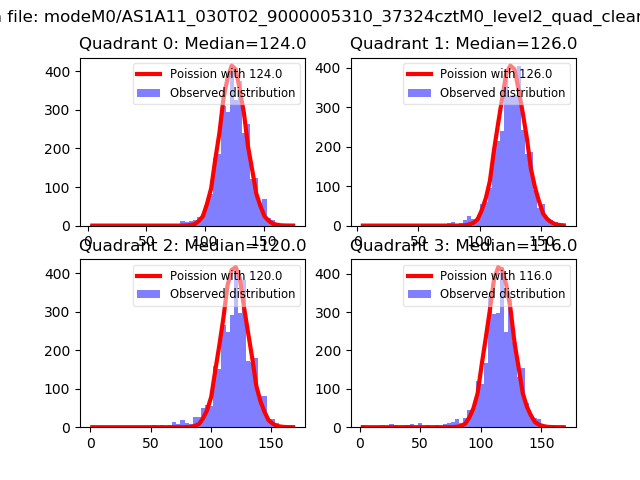 |
 |
| Quadrant-wise count rates Data is divided into 100 sec bins |
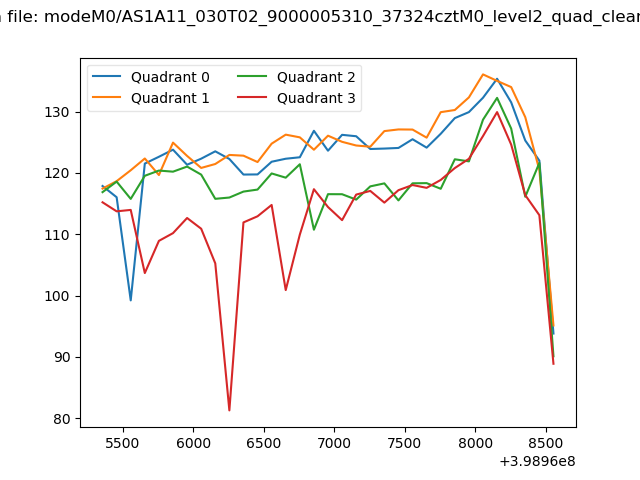 |
|
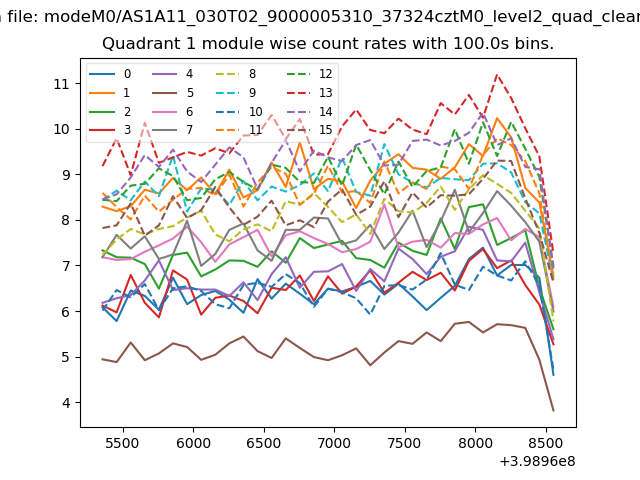
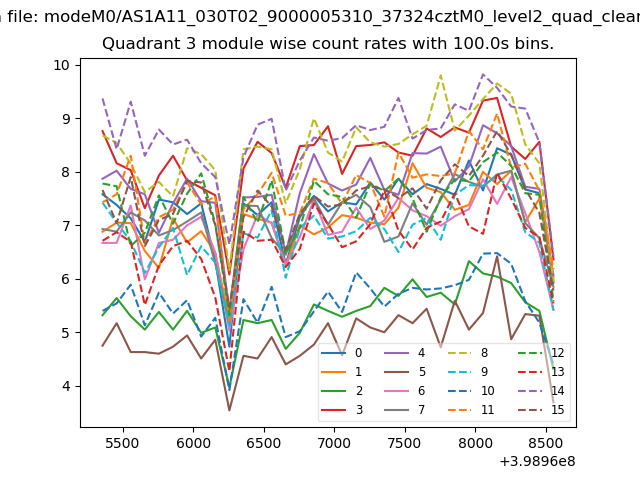
| Module-wise count rates for Quadrant A Data is divided into 100 sec bins |
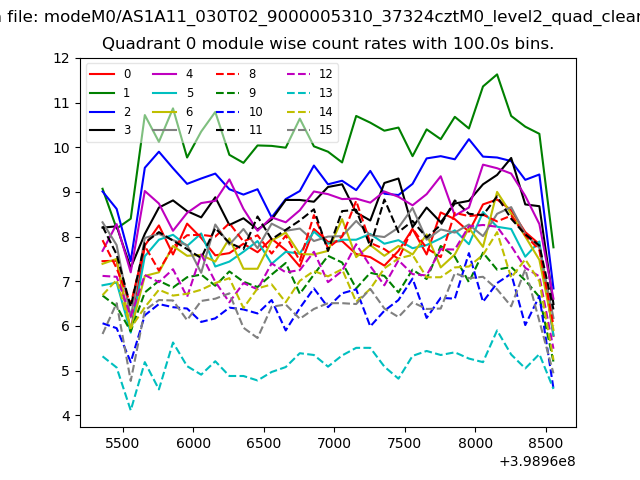 |
 |
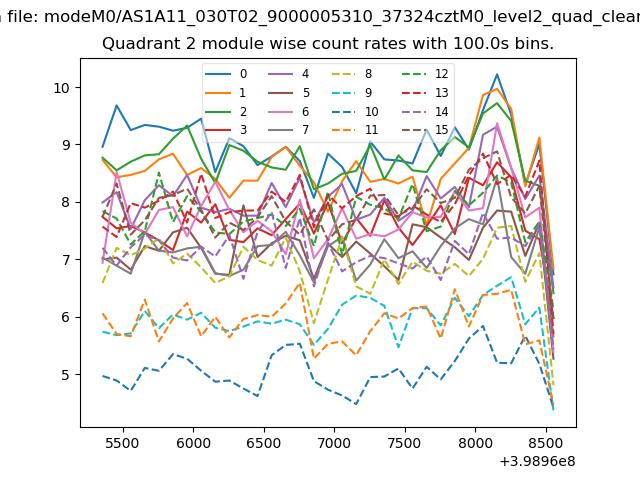
| Module-wise count rates for Quadrant B Data is divided into 100 sec bins |
 |
 |
| Module-wise count rates for Quadrant C Data is divided into 100 sec bins |
 |
 |
| Module-wise count rates for Quadrant D Data is divided into 100 sec bins |
 |
 |
| Parameter | Plot |
|---|---|
| CZT HV Monitor | 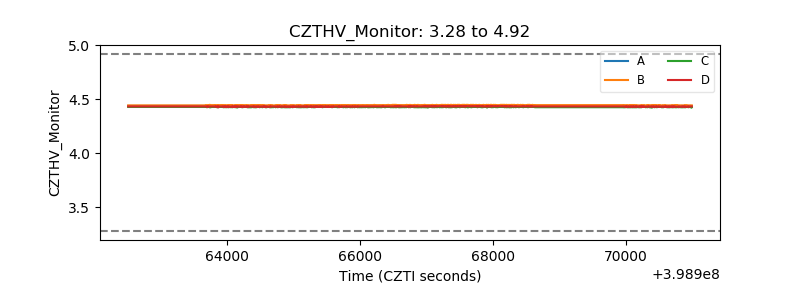 |
| D_VDD | 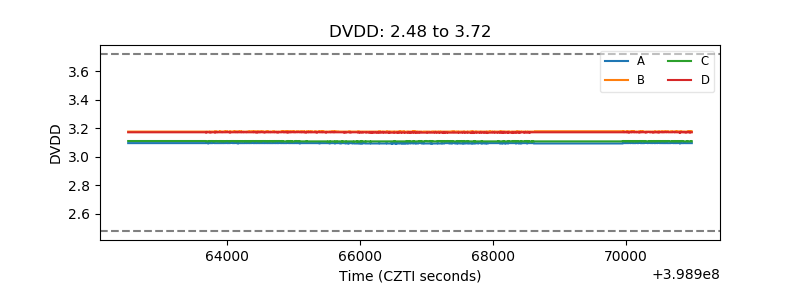 |
| Temperature 1 | 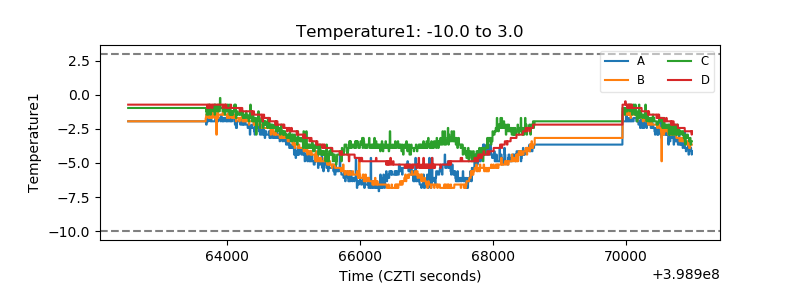 |
| Veto HV Monitor | 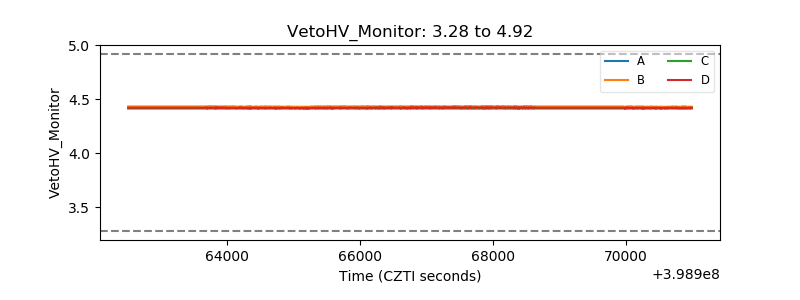 |
| Veto LLD | 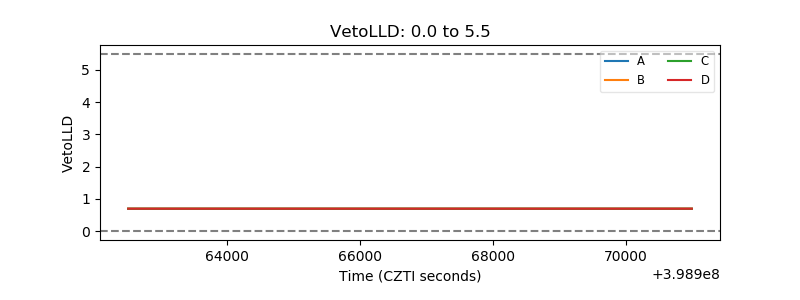 |
| Alpha Counter | 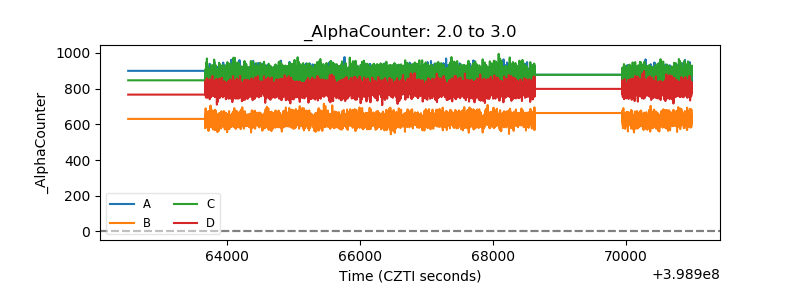 |
| _CPM_Rate | 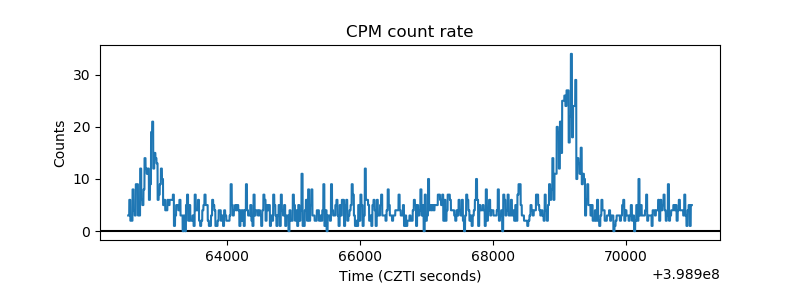 |
| CZT Counter | 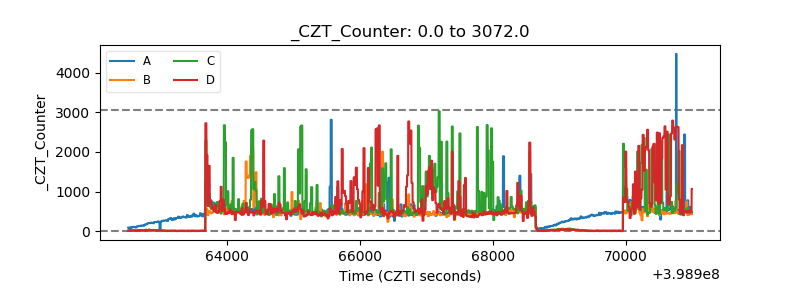 |
| +2.5 Volts monitor | 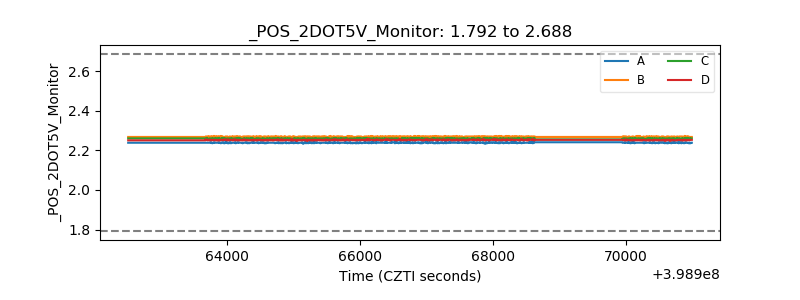 |
| +5 Volts monitor | 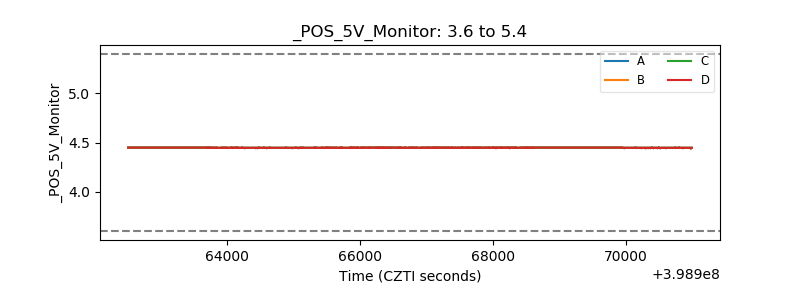 |
| _ROLL_ROT | 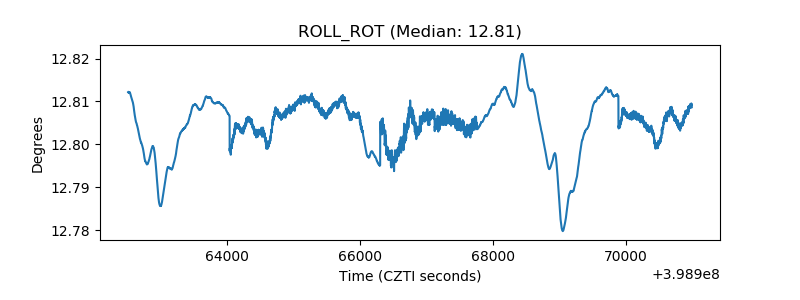 |
| _Roll_DEC | 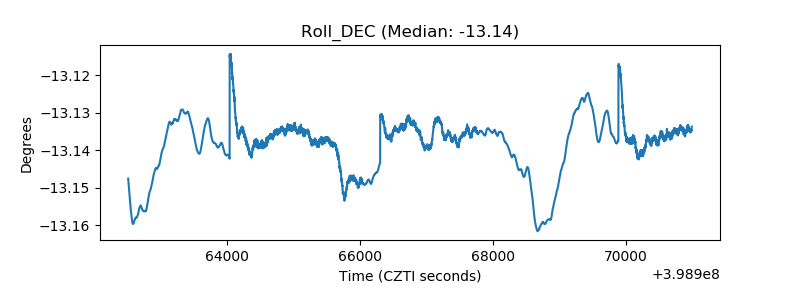 |
| _Roll_RA | 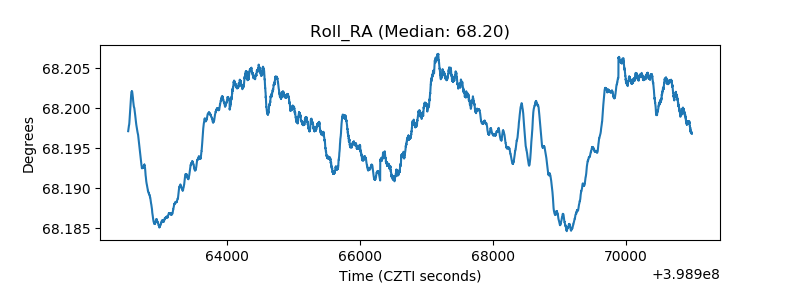 |
| Veto Counter | 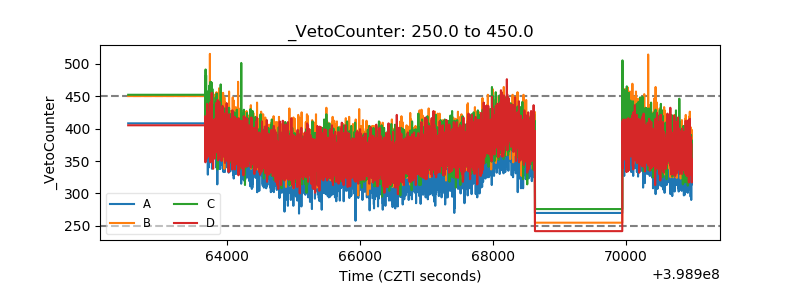 |