| Param | Original file | Final file |
|---|---|---|
| Filename | modeM0/AS1A11_030T02_9000005310_37327cztM0_level2.evt | modeM0/AS1A11_030T02_9000005310_37327cztM0_level2_quad_clean.evt |
| Size (bytes) | 609,059,520 | 82,998,720 |
| Size | 580.8 MB | 79.2 MB |
| Events in quadrant A | 3,090,211 | 561,055 |
| Events in quadrant B | 2,998,255 | 567,140 |
| Events in quadrant C | 4,393,733 | 526,268 |
| Events in quadrant D | 7,577,905 | 460,648 |
| Mode M0 | |||
|---|---|---|---|
| Quadrant | BADHDUFLAG | Total packets | Discarded packets |
| A | 0 | 12906 | 3 |
| B | 0 | 12599 | 2 |
| C | 0 | 16546 | 2 |
| D | 0 | 26577 | 2 |
| Mode SS | |||
|---|---|---|---|
| Quadrant | BADHDUFLAG | Total packets | Discarded packets |
| A | 0 | 116 | 0 |
| B | 0 | 116 | 0 |
| C | 0 | 116 | 0 |
| D | 0 | 116 | 0 |
| Mode M9 | |||
|---|---|---|---|
| Quadrant | BADHDUFLAG | Total packets | Discarded packets |
| A | 0 | 21 | 0 |
| B | 0 | 21 | 0 |
| C | 0 | 21 | 0 |
| D | 0 | 22 | 0 |
| Quadrant | Total seconds | Saturated seconds | Saturation percentage |
|---|---|---|---|
| A | 5684 | 53 | 0.932442% |
| B | 5684 | 88 | 1.548205% |
| C | 5684 | 495 | 8.708656% |
| D | 5684 | 2092 | 36.805067% |
Noise dominated data is calculated using 1-second bins in cleaned event files. If a bin has >2000 counts, and if more than 50% of those come from <1% of pixels, then it is considered to be noise-dominated and hence unusable.
| Quadrant | # 1 sec bins | Bins with >0 counts | Bins with >2000 counts | High rate bins dominated by noise | Noise dominated (total time) | Noise dominated (detector-on time) | Marked lightcurve |
|---|---|---|---|---|---|---|---|
| A | 7268 | 5685 | 29 | 29 | 0.40% | 0.51% | 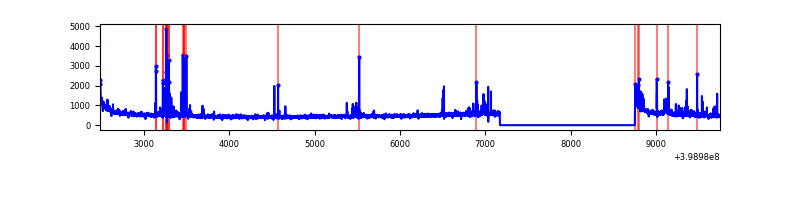 |
| B | 7268 | 5685 | 56 | 56 | 0.77% | 0.99% | 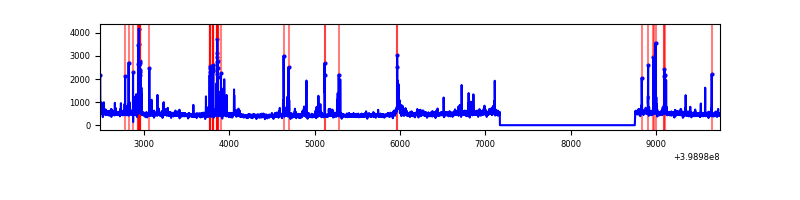 |
| C | 7268 | 5685 | 413 | 413 | 5.68% | 7.26% | 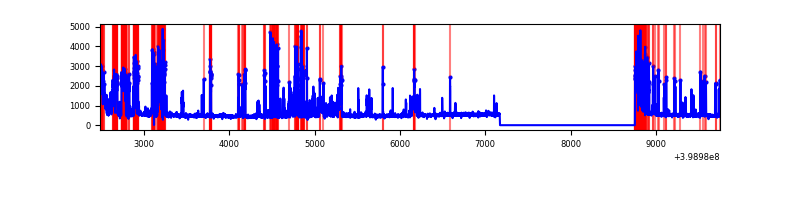 |
| D | 7268 | 5685 | 1983 | 1983 | 27.28% | 34.88% | 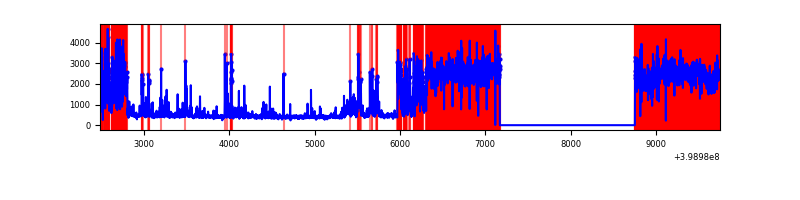 |
Top three noisy pixels from each quadrant. If the there are fewer than three noisy pixels in the level2.evt file, extra rows are filled as -1
| Pixel properties | Quadrant properties | ||||||
|---|---|---|---|---|---|---|---|
| Quadrant | DetID | PixID | Counts | Sigma | Mean | Median | Sigma |
| A | 10 | 83 | 285504 | 2169.01 | 646 | 633 | 131.3 |
| A | 15 | 237 | 125964 | 954.27 | 646 | 633 | 131.3 |
| A | 13 | 248 | 69190 | 521.99 | 646 | 633 | 131.3 |
| B | 5 | 172 | 210081 | 1702.78 | 644 | 628 | 123.0 |
| B | 12 | 18 | 83453 | 673.34 | 644 | 628 | 123.0 |
| B | 5 | 184 | 38784 | 310.19 | 644 | 628 | 123.0 |
| C | 1 | 23 | 1343566 | 9254.59 | 611 | 615 | 145.1 |
| C | 14 | 254 | 310736 | 2137.12 | 611 | 615 | 145.1 |
| C | 15 | 214 | 229635 | 1578.23 | 611 | 615 | 145.1 |
| D | 12 | 227 | 4612310 | 35700.99 | 519 | 503 | 129.2 |
| D | 13 | 249 | 543078 | 4200.19 | 519 | 503 | 129.2 |
| D | 2 | 249 | 236737 | 1828.74 | 519 | 503 | 129.2 |
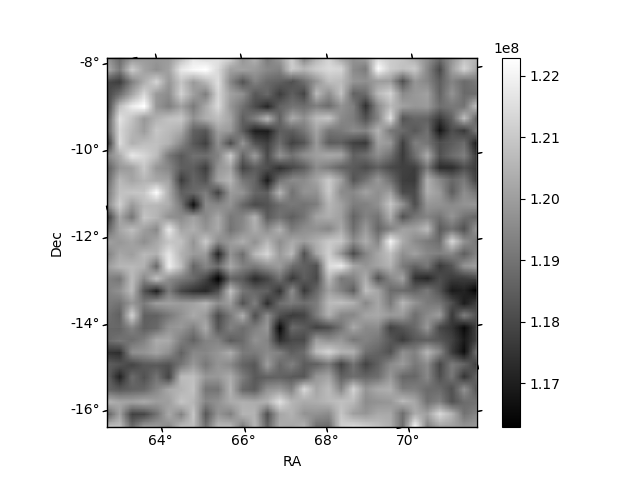
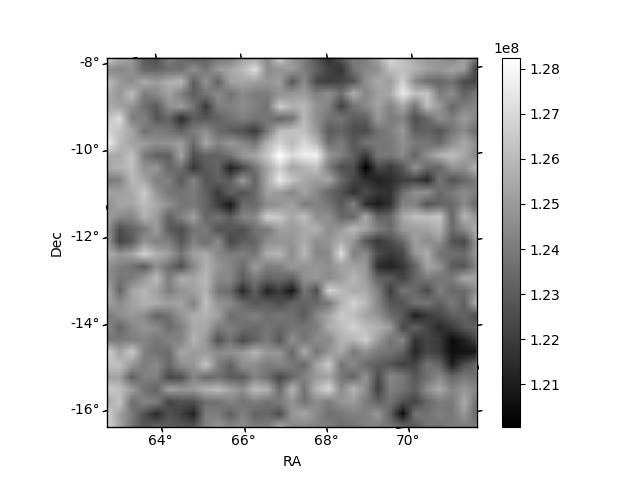
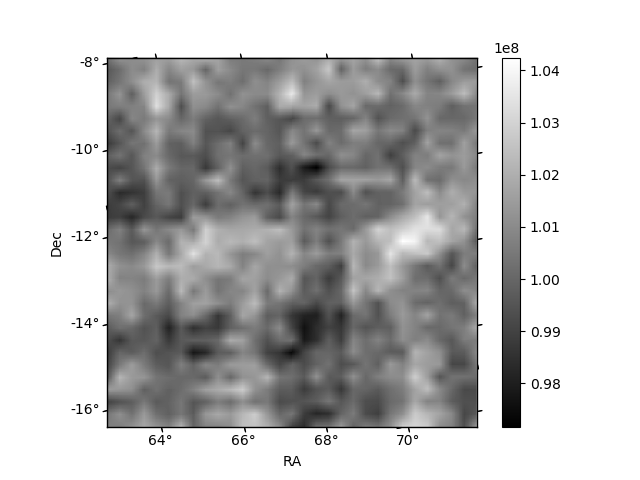
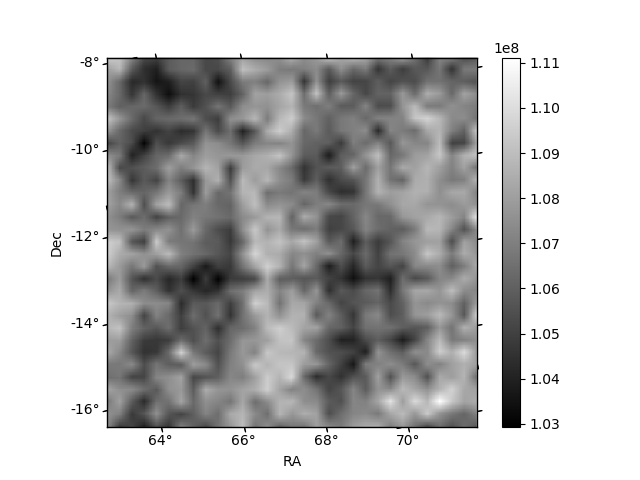
Histogram calculated using DETX and DETY for each event in the final _common_clean file
| Quadrant A | 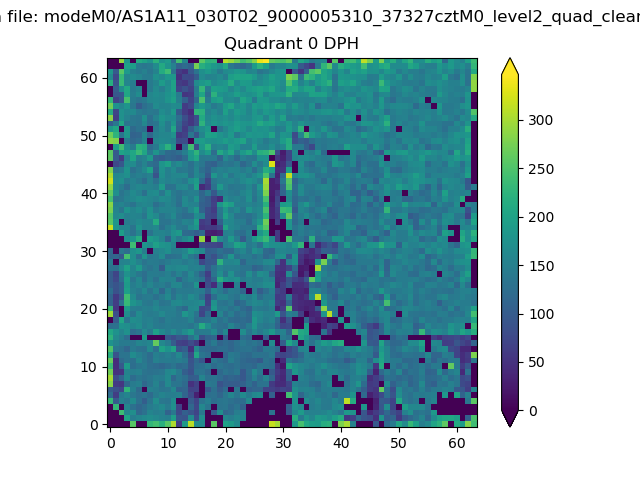 |
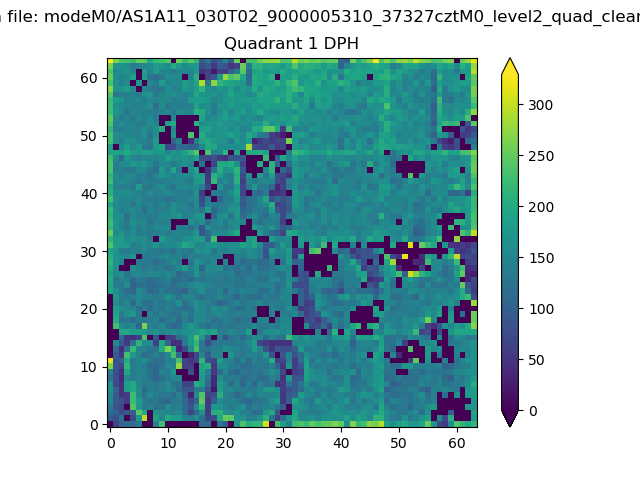 |
Quadrant B |
|---|---|---|---|
| Quadrant D | 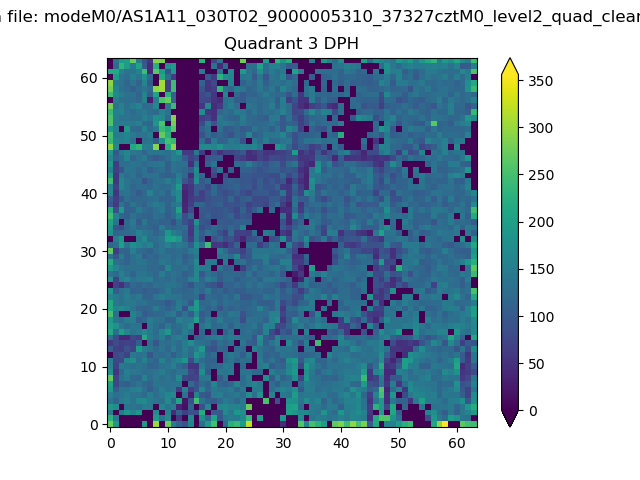 |
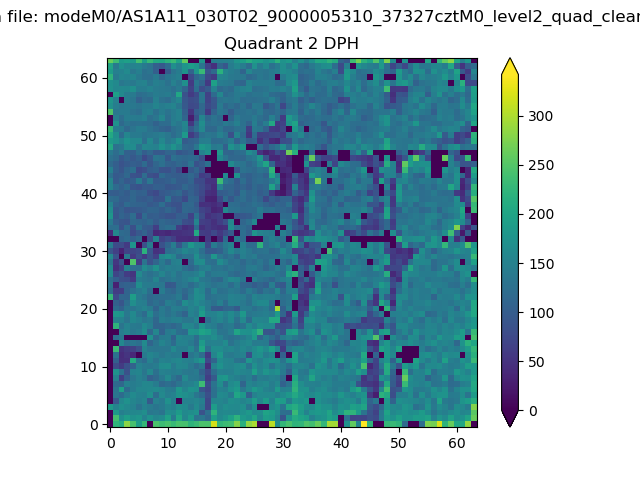 |
Quadrant C |
| Plot type | Count rate plots | Images |
|---|---|---|
| Comparison with Poisson distribution Blue bars denote a histogram of data divided into 1 sec bins. Red curve is a Poisson curve with rate = median count rate of data. |
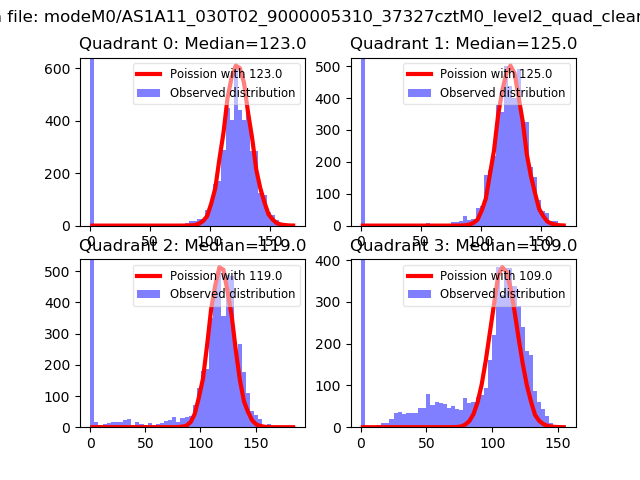 |
 |
| Quadrant-wise count rates Data is divided into 100 sec bins |
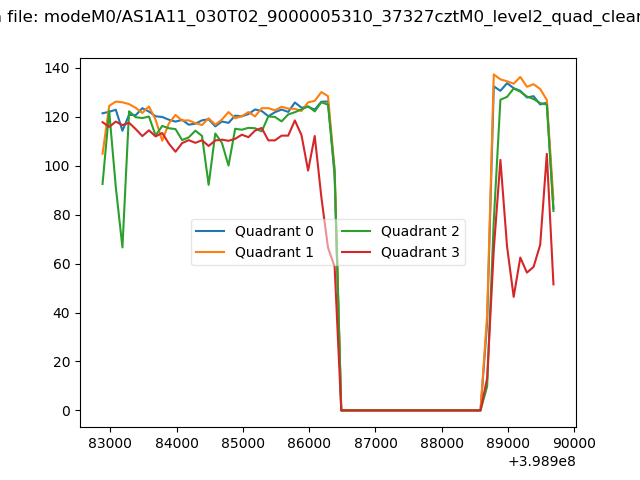 |
|
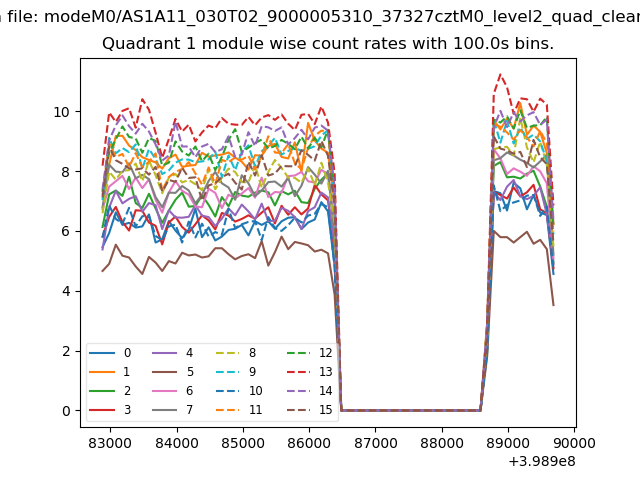
| Module-wise count rates for Quadrant A Data is divided into 100 sec bins |
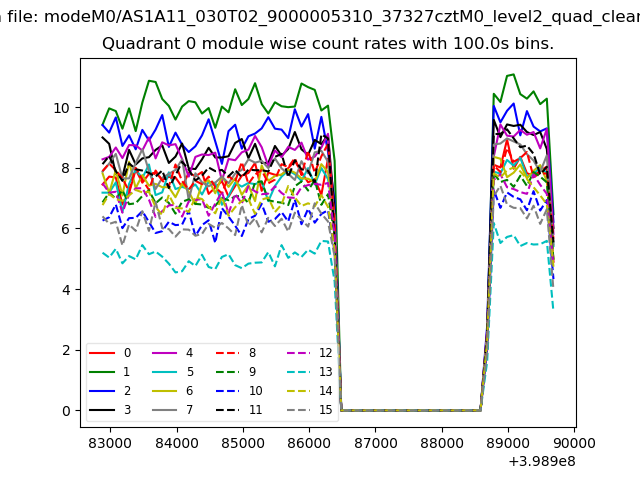 |
 |
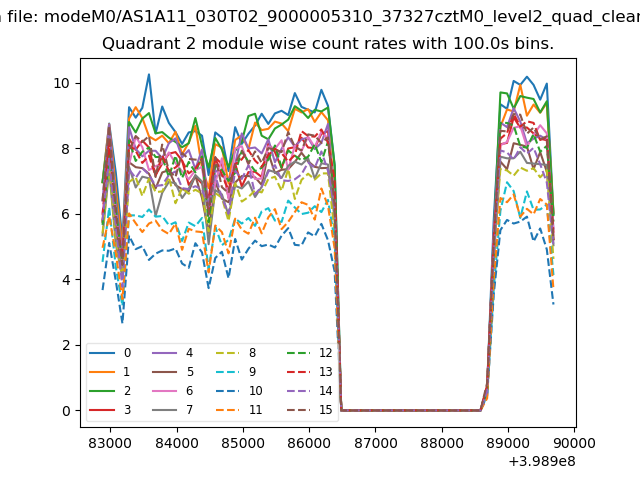
| Module-wise count rates for Quadrant B Data is divided into 100 sec bins |
 |
 |
| Module-wise count rates for Quadrant C Data is divided into 100 sec bins |
 |
 |
| Module-wise count rates for Quadrant D Data is divided into 100 sec bins |
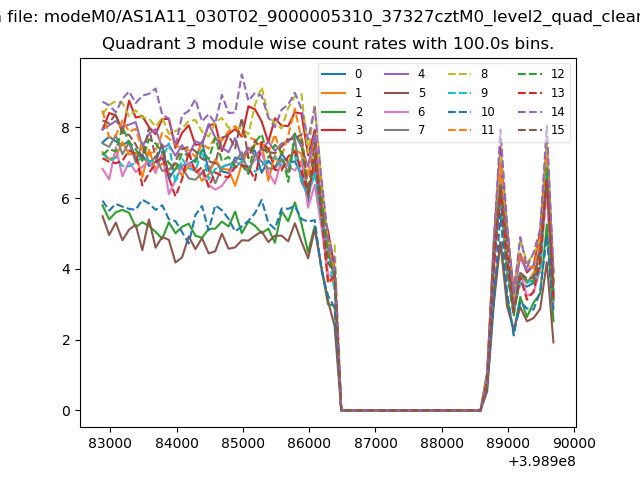 |
 |
| Parameter | Plot |
|---|---|
| CZT HV Monitor | 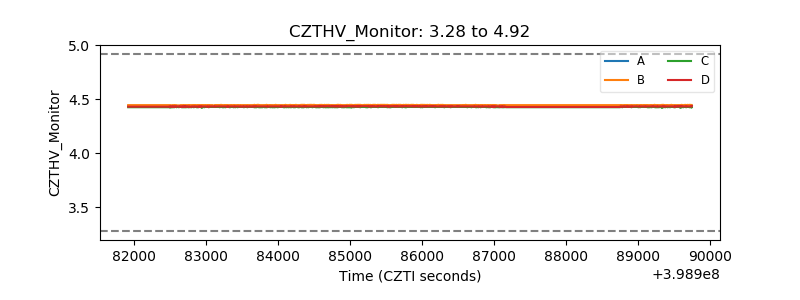 |
| D_VDD | 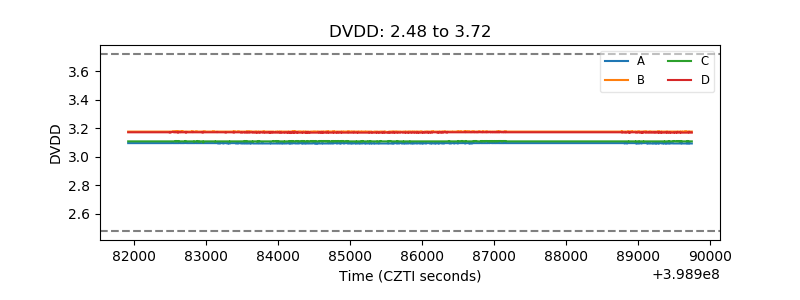 |
| Temperature 1 | 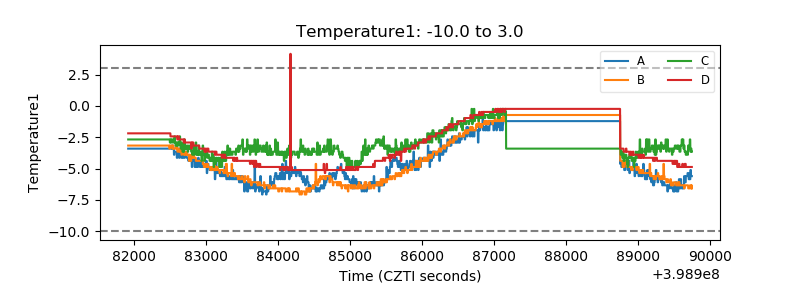 |
| Veto HV Monitor | 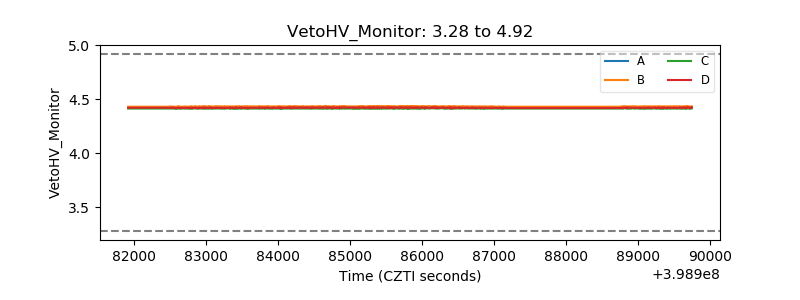 |
| Veto LLD | 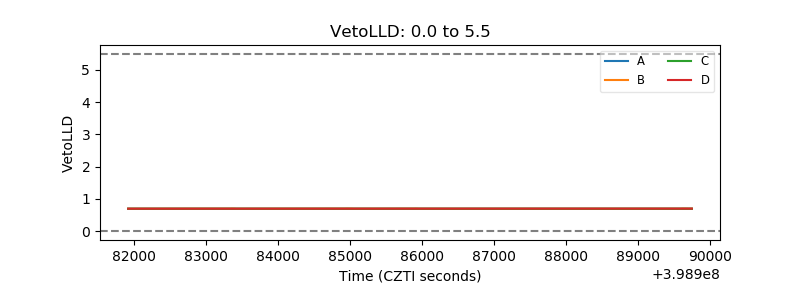 |
| Alpha Counter | 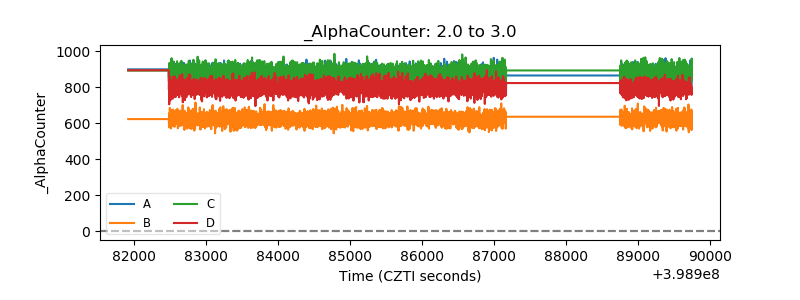 |
| _CPM_Rate | 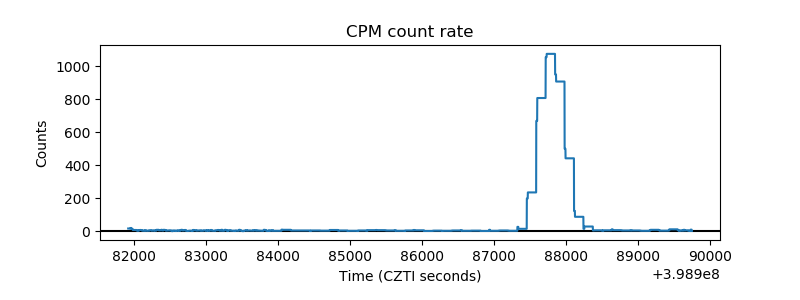 |
| CZT Counter | 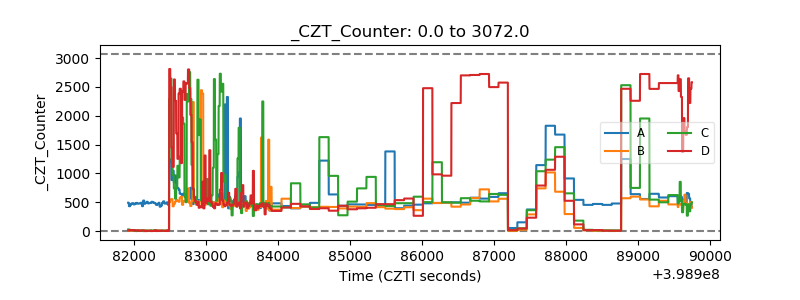 |
| +2.5 Volts monitor | 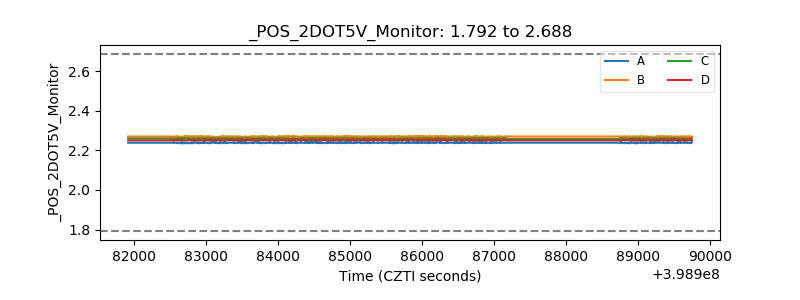 |
| +5 Volts monitor | 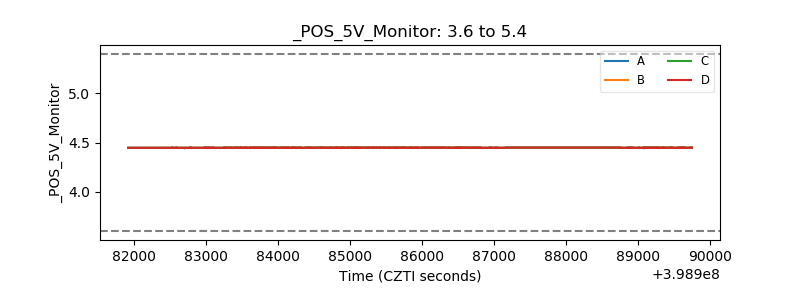 |
| _ROLL_ROT | 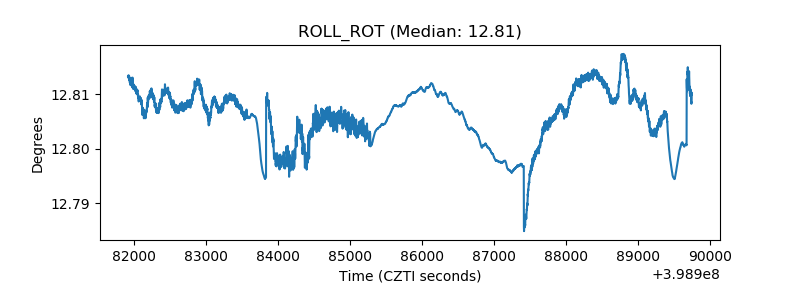 |
| _Roll_DEC | 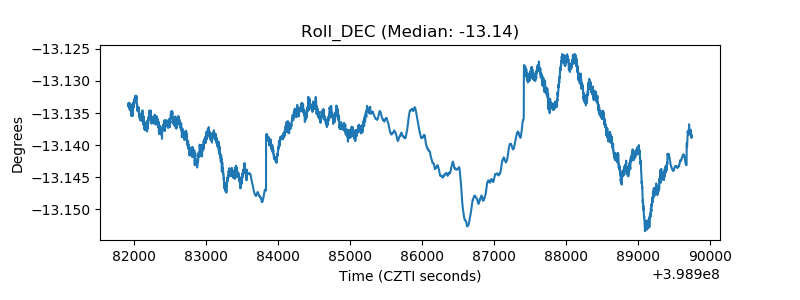 |
| _Roll_RA | 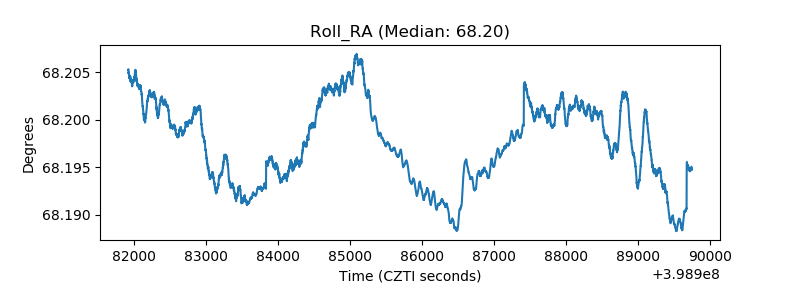 |
| Veto Counter | 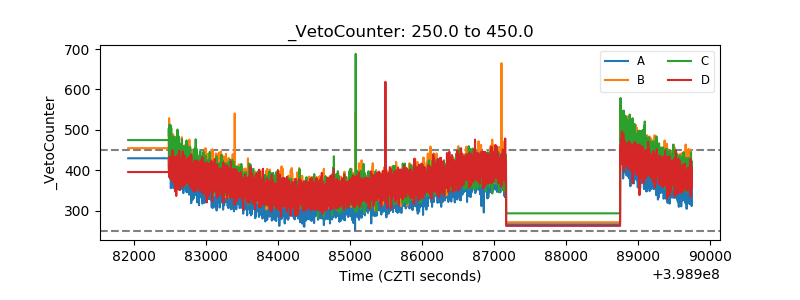 |