| Param | Original file | Final file |
|---|---|---|
| Filename | modeM0/AS1A11_030T02_9000005310_37328cztM0_level2.evt | modeM0/AS1A11_030T02_9000005310_37328cztM0_level2_quad_clean.evt |
| Size (bytes) | 763,799,040 | 78,016,320 |
| Size | 728.4 MB | 74.4 MB |
| Events in quadrant A | 2,990,640 | 562,225 |
| Events in quadrant B | 2,858,678 | 576,415 |
| Events in quadrant C | 4,594,996 | 528,283 |
| Events in quadrant D | 12,320,332 | 313,369 |
| Mode M0 | |||
|---|---|---|---|
| Quadrant | BADHDUFLAG | Total packets | Discarded packets |
| A | 0 | 12415 | 3 |
| B | 0 | 12098 | 2 |
| C | 0 | 17111 | 2 |
| D | 0 | 40255 | 2 |
| Mode SS | |||
|---|---|---|---|
| Quadrant | BADHDUFLAG | Total packets | Discarded packets |
| A | 0 | 110 | 0 |
| B | 0 | 110 | 0 |
| C | 0 | 110 | 0 |
| D | 0 | 110 | 0 |
| Mode M9 | |||
|---|---|---|---|
| Quadrant | BADHDUFLAG | Total packets | Discarded packets |
| A | 0 | 27 | 0 |
| B | 0 | 27 | 0 |
| C | 0 | 27 | 0 |
| D | 0 | 28 | 0 |
| Quadrant | Total seconds | Saturated seconds | Saturation percentage |
|---|---|---|---|
| A | 5437 | 49 | 0.901232% |
| B | 5437 | 83 | 1.526577% |
| C | 5437 | 534 | 9.821593% |
| D | 5437 | 4104 | 75.482803% |
Noise dominated data is calculated using 1-second bins in cleaned event files. If a bin has >2000 counts, and if more than 50% of those come from <1% of pixels, then it is considered to be noise-dominated and hence unusable.
| Quadrant | # 1 sec bins | Bins with >0 counts | Bins with >2000 counts | High rate bins dominated by noise | Noise dominated (total time) | Noise dominated (detector-on time) | Marked lightcurve |
|---|---|---|---|---|---|---|---|
| A | 7170 | 5438 | 27 | 27 | 0.38% | 0.50% | 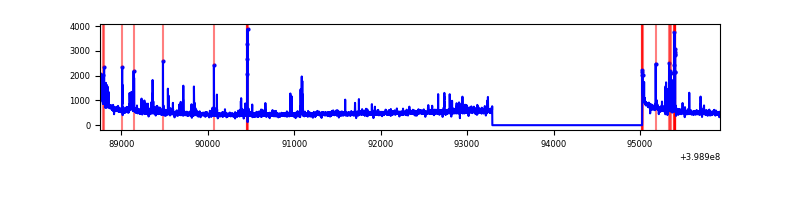 |
| B | 7170 | 5438 | 49 | 49 | 0.68% | 0.90% | 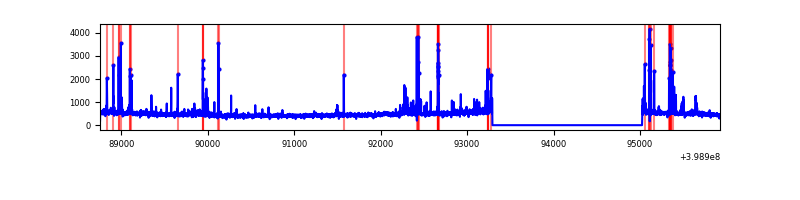 |
| C | 7170 | 5438 | 467 | 467 | 6.51% | 8.59% | 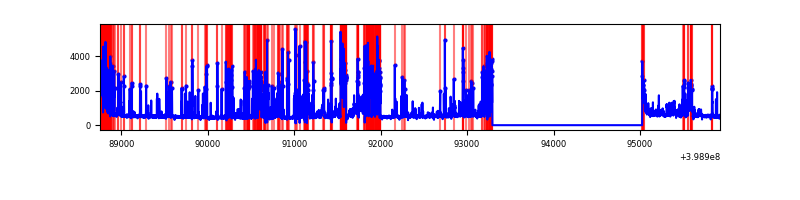 |
| D | 7170 | 5438 | 4189 | 4189 | 58.42% | 77.03% | 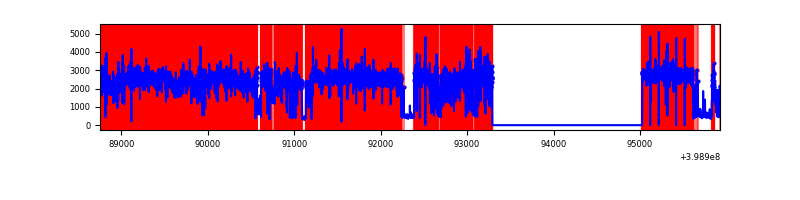 |
Top three noisy pixels from each quadrant. If the there are fewer than three noisy pixels in the level2.evt file, extra rows are filled as -1
| Pixel properties | Quadrant properties | ||||||
|---|---|---|---|---|---|---|---|
| Quadrant | DetID | PixID | Counts | Sigma | Mean | Median | Sigma |
| A | 10 | 83 | 277506 | 2174.59 | 625 | 614 | 127.3 |
| A | 9 | 143 | 94985 | 741.15 | 625 | 614 | 127.3 |
| A | 13 | 248 | 92278 | 719.89 | 625 | 614 | 127.3 |
| B | 5 | 172 | 180046 | 1507.46 | 625 | 608 | 119.0 |
| B | 5 | 184 | 60647 | 504.39 | 625 | 608 | 119.0 |
| B | 0 | 190 | 50758 | 421.31 | 625 | 608 | 119.0 |
| C | 1 | 23 | 1848381 | 13366.25 | 589 | 593 | 138.2 |
| C | 15 | 214 | 218986 | 1579.78 | 589 | 593 | 138.2 |
| C | 0 | 10 | 102999 | 740.77 | 589 | 593 | 138.2 |
| D | 12 | 227 | 10262869 | 102814.45 | 407 | 397 | 99.8 |
| D | 10 | 253 | 131328 | 1311.73 | 407 | 397 | 99.8 |
| D | 2 | 249 | 126058 | 1258.93 | 407 | 397 | 99.8 |
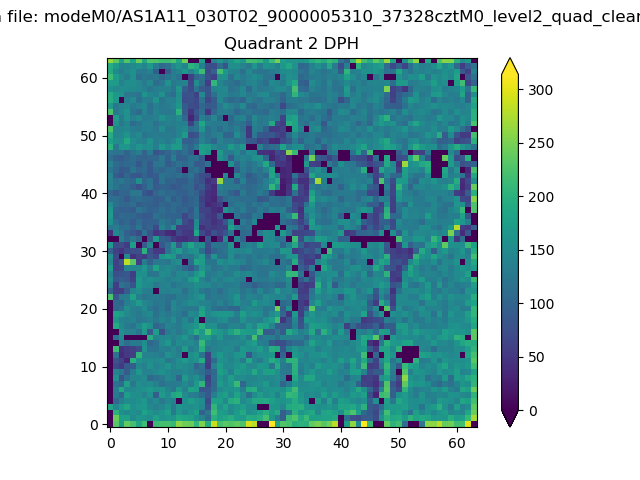
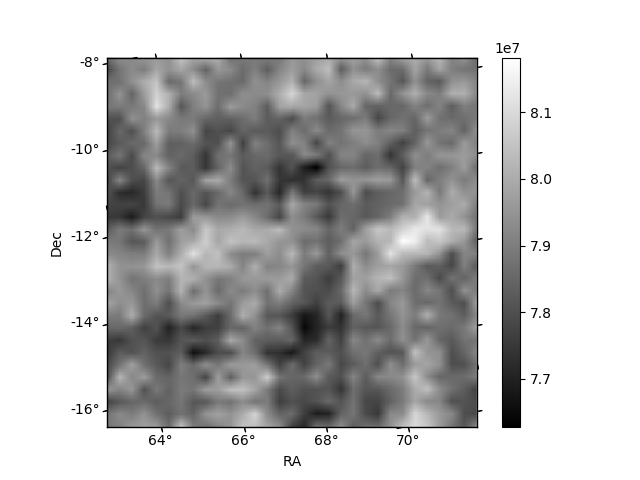
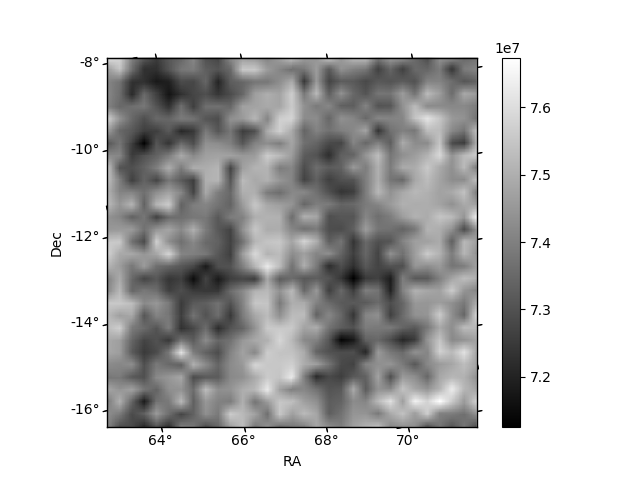
Histogram calculated using DETX and DETY for each event in the final _common_clean file
| Quadrant A | 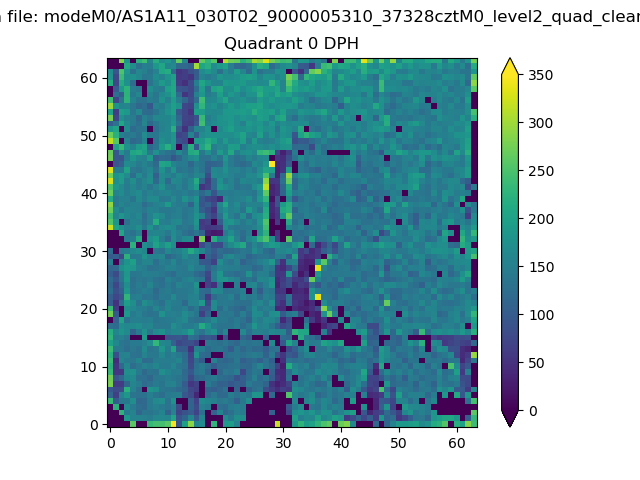 |
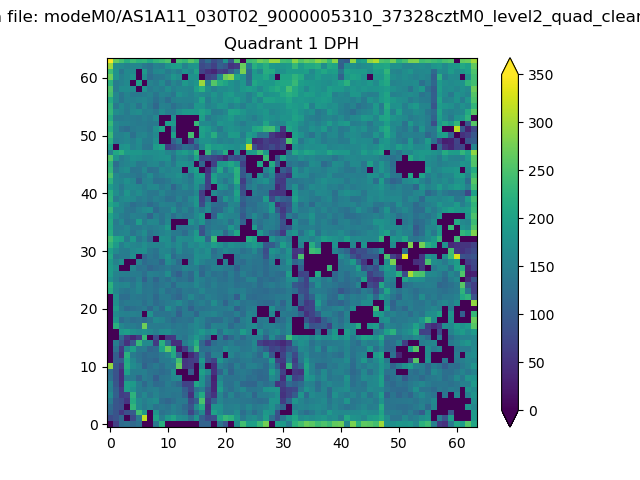 |
Quadrant B |
|---|---|---|---|
| Quadrant D | 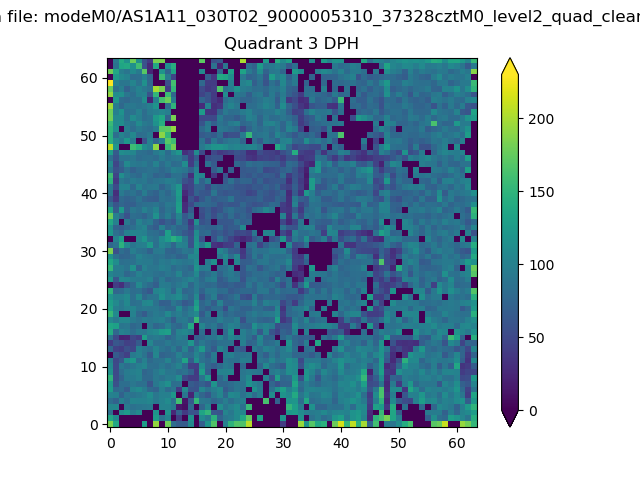 |
 |
Quadrant C |
| Plot type | Count rate plots | Images |
|---|---|---|
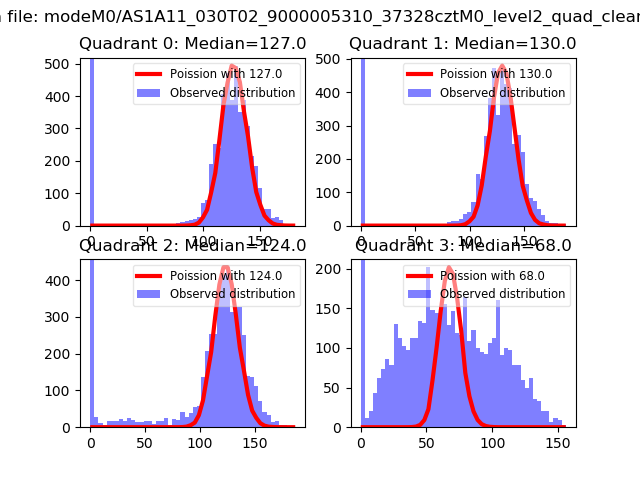
| Comparison with Poisson distribution Blue bars denote a histogram of data divided into 1 sec bins. Red curve is a Poisson curve with rate = median count rate of data. |
 |
 |
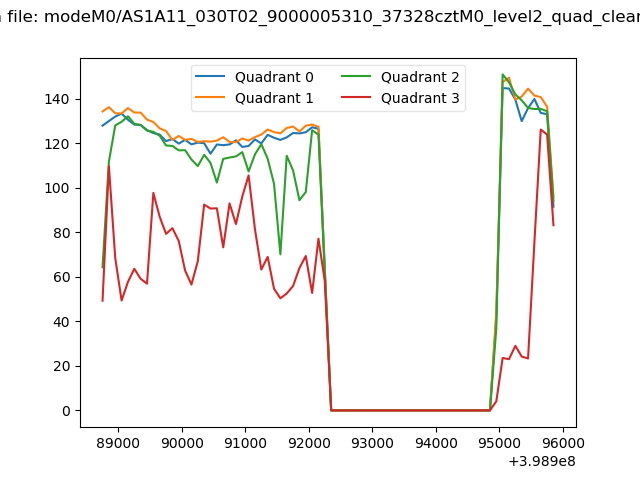
| Quadrant-wise count rates Data is divided into 100 sec bins |
 |
|
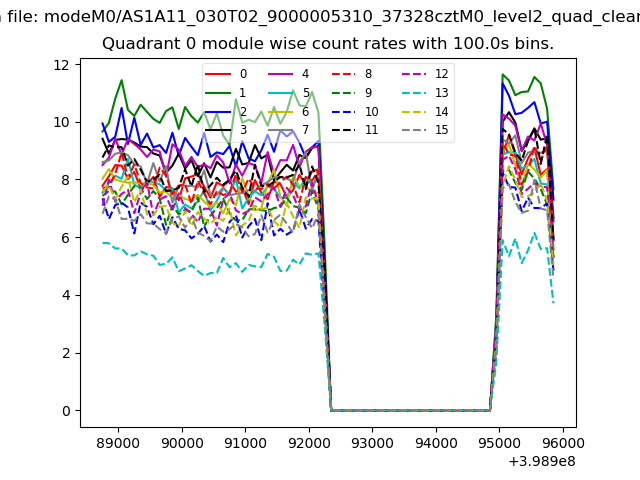
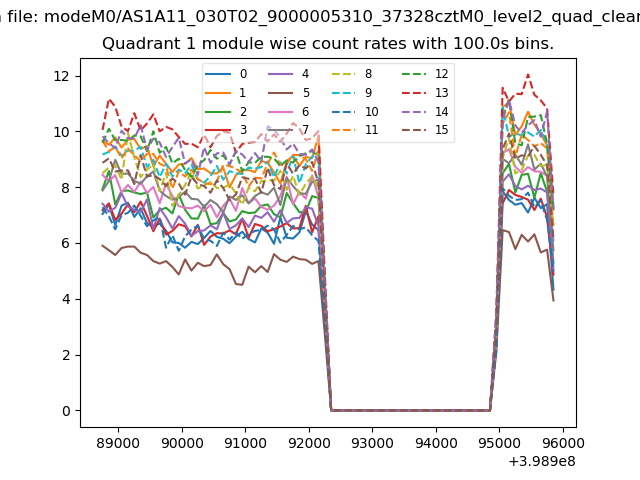
| Module-wise count rates for Quadrant A Data is divided into 100 sec bins |
 |
 |
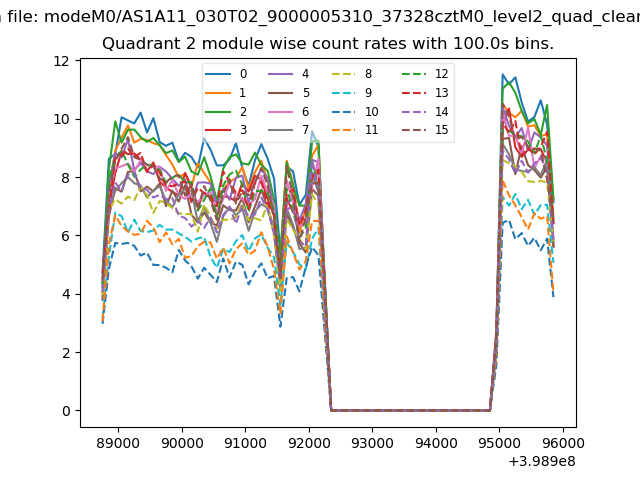
| Module-wise count rates for Quadrant B Data is divided into 100 sec bins |
 |
 |
| Module-wise count rates for Quadrant C Data is divided into 100 sec bins |
 |
 |
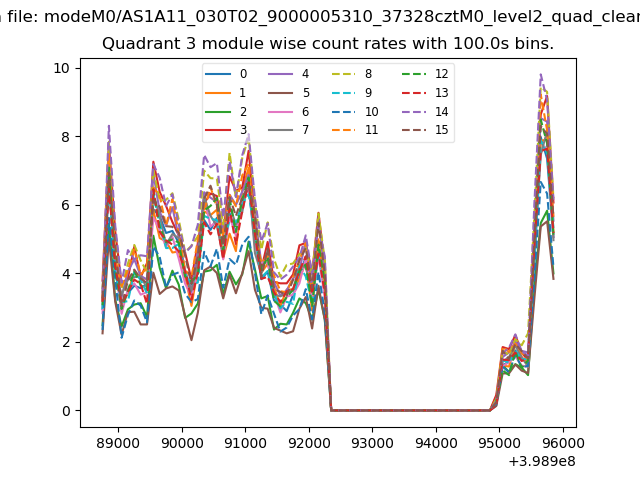
| Module-wise count rates for Quadrant D Data is divided into 100 sec bins |
 |
 |
| Parameter | Plot |
|---|---|
| CZT HV Monitor | 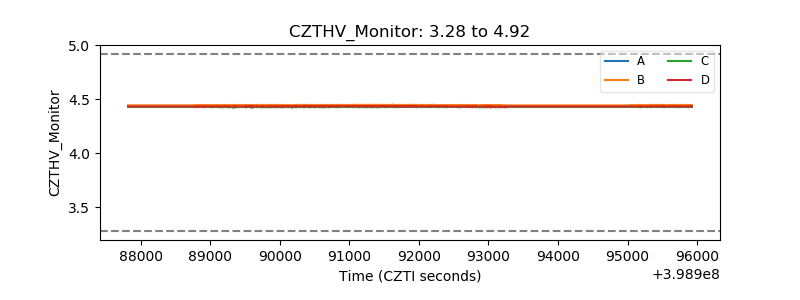 |
| D_VDD | 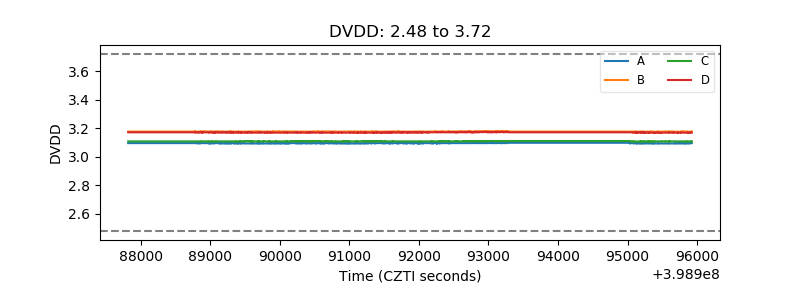 |
| Temperature 1 | 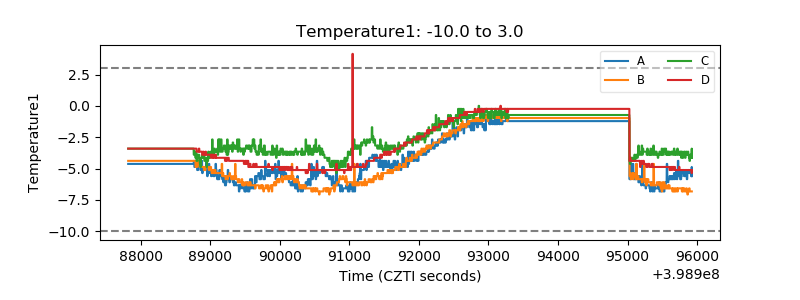 |
| Veto HV Monitor | 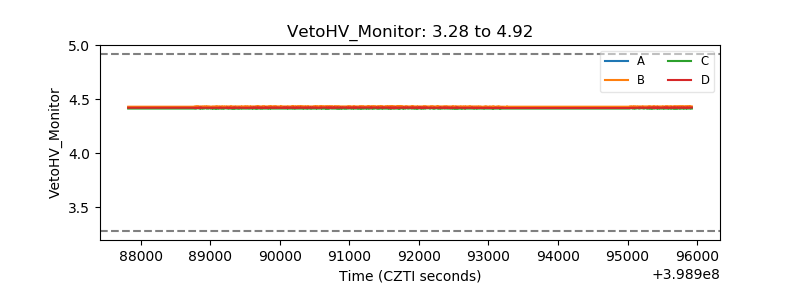 |
| Veto LLD | 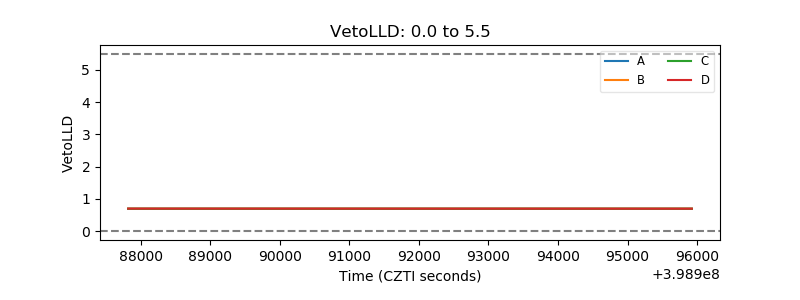 |
| Alpha Counter | 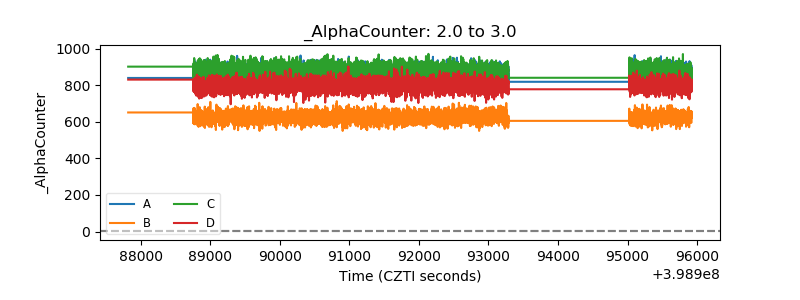 |
| _CPM_Rate | 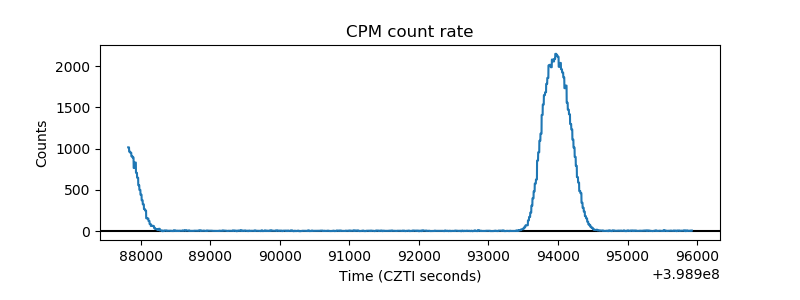 |
| CZT Counter | 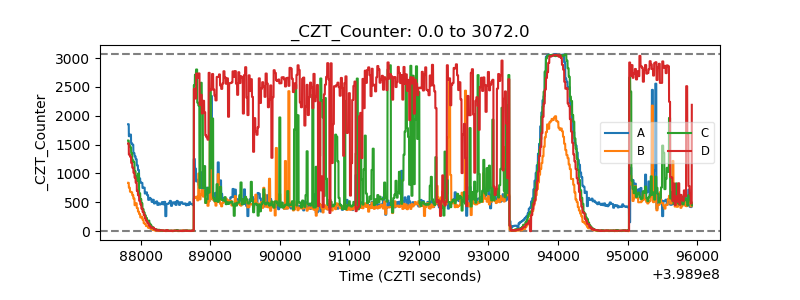 |
| +2.5 Volts monitor | 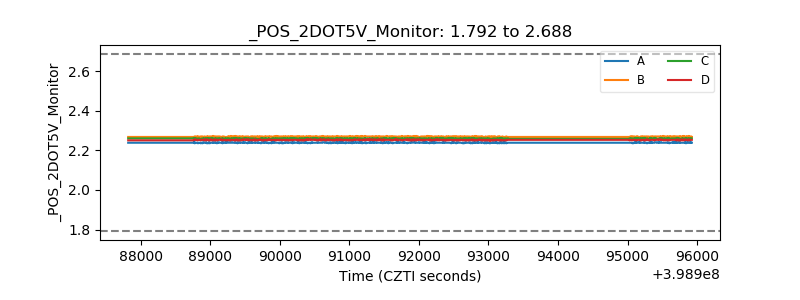 |
| +5 Volts monitor | 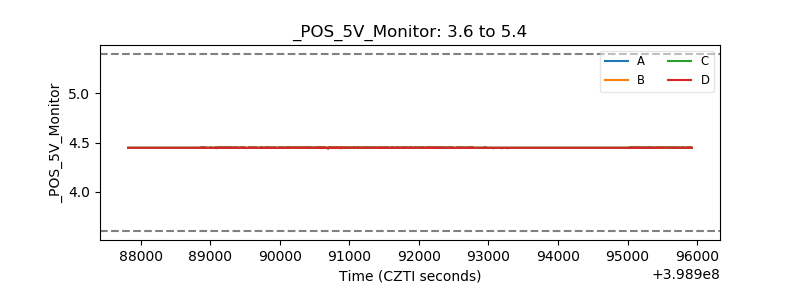 |
| _ROLL_ROT | 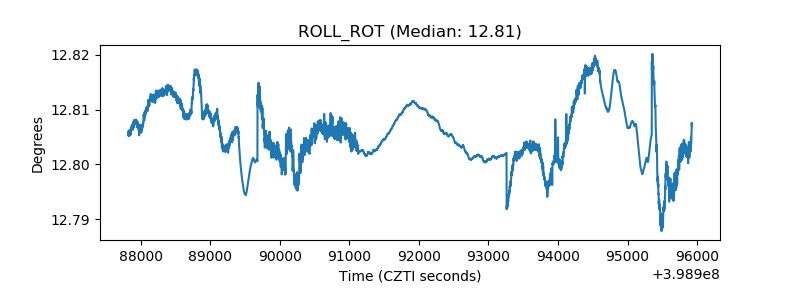 |
| _Roll_DEC | 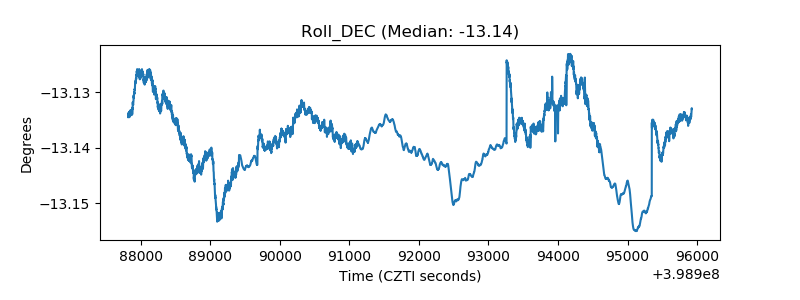 |
| _Roll_RA | 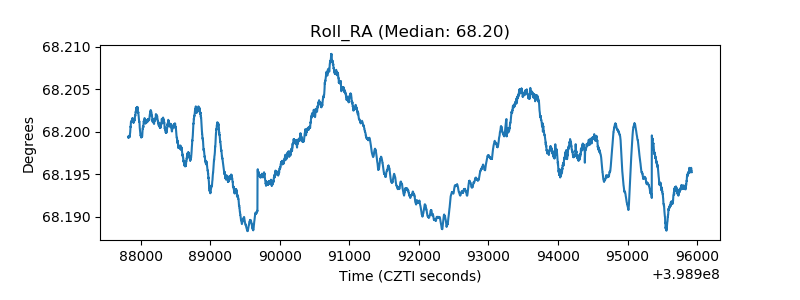 |
| Veto Counter | 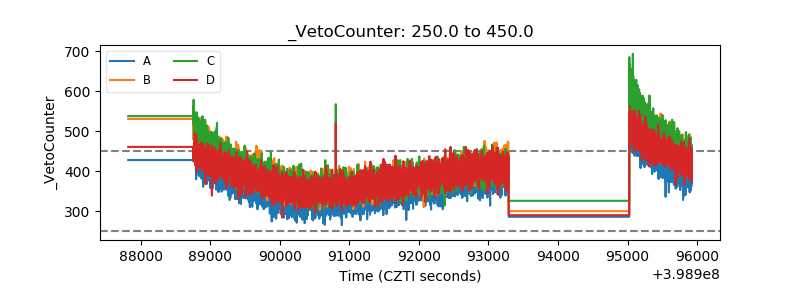 |