| Param | Original file | Final file |
|---|---|---|
| Filename | modeM0/AS1A11_030T02_9000005310_37330cztM0_level2.evt | modeM0/AS1A11_030T02_9000005310_37330cztM0_level2_quad_clean.evt |
| Size (bytes) | 677,491,200 | 76,331,520 |
| Size | 646.1 MB | 72.8 MB |
| Events in quadrant A | 2,920,303 | 528,888 |
| Events in quadrant B | 2,801,743 | 546,111 |
| Events in quadrant C | 4,606,821 | 522,341 |
| Events in quadrant D | 9,832,833 | 343,561 |
| Mode M0 | |||
|---|---|---|---|
| Quadrant | BADHDUFLAG | Total packets | Discarded packets |
| A | 0 | 11995 | 3 |
| B | 0 | 11775 | 2 |
| C | 0 | 17151 | 2 |
| D | 0 | 32802 | 2 |
| Mode SS | |||
|---|---|---|---|
| Quadrant | BADHDUFLAG | Total packets | Discarded packets |
| A | 0 | 108 | 0 |
| B | 0 | 108 | 0 |
| C | 0 | 108 | 0 |
| D | 0 | 108 | 0 |
| Mode M9 | |||
|---|---|---|---|
| Quadrant | BADHDUFLAG | Total packets | Discarded packets |
| A | 0 | 27 | 0 |
| B | 0 | 27 | 0 |
| C | 0 | 27 | 0 |
| D | 0 | 28 | 0 |
| Quadrant | Total seconds | Saturated seconds | Saturation percentage |
|---|---|---|---|
| A | 5274 | 48 | 0.910125% |
| B | 5274 | 78 | 1.478953% |
| C | 5274 | 343 | 6.503603% |
| D | 5274 | 2580 | 48.919226% |
Noise dominated data is calculated using 1-second bins in cleaned event files. If a bin has >2000 counts, and if more than 50% of those come from <1% of pixels, then it is considered to be noise-dominated and hence unusable.
| Quadrant | # 1 sec bins | Bins with >0 counts | Bins with >2000 counts | High rate bins dominated by noise | Noise dominated (total time) | Noise dominated (detector-on time) | Marked lightcurve |
|---|---|---|---|---|---|---|---|
| A | 7126 | 5275 | 27 | 27 | 0.38% | 0.51% | 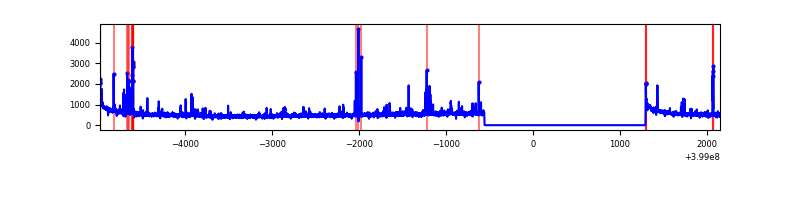 |
| B | 7126 | 5275 | 49 | 49 | 0.69% | 0.93% | 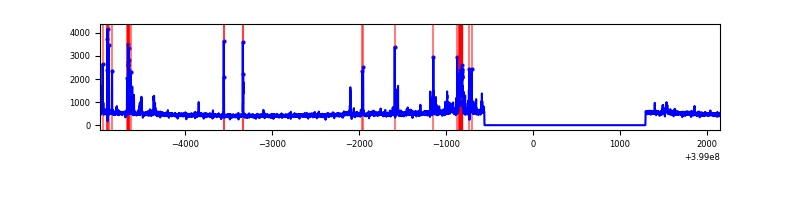 |
| C | 7126 | 5275 | 341 | 341 | 4.79% | 6.46% | 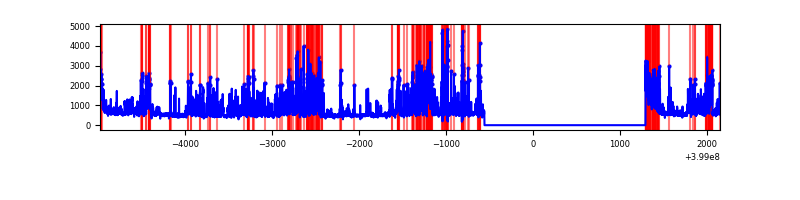 |
| D | 7126 | 5275 | 2596 | 2596 | 36.43% | 49.21% | 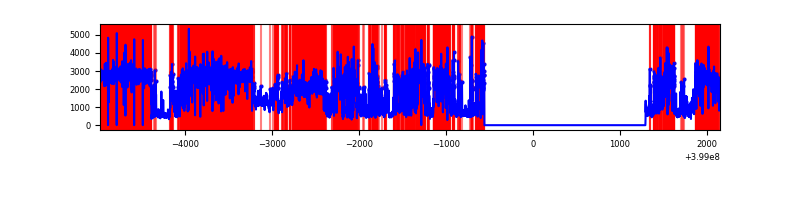 |
Top three noisy pixels from each quadrant. If the there are fewer than three noisy pixels in the level2.evt file, extra rows are filled as -1
| Pixel properties | Quadrant properties | ||||||
|---|---|---|---|---|---|---|---|
| Quadrant | DetID | PixID | Counts | Sigma | Mean | Median | Sigma |
| A | 10 | 83 | 271543 | 2167.24 | 618 | 607 | 125.0 |
| A | 9 | 143 | 99979 | 794.88 | 618 | 607 | 125.0 |
| A | 13 | 248 | 82021 | 651.23 | 618 | 607 | 125.0 |
| B | 5 | 172 | 136125 | 1154.43 | 619 | 605 | 117.4 |
| B | 0 | 190 | 100820 | 853.68 | 619 | 605 | 117.4 |
| B | 5 | 184 | 65308 | 551.17 | 619 | 605 | 117.4 |
| C | 1 | 23 | 1788215 | 12743.97 | 602 | 607 | 140.3 |
| C | 15 | 214 | 220182 | 1565.36 | 602 | 607 | 140.3 |
| C | 0 | 10 | 123195 | 873.94 | 602 | 607 | 140.3 |
| D | 12 | 227 | 6539833 | 57745.58 | 465 | 454 | 113.2 |
| D | 10 | 253 | 864486 | 7629.78 | 465 | 454 | 113.2 |
| D | 2 | 249 | 234402 | 2065.86 | 465 | 454 | 113.2 |
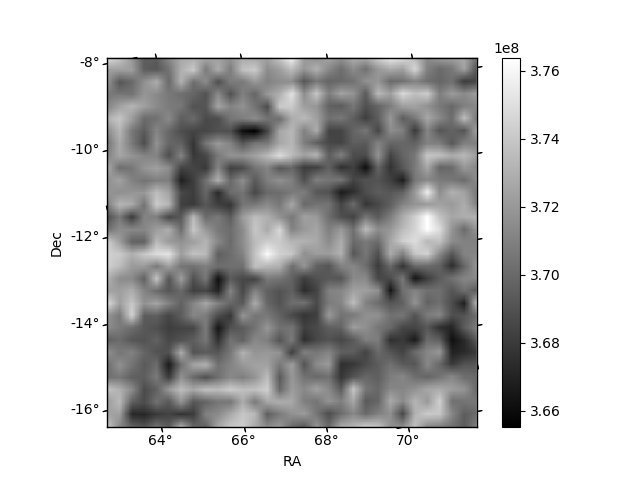
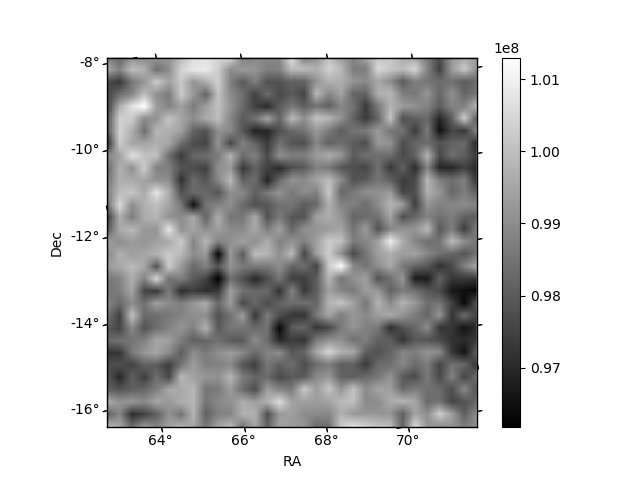
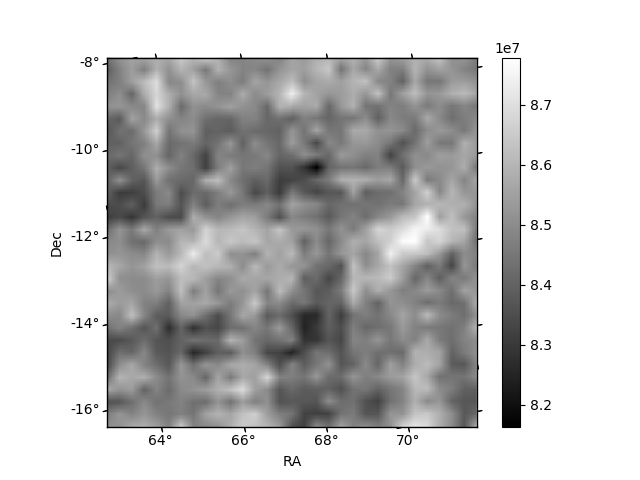
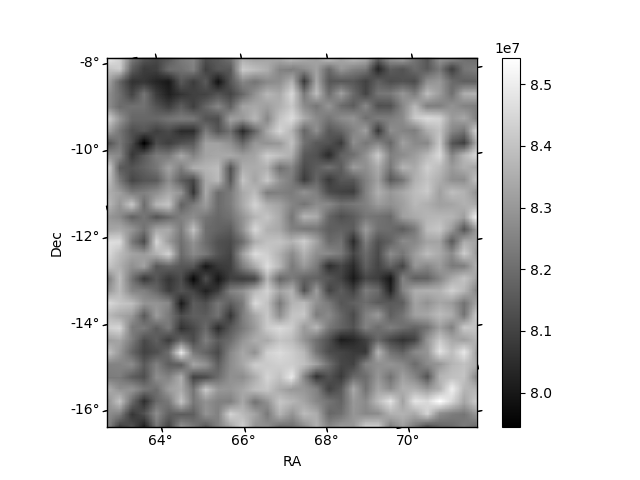
Histogram calculated using DETX and DETY for each event in the final _common_clean file
| Quadrant A | 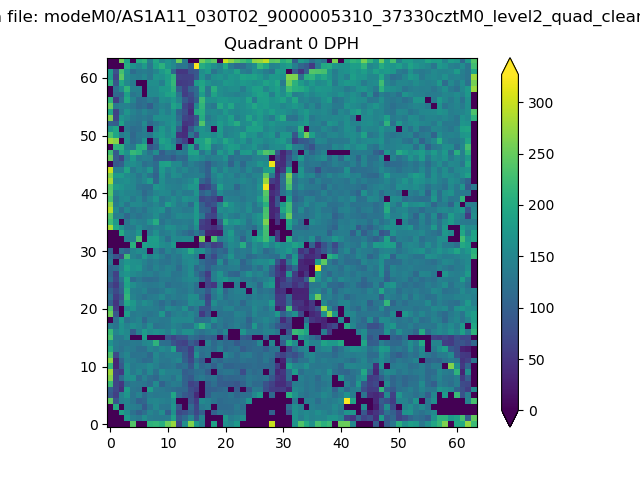 |
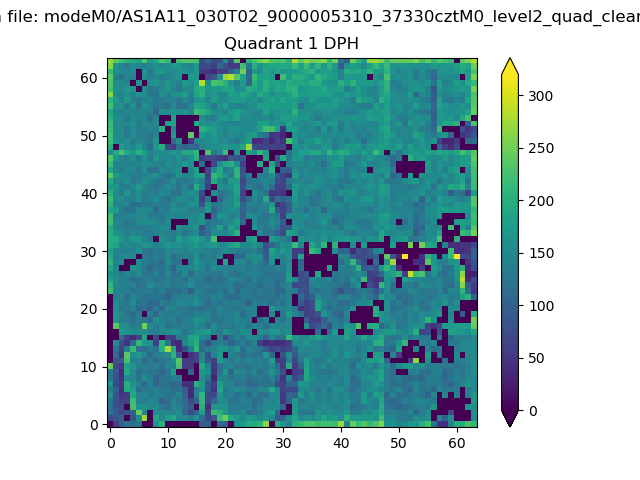 |
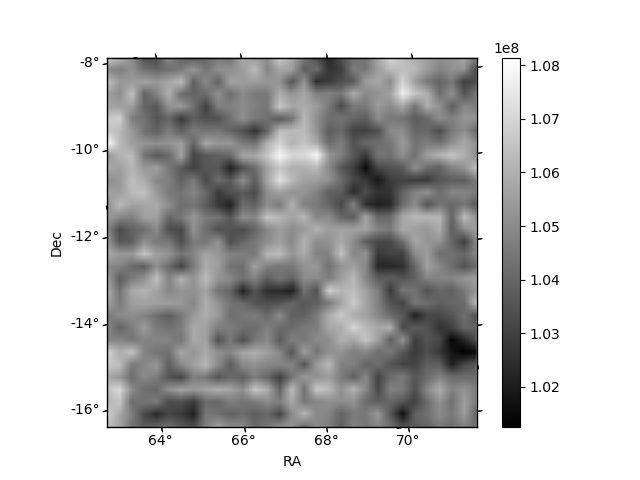
Quadrant B |
|---|---|---|---|
| Quadrant D | 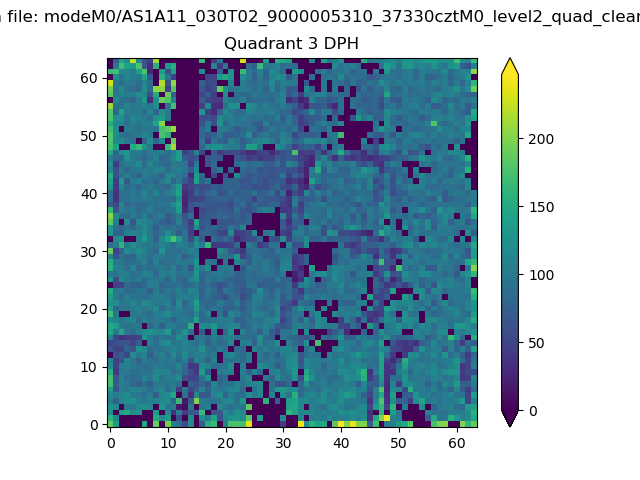 |
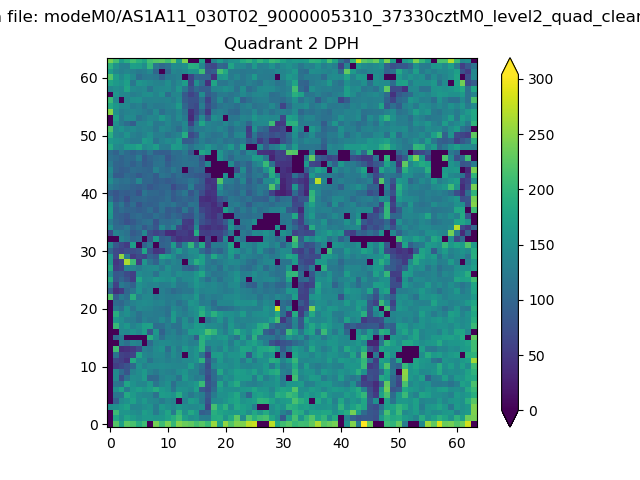 |
Quadrant C |
| Plot type | Count rate plots | Images |
|---|---|---|
| Comparison with Poisson distribution Blue bars denote a histogram of data divided into 1 sec bins. Red curve is a Poisson curve with rate = median count rate of data. |
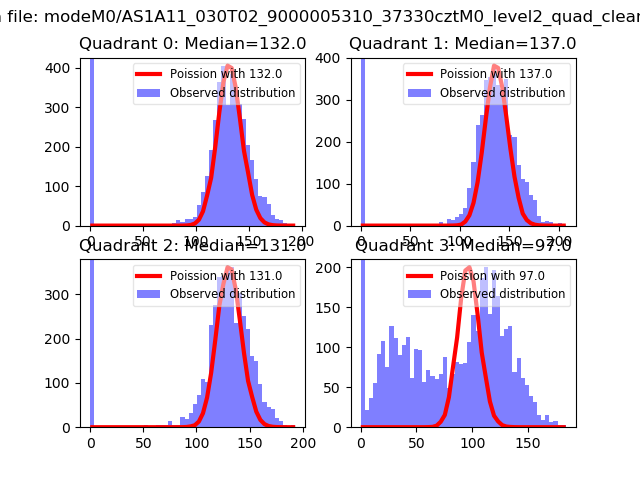 |
 |
| Quadrant-wise count rates Data is divided into 100 sec bins |
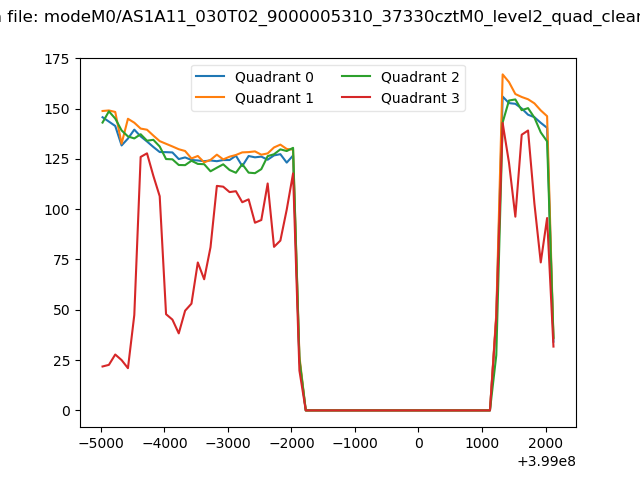 |
|
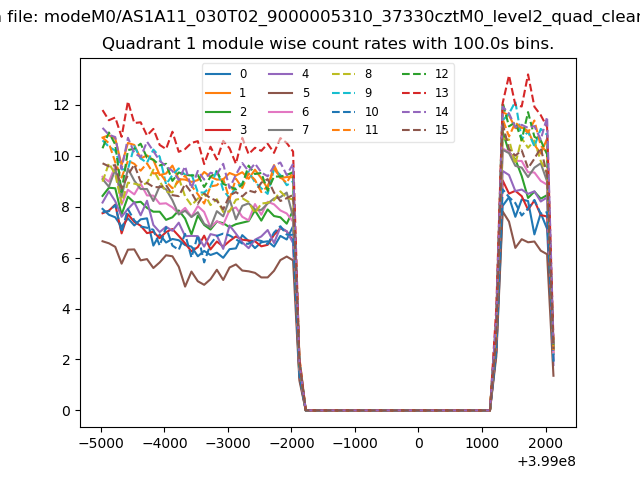
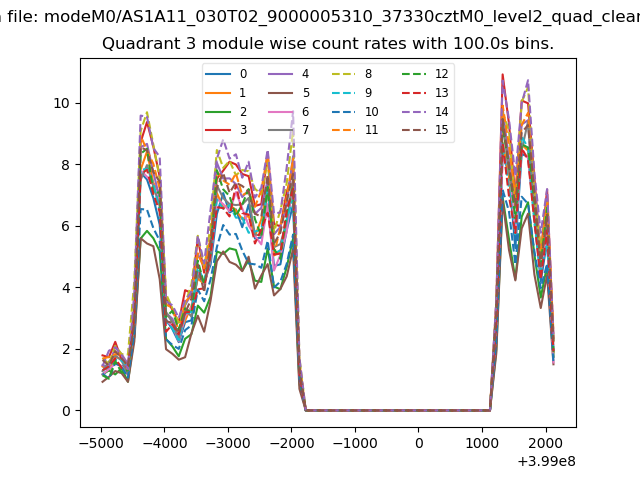
| Module-wise count rates for Quadrant A Data is divided into 100 sec bins |
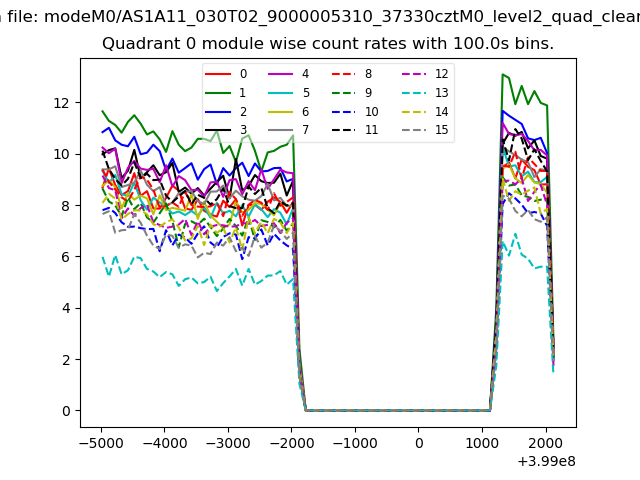 |
 |
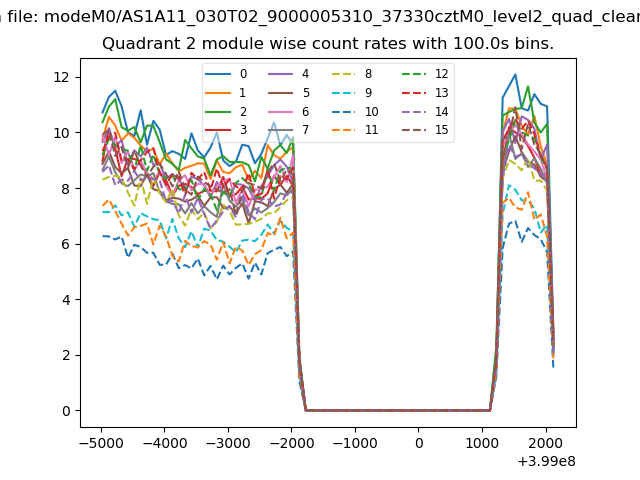
| Module-wise count rates for Quadrant B Data is divided into 100 sec bins |
 |
 |
| Module-wise count rates for Quadrant C Data is divided into 100 sec bins |
 |
 |
| Module-wise count rates for Quadrant D Data is divided into 100 sec bins |
 |
 |
| Parameter | Plot |
|---|---|
| CZT HV Monitor | 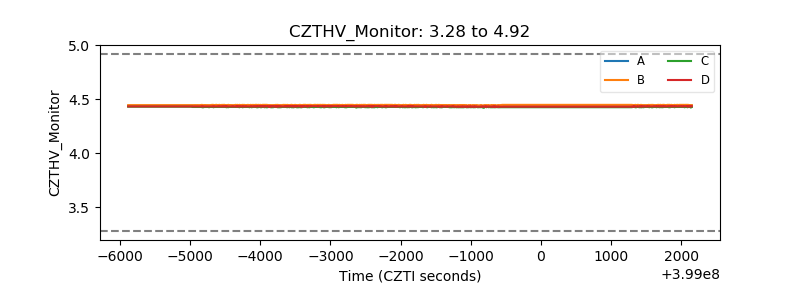 |
| D_VDD | 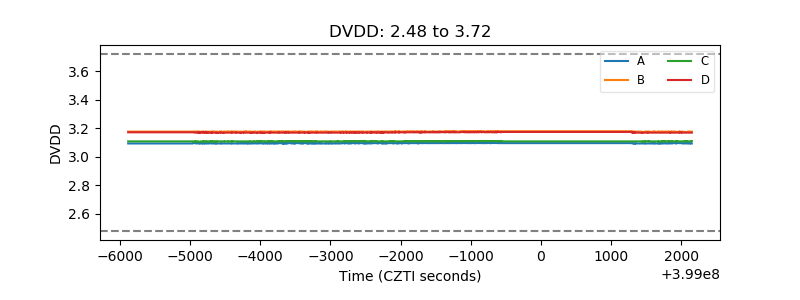 |
| Temperature 1 | 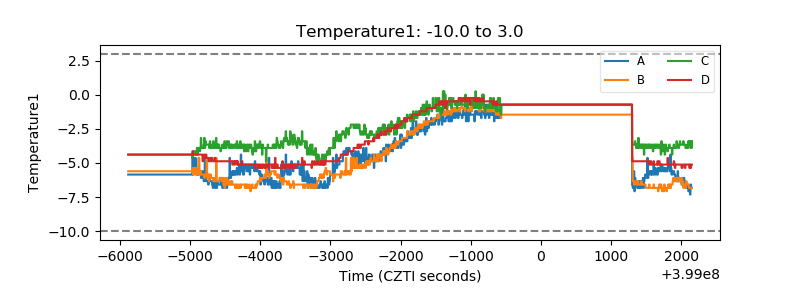 |
| Veto HV Monitor | 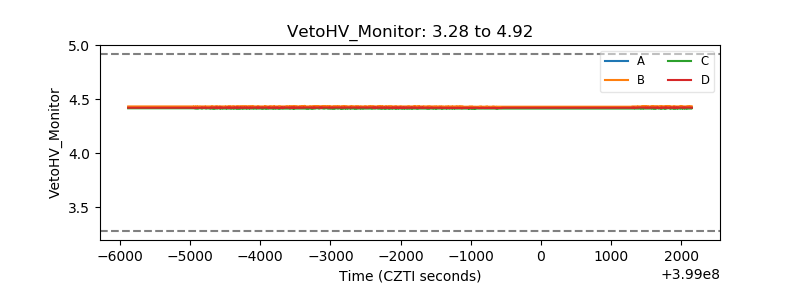 |
| Veto LLD | 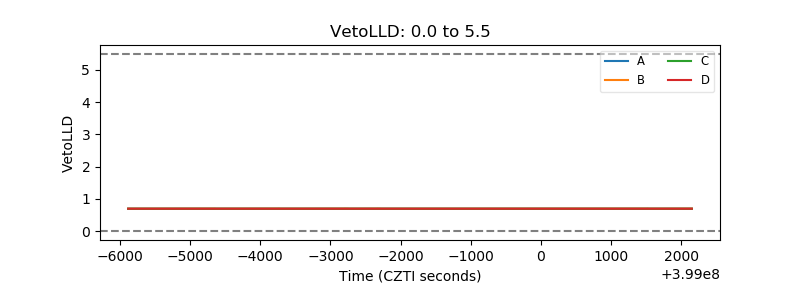 |
| Alpha Counter | 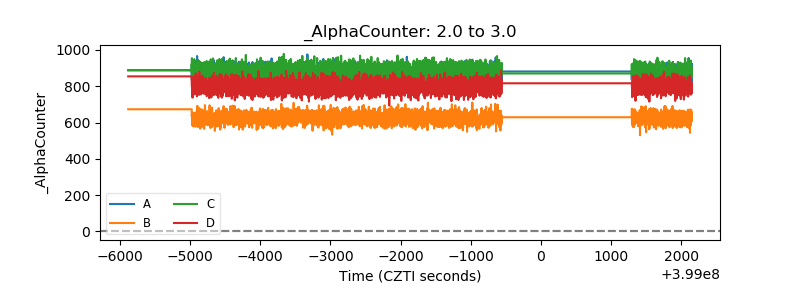 |
| _CPM_Rate | 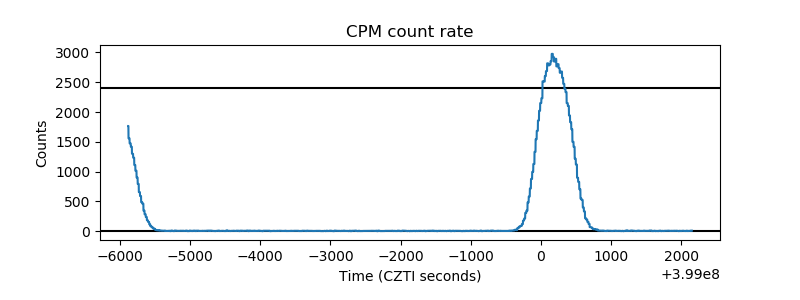 |
| CZT Counter | 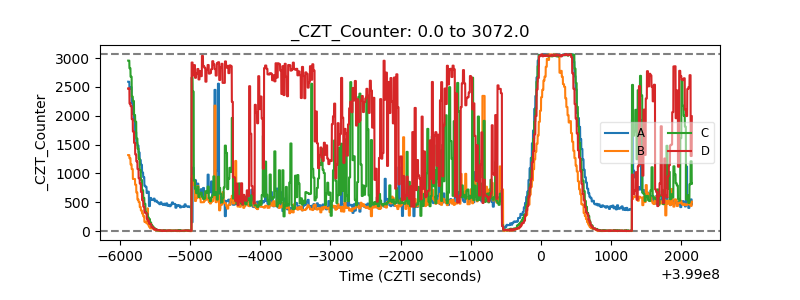 |
| +2.5 Volts monitor | 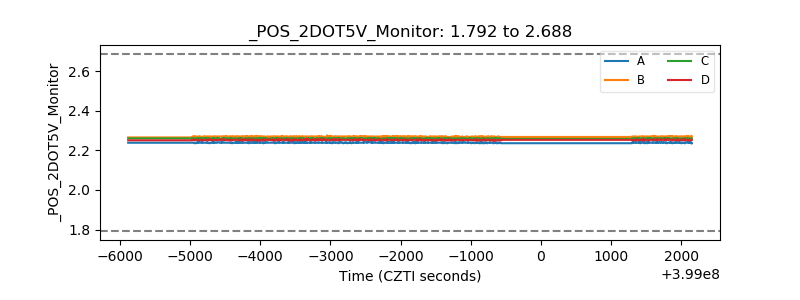 |
| +5 Volts monitor | 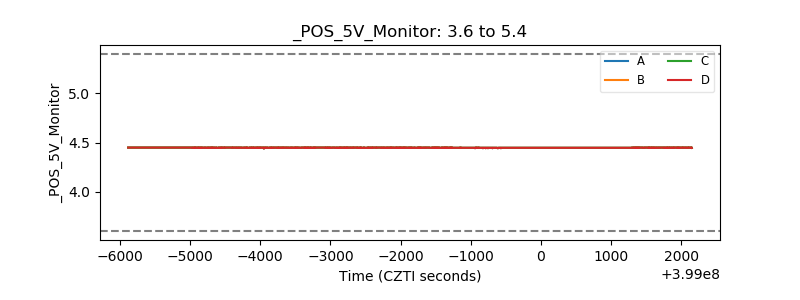 |
| _ROLL_ROT | 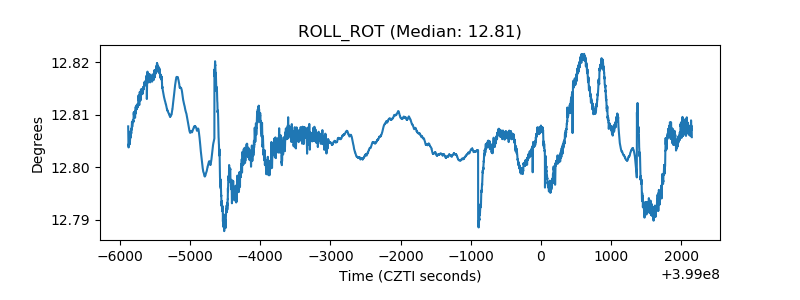 |
| _Roll_DEC | 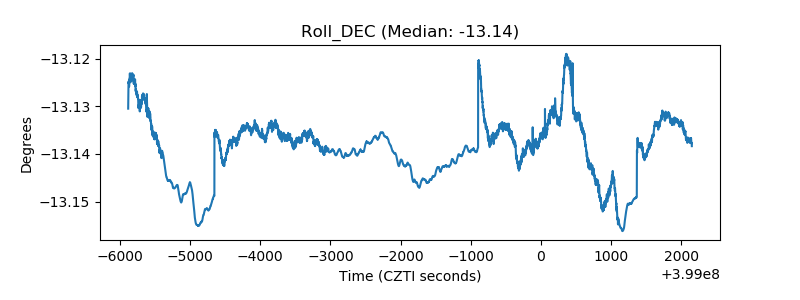 |
| _Roll_RA | 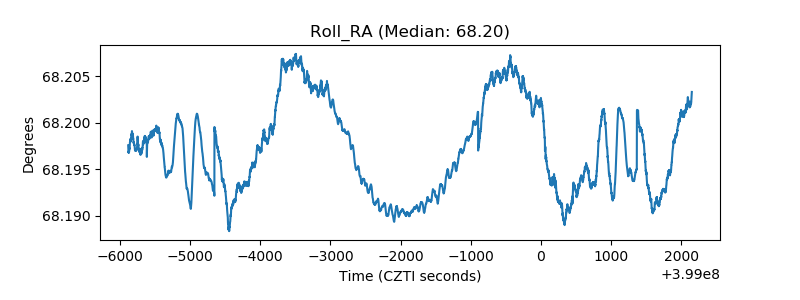 |
| Veto Counter | 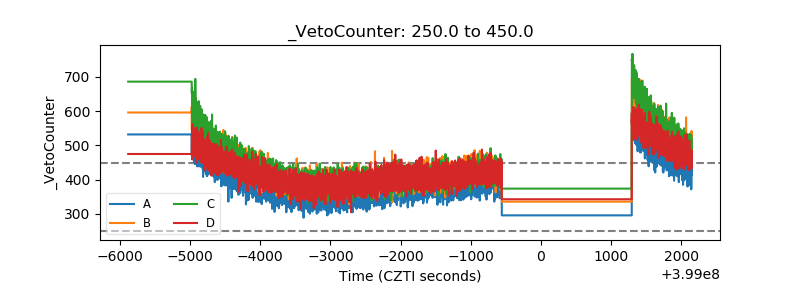 |