| Param | Original file | Final file |
|---|---|---|
| Filename | modeM0/AS1A11_030T02_9000005310_37331cztM0_level2.evt | modeM0/AS1A11_030T02_9000005310_37331cztM0_level2_quad_clean.evt |
| Size (bytes) | 545,149,440 | 72,616,320 |
| Size | 519.9 MB | 69.3 MB |
| Events in quadrant A | 2,843,626 | 478,223 |
| Events in quadrant B | 2,687,252 | 496,756 |
| Events in quadrant C | 3,891,750 | 472,483 |
| Events in quadrant D | 6,749,005 | 400,639 |
| Mode M0 | |||
|---|---|---|---|
| Quadrant | BADHDUFLAG | Total packets | Discarded packets |
| A | 0 | 11488 | 3 |
| B | 0 | 11104 | 2 |
| C | 0 | 14690 | 2 |
| D | 0 | 23472 | 2 |
| Mode SS | |||
|---|---|---|---|
| Quadrant | BADHDUFLAG | Total packets | Discarded packets |
| A | 0 | 102 | 0 |
| B | 0 | 102 | 0 |
| C | 0 | 102 | 0 |
| D | 0 | 102 | 0 |
| Mode M9 | |||
|---|---|---|---|
| Quadrant | BADHDUFLAG | Total packets | Discarded packets |
| A | 0 | 28 | 0 |
| B | 0 | 28 | 0 |
| C | 0 | 28 | 0 |
| D | 0 | 29 | 0 |
| Quadrant | Total seconds | Saturated seconds | Saturation percentage |
|---|---|---|---|
| A | 4997 | 42 | 0.840504% |
| B | 4997 | 57 | 1.140684% |
| C | 4997 | 254 | 5.083050% |
| D | 4997 | 1302 | 26.055633% |
Noise dominated data is calculated using 1-second bins in cleaned event files. If a bin has >2000 counts, and if more than 50% of those come from <1% of pixels, then it is considered to be noise-dominated and hence unusable.
| Quadrant | # 1 sec bins | Bins with >0 counts | Bins with >2000 counts | High rate bins dominated by noise | Noise dominated (total time) | Noise dominated (detector-on time) | Marked lightcurve |
|---|---|---|---|---|---|---|---|
| A | 6969 | 4998 | 28 | 28 | 0.40% | 0.56% | 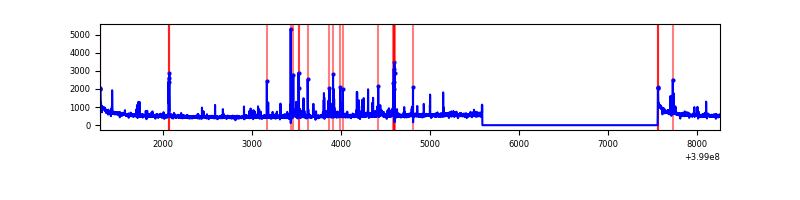 |
| B | 6969 | 4998 | 26 | 26 | 0.37% | 0.52% | 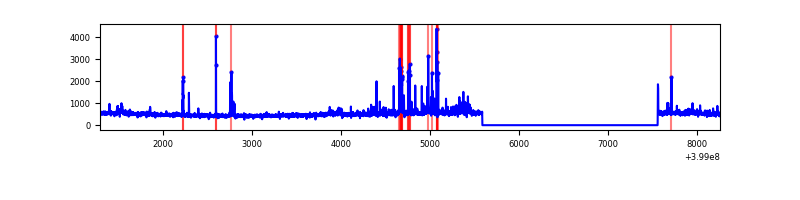 |
| C | 6969 | 4998 | 236 | 236 | 3.39% | 4.72% | 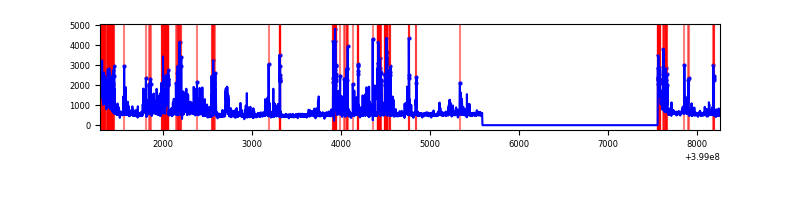 |
| D | 6969 | 4998 | 1282 | 1282 | 18.40% | 25.65% | 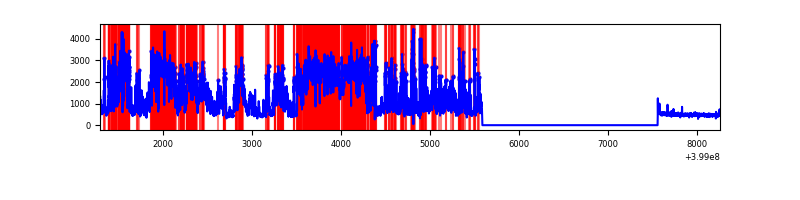 |
Top three noisy pixels from each quadrant. If the there are fewer than three noisy pixels in the level2.evt file, extra rows are filled as -1
| Pixel properties | Quadrant properties | ||||||
|---|---|---|---|---|---|---|---|
| Quadrant | DetID | PixID | Counts | Sigma | Mean | Median | Sigma |
| A | 10 | 83 | 264930 | 2195.59 | 603 | 592 | 120.4 |
| A | 13 | 248 | 128379 | 1061.4 | 603 | 592 | 120.4 |
| A | 9 | 143 | 90273 | 744.89 | 603 | 592 | 120.4 |
| B | 0 | 190 | 89663 | 779.64 | 604 | 590 | 114.2 |
| B | 5 | 255 | 68537 | 594.73 | 604 | 590 | 114.2 |
| B | 5 | 172 | 53644 | 464.37 | 604 | 590 | 114.2 |
| C | 1 | 23 | 1207453 | 8803.93 | 590 | 596 | 137.1 |
| C | 15 | 214 | 210552 | 1531.61 | 590 | 596 | 137.1 |
| C | 0 | 10 | 143215 | 1040.39 | 590 | 596 | 137.1 |
| D | 12 | 227 | 3640021 | 27571.16 | 544 | 531 | 132.0 |
| D | 13 | 171 | 420626 | 3182.45 | 544 | 531 | 132.0 |
| D | 2 | 249 | 353885 | 2676.85 | 544 | 531 | 132.0 |
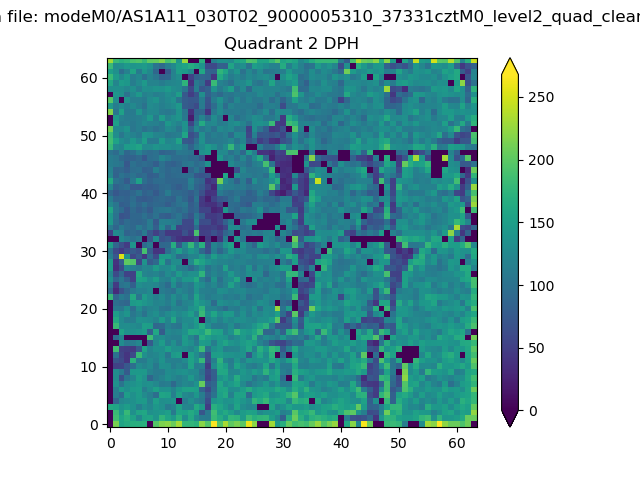
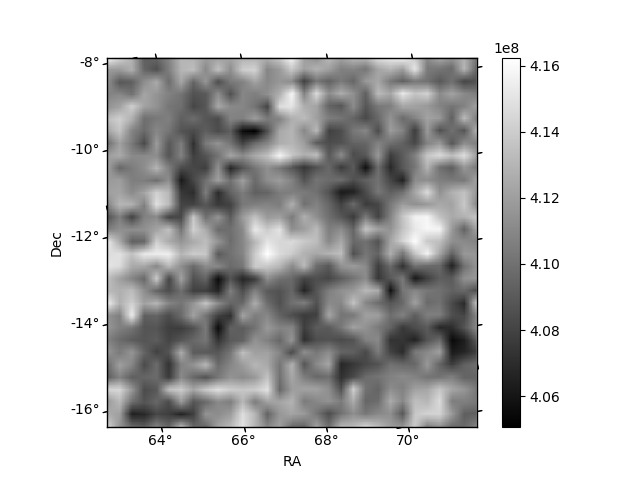
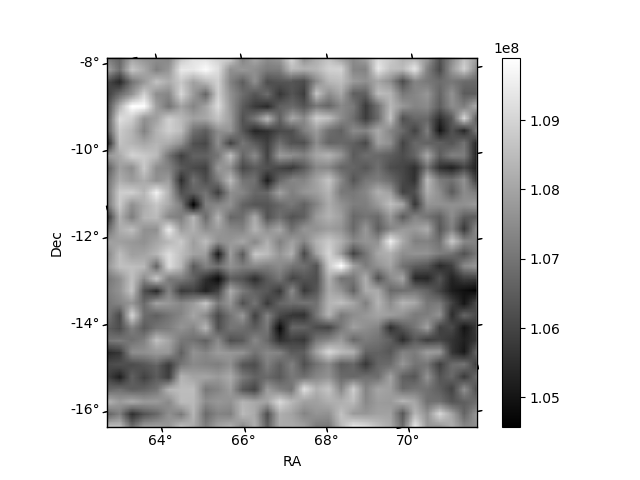
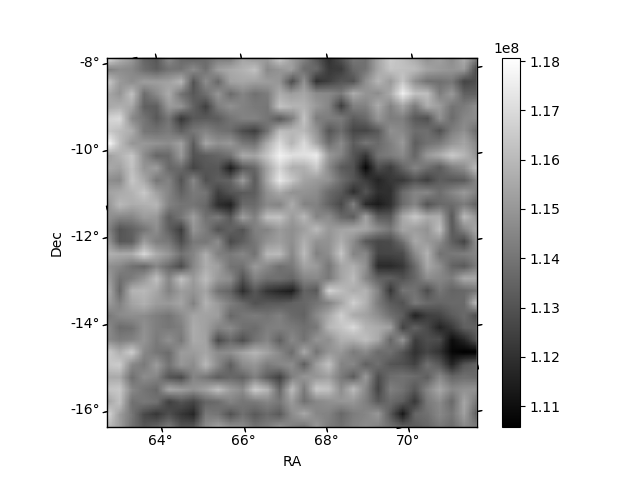
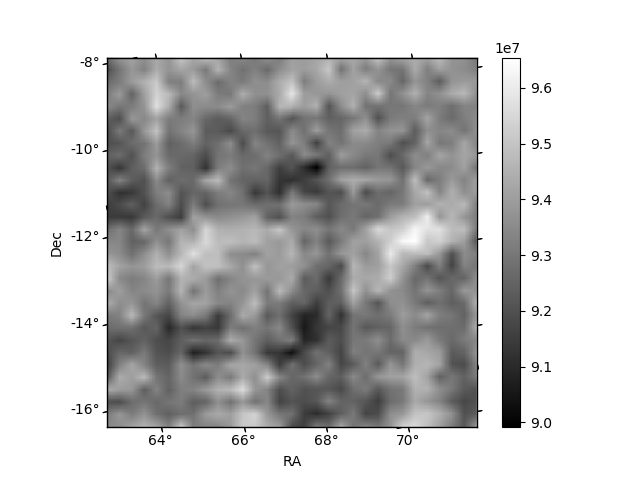
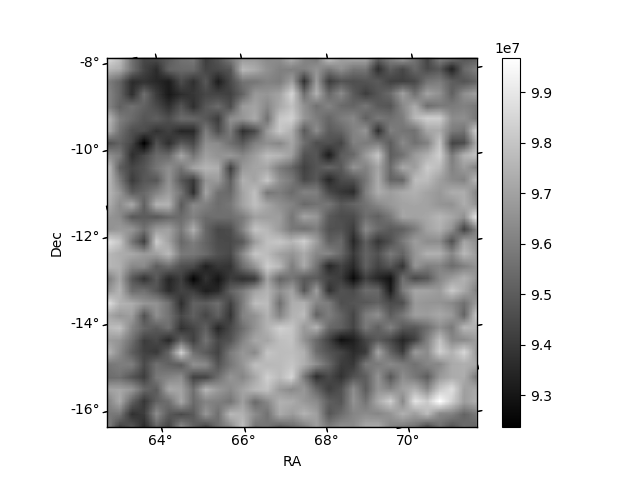
Histogram calculated using DETX and DETY for each event in the final _common_clean file
| Quadrant A | 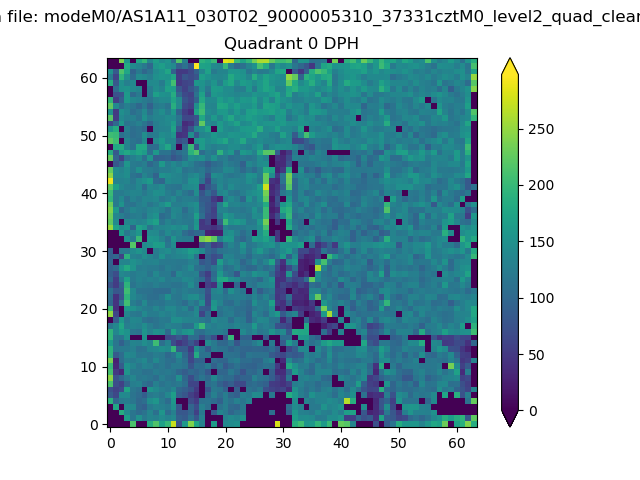 |
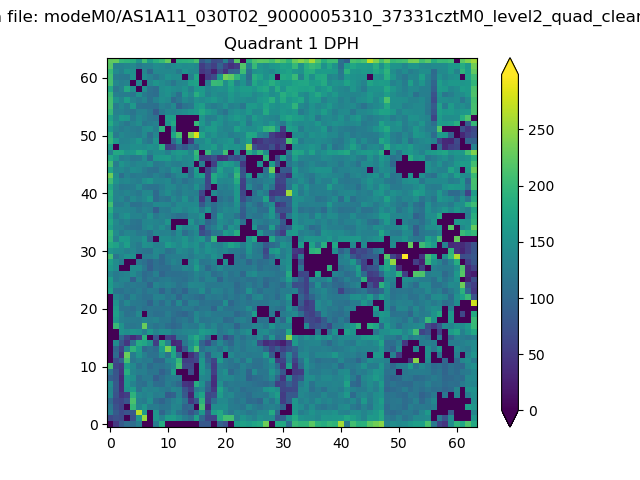 |
Quadrant B |
|---|---|---|---|
| Quadrant D | 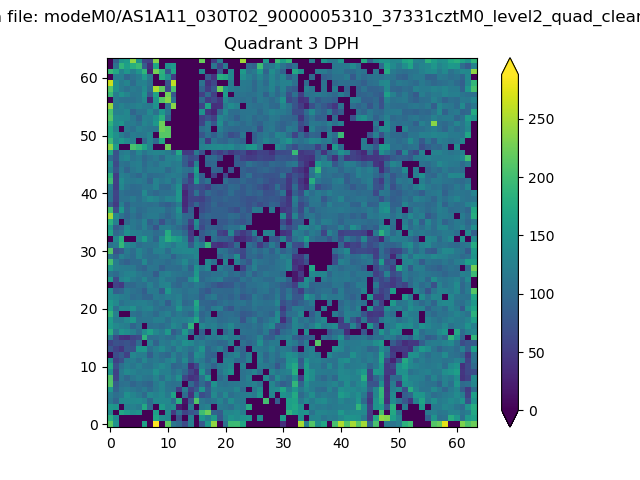 |
 |
Quadrant C |
| Plot type | Count rate plots | Images |
|---|---|---|
| Comparison with Poisson distribution Blue bars denote a histogram of data divided into 1 sec bins. Red curve is a Poisson curve with rate = median count rate of data. |
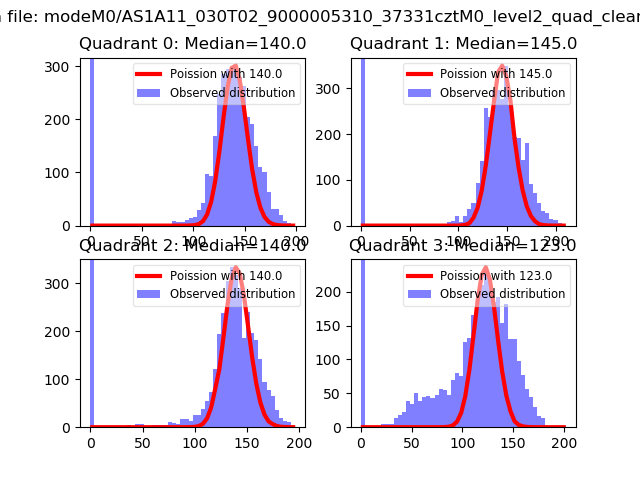 |
 |
| Quadrant-wise count rates Data is divided into 100 sec bins |
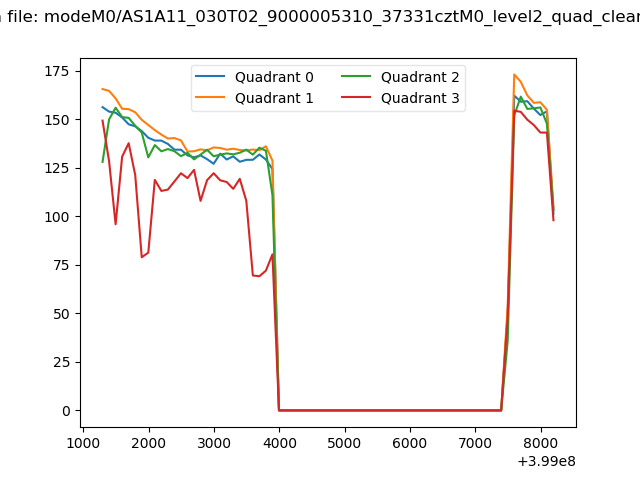 |
|
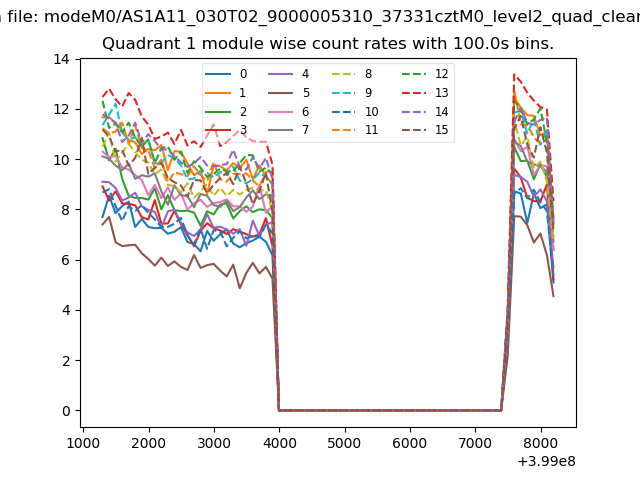
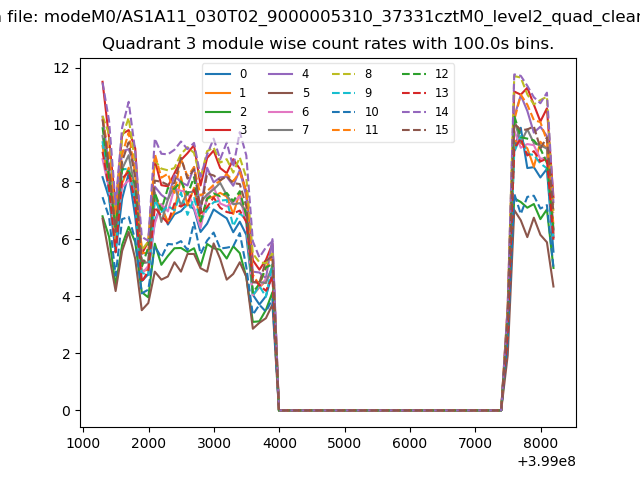
| Module-wise count rates for Quadrant A Data is divided into 100 sec bins |
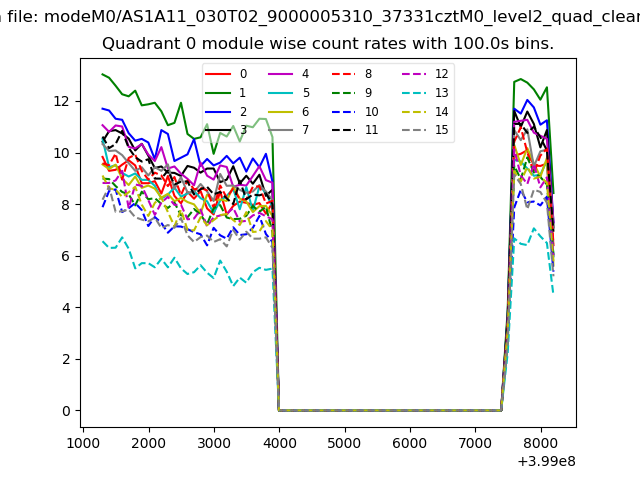 |
 |
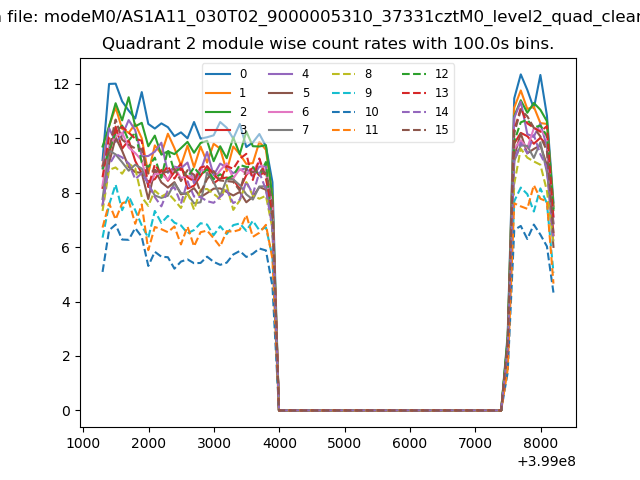
| Module-wise count rates for Quadrant B Data is divided into 100 sec bins |
 |
 |
| Module-wise count rates for Quadrant C Data is divided into 100 sec bins |
 |
 |
| Module-wise count rates for Quadrant D Data is divided into 100 sec bins |
 |
 |
| Parameter | Plot |
|---|---|
| CZT HV Monitor | 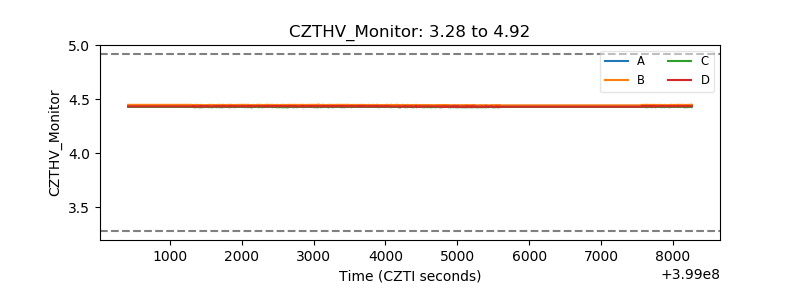 |
| D_VDD | 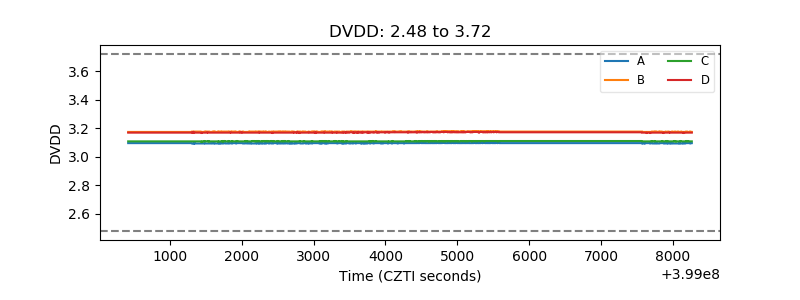 |
| Temperature 1 | 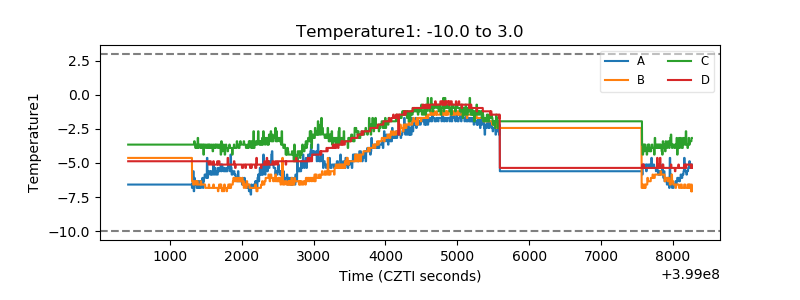 |
| Veto HV Monitor | 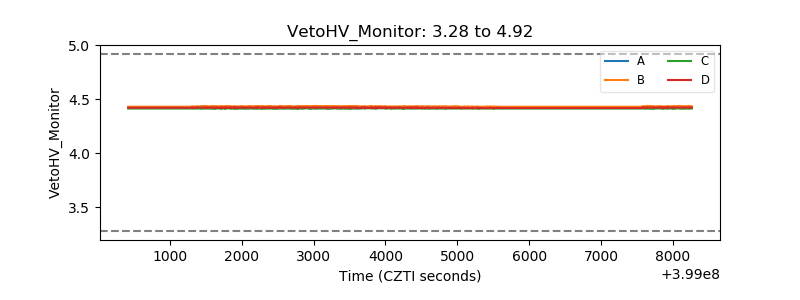 |
| Veto LLD | 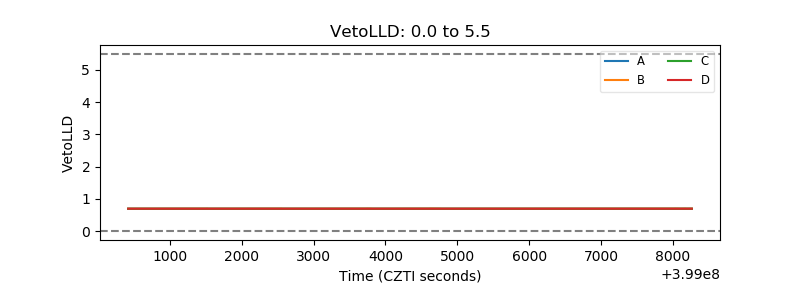 |
| Alpha Counter | 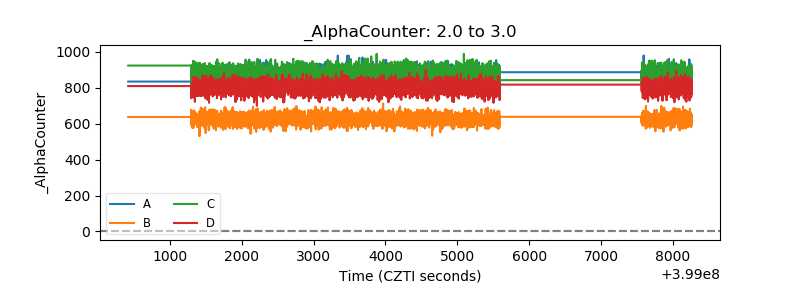 |
| _CPM_Rate | 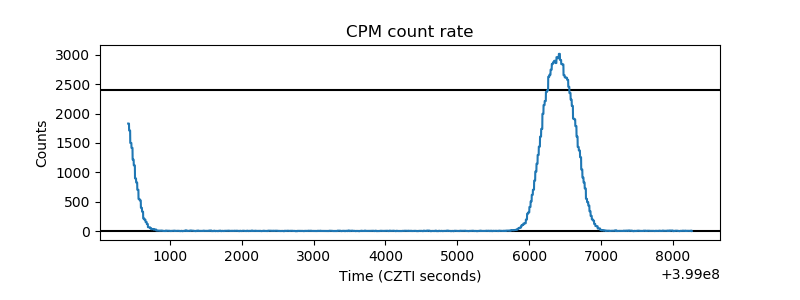 |
| CZT Counter | 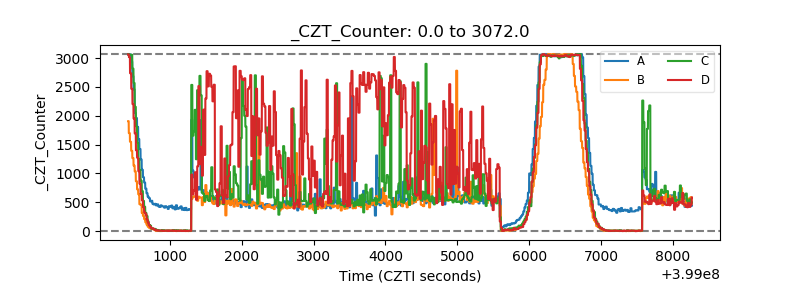 |
| +2.5 Volts monitor | 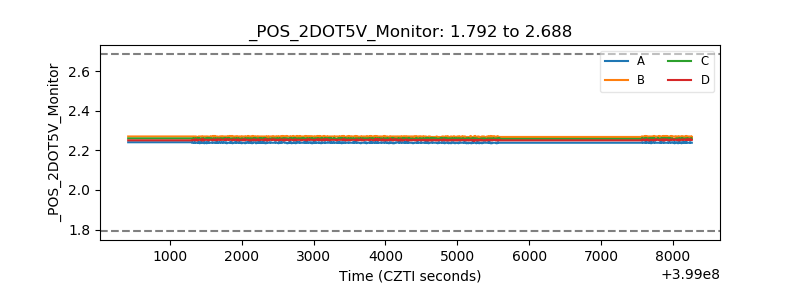 |
| +5 Volts monitor | 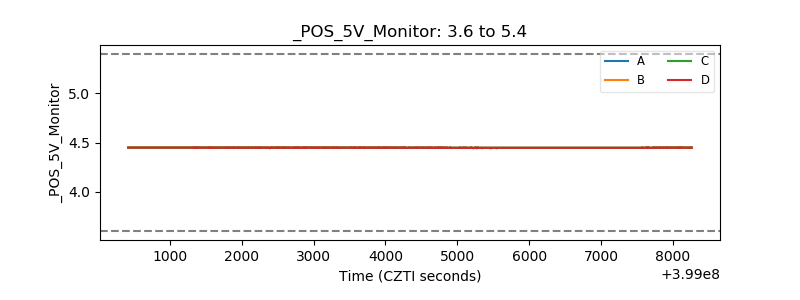 |
| _ROLL_ROT | 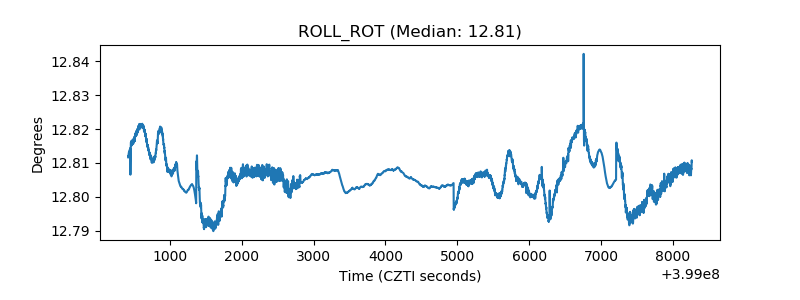 |
| _Roll_DEC | 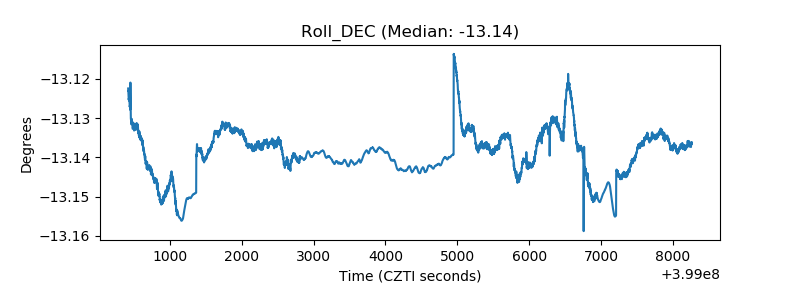 |
| _Roll_RA | 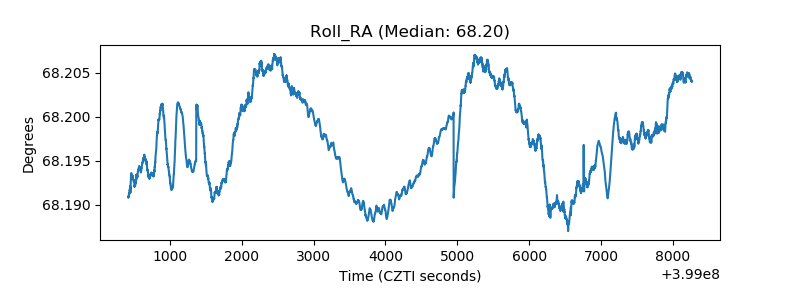 |
| Veto Counter | 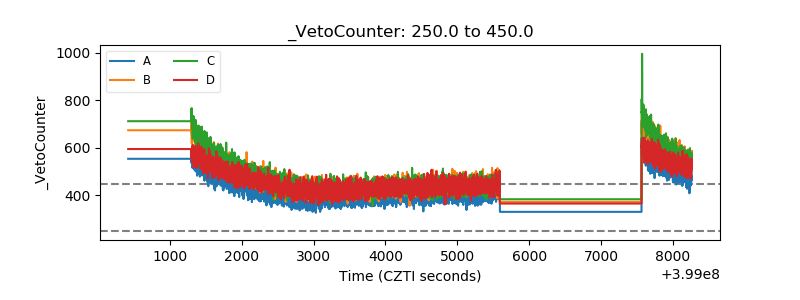 |