| Param | Original file | Final file |
|---|---|---|
| Filename | modeM0/AS1A11_030T02_9000005310_37332cztM0_level2.evt | modeM0/AS1A11_030T02_9000005310_37332cztM0_level2_quad_clean.evt |
| Size (bytes) | 471,948,480 | 76,682,880 |
| Size | 450.1 MB | 73.1 MB |
| Events in quadrant A | 2,911,234 | 498,519 |
| Events in quadrant B | 3,223,339 | 513,807 |
| Events in quadrant C | 3,285,193 | 496,525 |
| Events in quadrant D | 4,511,460 | 439,548 |
| Mode M0 | |||
|---|---|---|---|
| Quadrant | BADHDUFLAG | Total packets | Discarded packets |
| A | 0 | 11759 | 3 |
| B | 0 | 12953 | 2 |
| C | 0 | 12861 | 2 |
| D | 0 | 16889 | 2 |
| Mode SS | |||
|---|---|---|---|
| Quadrant | BADHDUFLAG | Total packets | Discarded packets |
| A | 0 | 108 | 0 |
| B | 0 | 108 | 0 |
| C | 0 | 108 | 0 |
| D | 0 | 108 | 0 |
| Mode M9 | |||
|---|---|---|---|
| Quadrant | BADHDUFLAG | Total packets | Discarded packets |
| A | 0 | 38 | 0 |
| B | 0 | 38 | 0 |
| C | 0 | 38 | 0 |
| D | 0 | 39 | 0 |
| Quadrant | Total seconds | Saturated seconds | Saturation percentage |
|---|---|---|---|
| A | 5336 | 11 | 0.206147% |
| B | 5336 | 116 | 2.173913% |
| C | 5336 | 87 | 1.630435% |
| D | 5336 | 526 | 9.857571% |
Noise dominated data is calculated using 1-second bins in cleaned event files. If a bin has >2000 counts, and if more than 50% of those come from <1% of pixels, then it is considered to be noise-dominated and hence unusable.
| Quadrant | # 1 sec bins | Bins with >0 counts | Bins with >2000 counts | High rate bins dominated by noise | Noise dominated (total time) | Noise dominated (detector-on time) | Marked lightcurve |
|---|---|---|---|---|---|---|---|
| A | 7429 | 5337 | 6 | 6 | 0.08% | 0.11% | 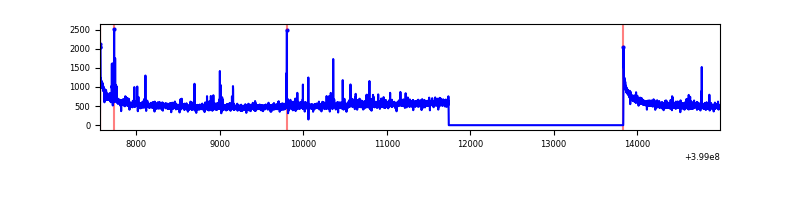 |
| B | 7429 | 5337 | 29 | 29 | 0.39% | 0.54% | 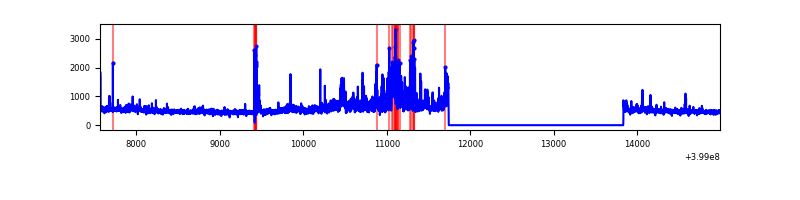 |
| C | 7429 | 5337 | 71 | 71 | 0.96% | 1.33% | 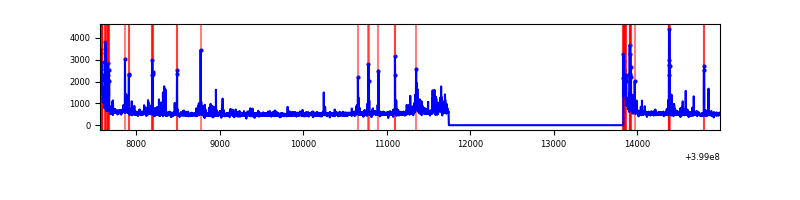 |
| D | 7429 | 5337 | 555 | 555 | 7.47% | 10.40% | 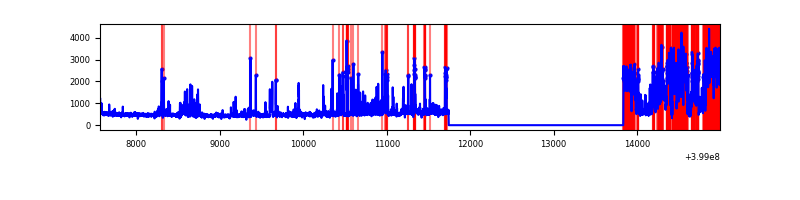 |
Top three noisy pixels from each quadrant. If the there are fewer than three noisy pixels in the level2.evt file, extra rows are filled as -1
| Pixel properties | Quadrant properties | ||||||
|---|---|---|---|---|---|---|---|
| Quadrant | DetID | PixID | Counts | Sigma | Mean | Median | Sigma |
| A | 10 | 83 | 272540 | 2093.92 | 656 | 647 | 129.8 |
| A | 13 | 248 | 49310 | 374.77 | 656 | 647 | 129.8 |
| A | 9 | 143 | 16874 | 124.97 | 656 | 647 | 129.8 |
| B | 0 | 190 | 395300 | 3224.0 | 650 | 636 | 122.4 |
| B | 5 | 255 | 70468 | 570.46 | 650 | 636 | 122.4 |
| B | 12 | 18 | 65887 | 533.03 | 650 | 636 | 122.4 |
| C | 1 | 23 | 273010 | 1830.49 | 641 | 648 | 148.8 |
| C | 15 | 214 | 227267 | 1523.06 | 641 | 648 | 148.8 |
| C | 0 | 10 | 133761 | 894.63 | 641 | 648 | 148.8 |
| D | 10 | 253 | 1020063 | 6797.61 | 622 | 608 | 150.0 |
| D | 12 | 227 | 683584 | 4554.01 | 622 | 608 | 150.0 |
| D | 2 | 249 | 107016 | 709.52 | 622 | 608 | 150.0 |
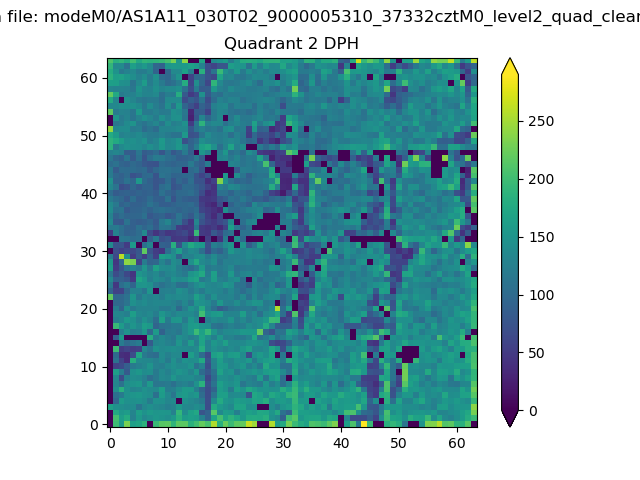
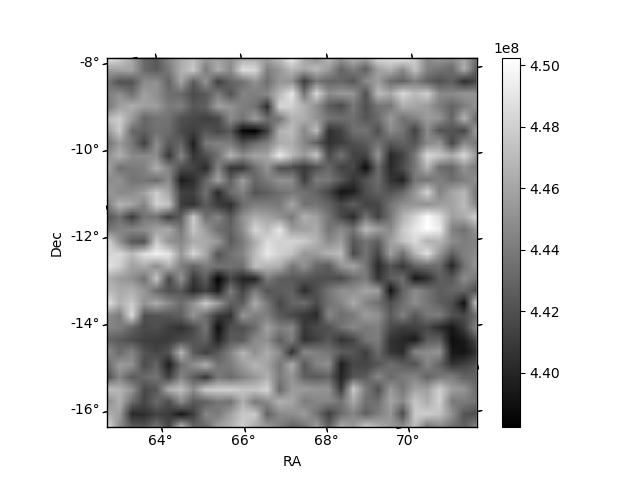
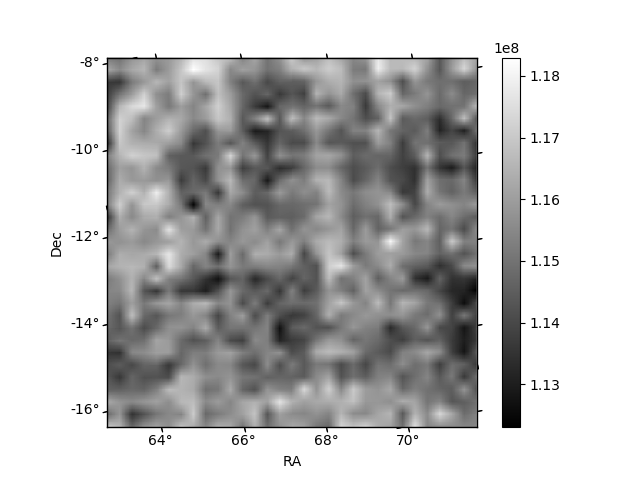
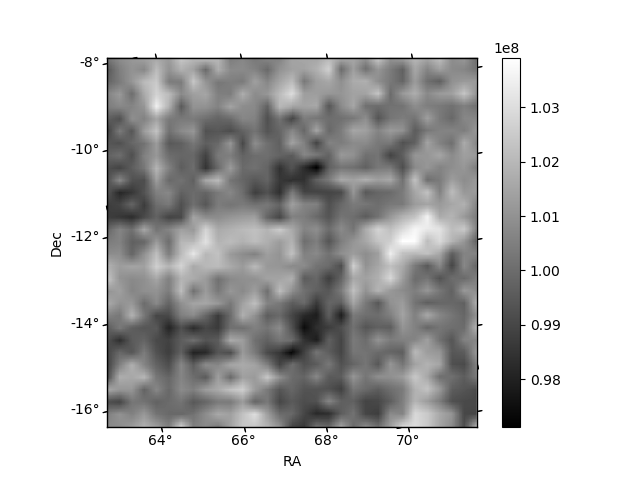
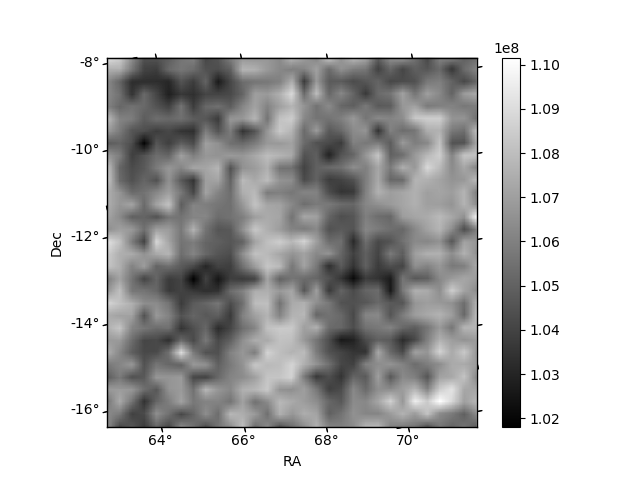
Histogram calculated using DETX and DETY for each event in the final _common_clean file
| Quadrant A | 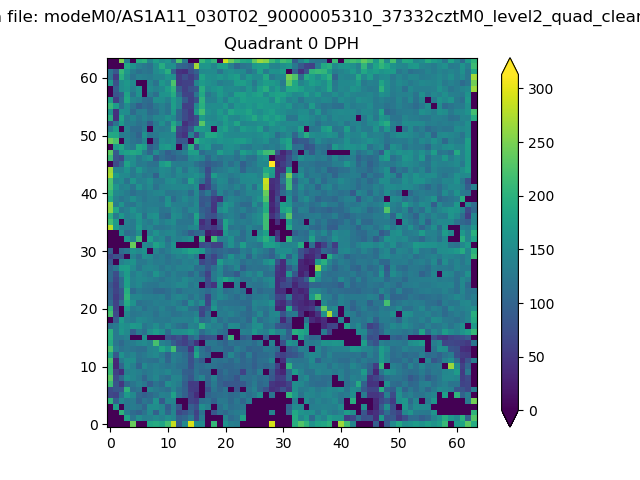 |
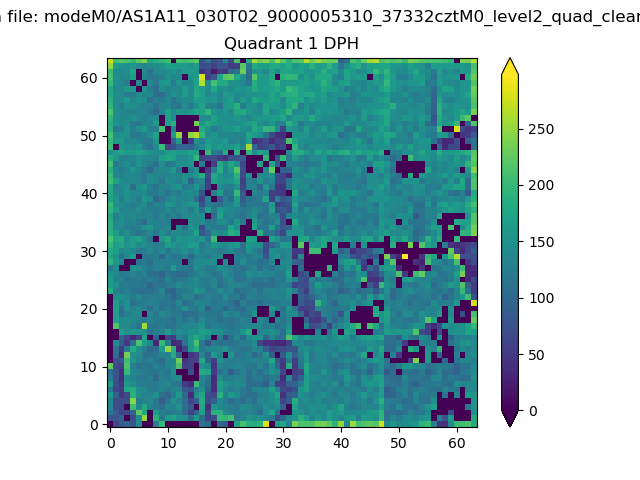 |
Quadrant B |
|---|---|---|---|
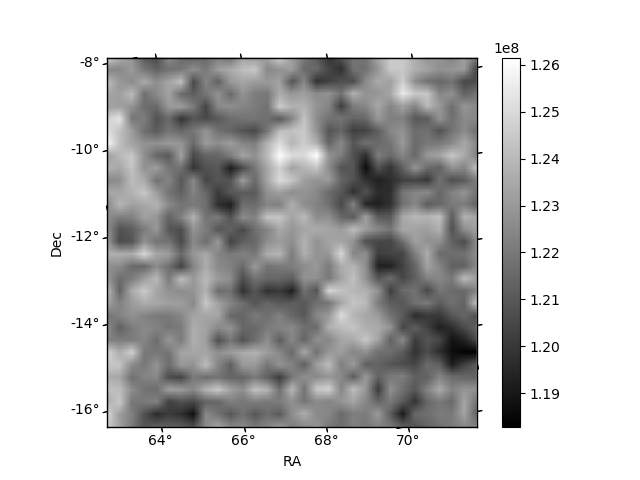
| Quadrant D | 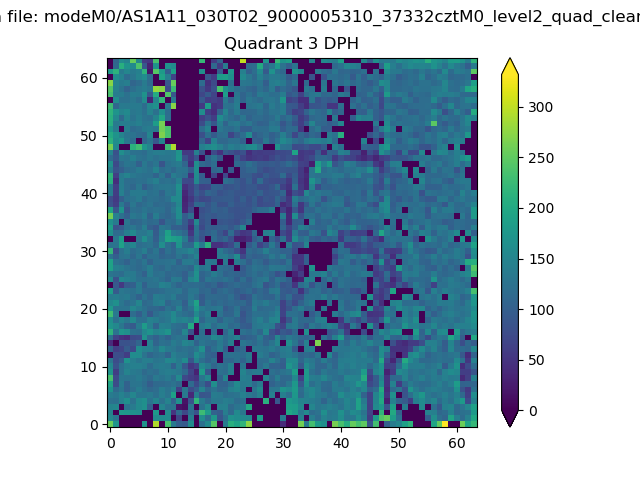 |
 |
Quadrant C |
| Plot type | Count rate plots | Images |
|---|---|---|
| Comparison with Poisson distribution Blue bars denote a histogram of data divided into 1 sec bins. Red curve is a Poisson curve with rate = median count rate of data. |
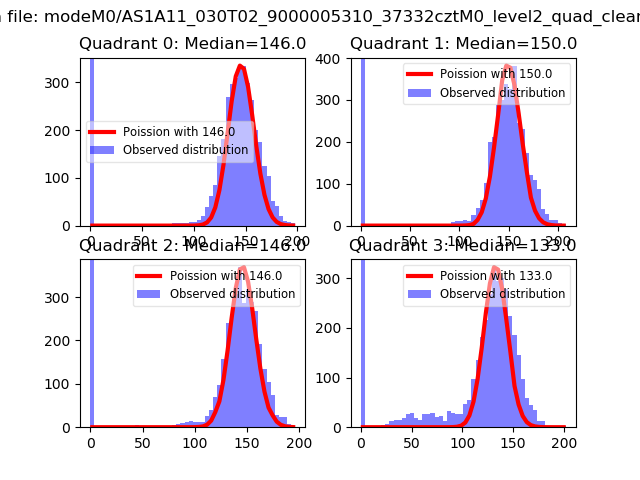 |
 |
| Quadrant-wise count rates Data is divided into 100 sec bins |
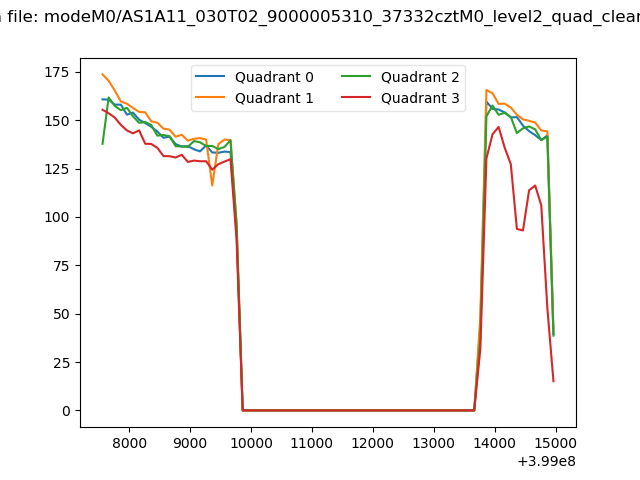 |
|
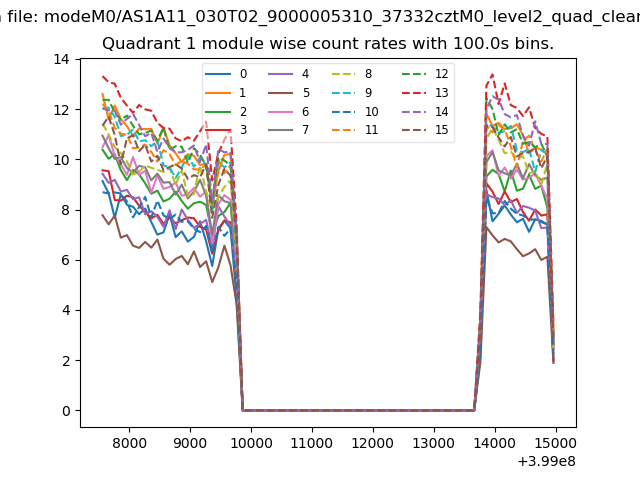
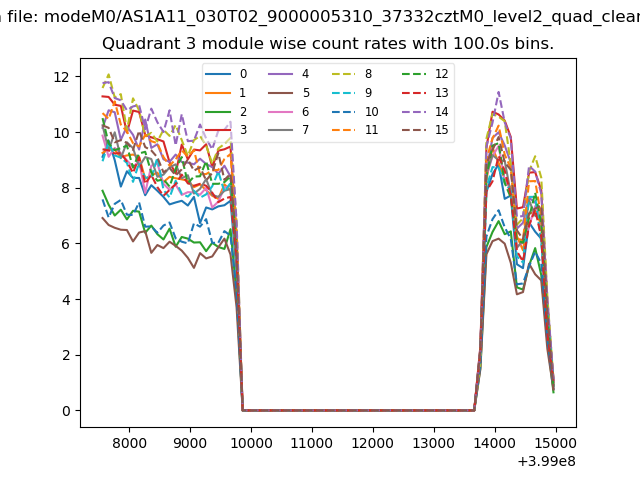
| Module-wise count rates for Quadrant A Data is divided into 100 sec bins |
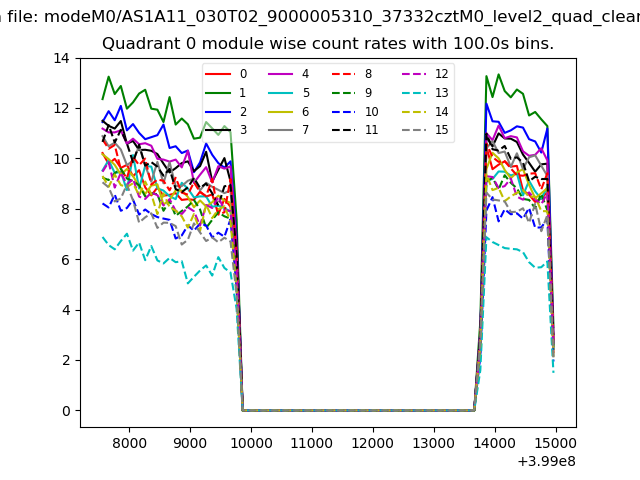 |
 |
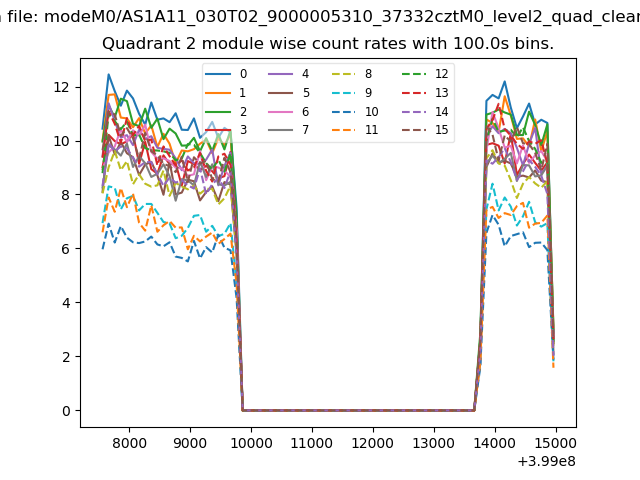
| Module-wise count rates for Quadrant B Data is divided into 100 sec bins |
 |
 |
| Module-wise count rates for Quadrant C Data is divided into 100 sec bins |
 |
 |
| Module-wise count rates for Quadrant D Data is divided into 100 sec bins |
 |
 |
| Parameter | Plot |
|---|---|
| CZT HV Monitor | 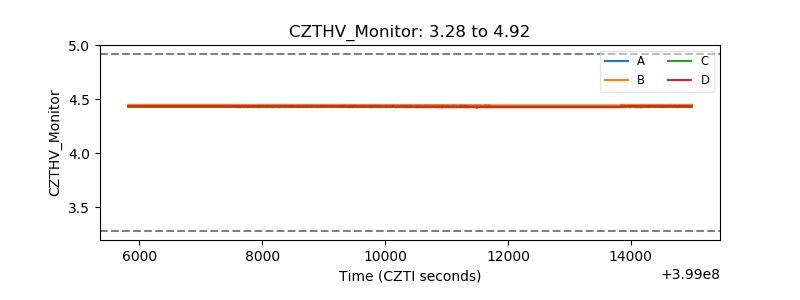 |
| D_VDD | 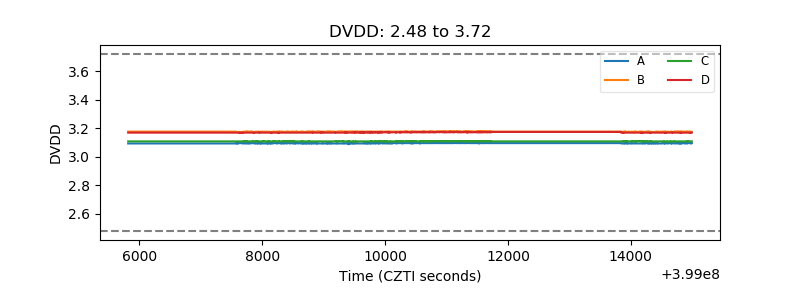 |
| Temperature 1 | 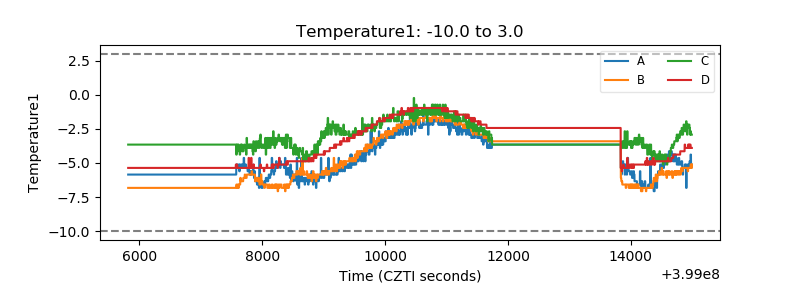 |
| Veto HV Monitor | 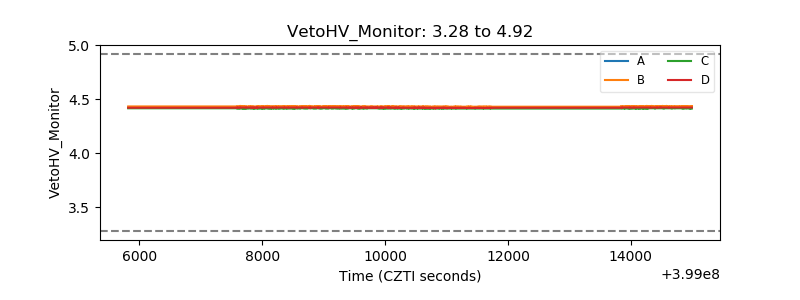 |
| Veto LLD | 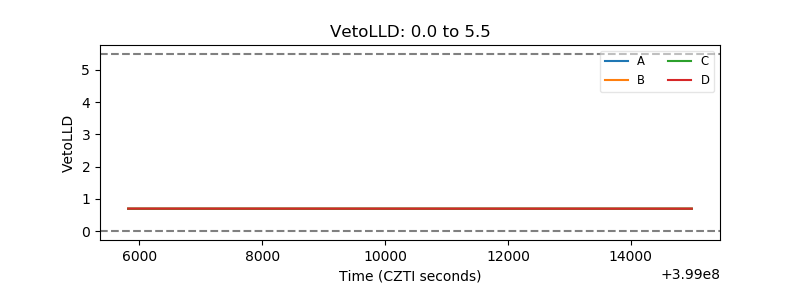 |
| Alpha Counter | 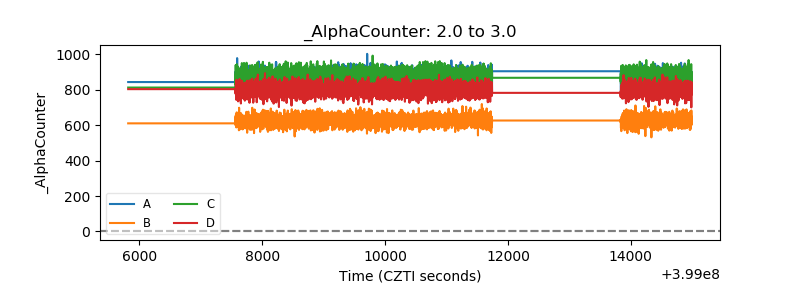 |
| _CPM_Rate | 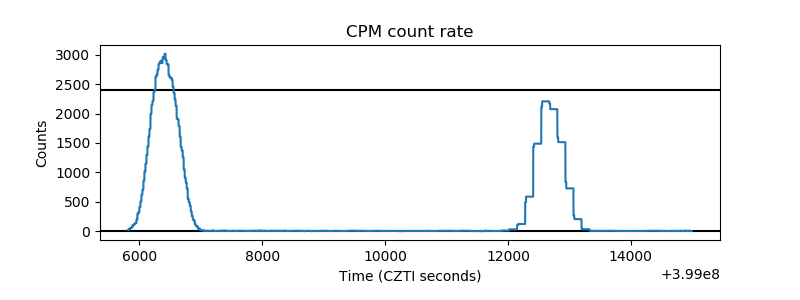 |
| CZT Counter | 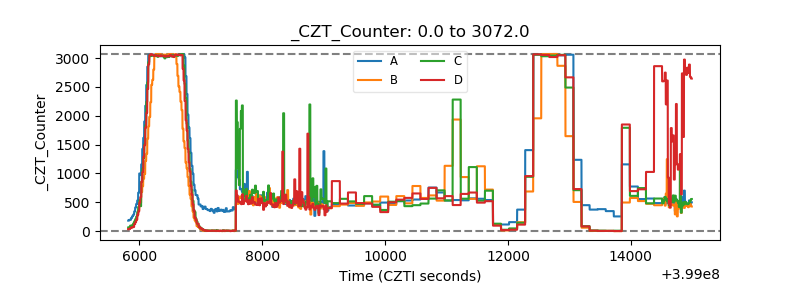 |
| +2.5 Volts monitor | 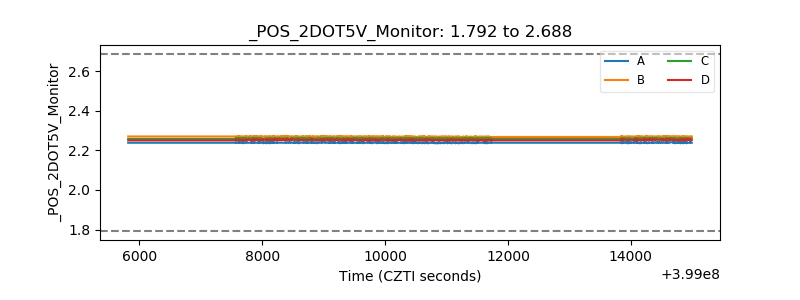 |
| +5 Volts monitor | 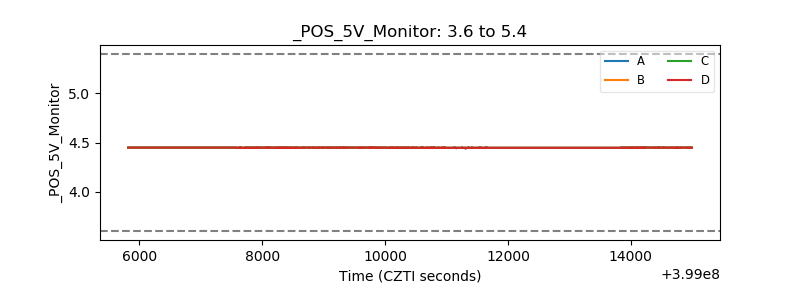 |
| _ROLL_ROT | 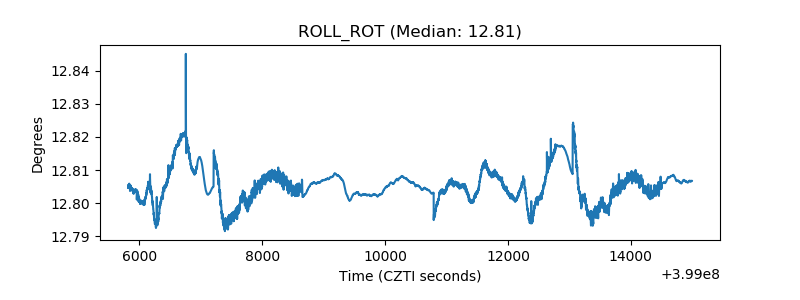 |
| _Roll_DEC | 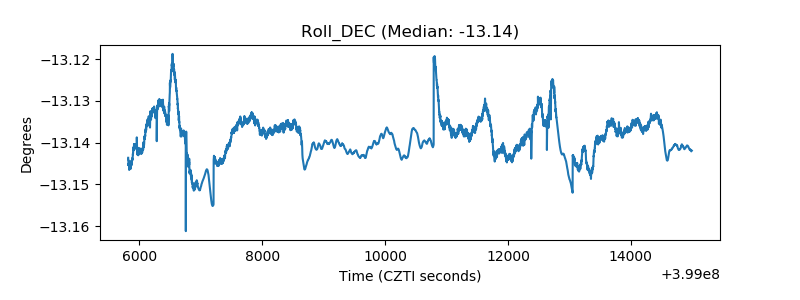 |
| _Roll_RA | 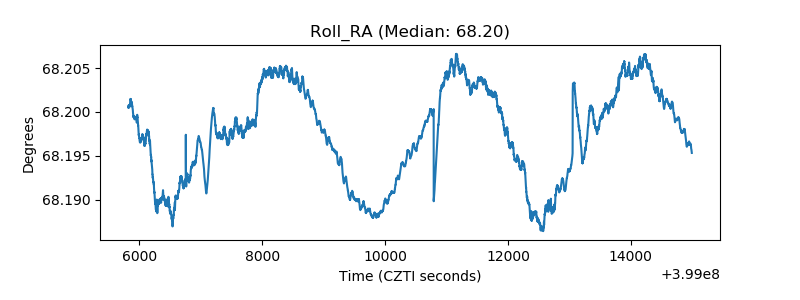 |
| Veto Counter | 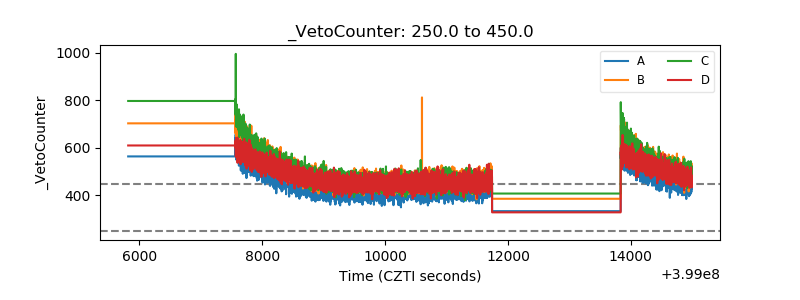 |