| Param | Original file | Final file |
|---|---|---|
| Filename | modeM0/AS1A11_030T02_9000005310_37333cztM0_level2.evt | modeM0/AS1A11_030T02_9000005310_37333cztM0_level2_quad_clean.evt |
| Size (bytes) | 576,368,640 | 67,599,360 |
| Size | 549.7 MB | 64.5 MB |
| Events in quadrant A | 2,961,167 | 435,128 |
| Events in quadrant B | 2,855,668 | 448,920 |
| Events in quadrant C | 3,796,521 | 426,647 |
| Events in quadrant D | 7,481,879 | 363,398 |
| Mode M0 | |||
|---|---|---|---|
| Quadrant | BADHDUFLAG | Total packets | Discarded packets |
| A | 0 | 11810 | 3 |
| B | 0 | 11805 | 2 |
| C | 0 | 14468 | 2 |
| D | 0 | 25703 | 2 |
| Mode SS | |||
|---|---|---|---|
| Quadrant | BADHDUFLAG | Total packets | Discarded packets |
| A | 0 | 108 | 0 |
| B | 0 | 108 | 0 |
| C | 0 | 108 | 0 |
| D | 0 | 108 | 0 |
| Mode M9 | |||
|---|---|---|---|
| Quadrant | BADHDUFLAG | Total packets | Discarded packets |
| A | 0 | 29 | 0 |
| B | 0 | 29 | 0 |
| C | 0 | 29 | 0 |
| D | 0 | 30 | 0 |
| Quadrant | Total seconds | Saturated seconds | Saturation percentage |
|---|---|---|---|
| A | 5321 | 16 | 0.300695% |
| B | 5321 | 26 | 0.488630% |
| C | 5321 | 233 | 4.378876% |
| D | 5321 | 1663 | 31.253524% |
Noise dominated data is calculated using 1-second bins in cleaned event files. If a bin has >2000 counts, and if more than 50% of those come from <1% of pixels, then it is considered to be noise-dominated and hence unusable.
| Quadrant | # 1 sec bins | Bins with >0 counts | Bins with >2000 counts | High rate bins dominated by noise | Noise dominated (total time) | Noise dominated (detector-on time) | Marked lightcurve |
|---|---|---|---|---|---|---|---|
| A | 7474 | 5322 | 10 | 10 | 0.13% | 0.19% | 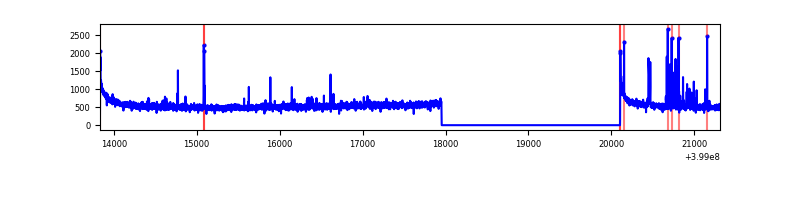 |
| B | 7474 | 5322 | 10 | 10 | 0.13% | 0.19% | 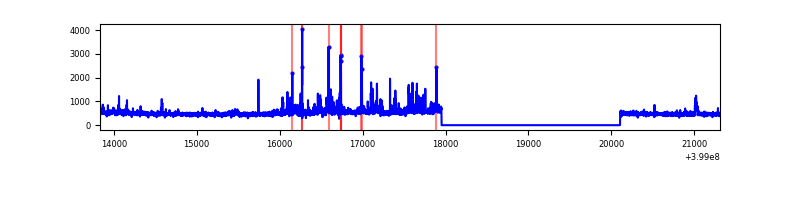 |
| C | 7474 | 5322 | 182 | 182 | 2.44% | 3.42% | 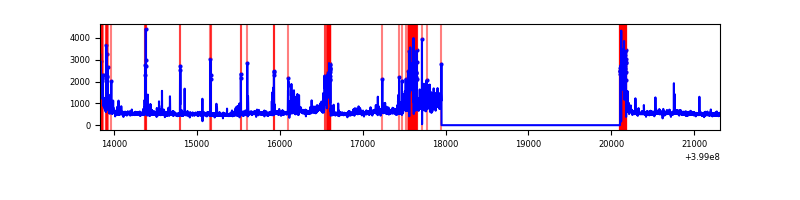 |
| D | 7474 | 5322 | 1672 | 1672 | 22.37% | 31.42% | 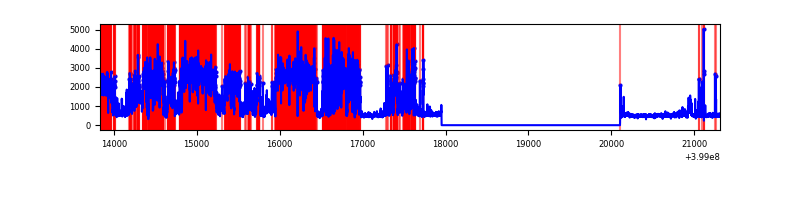 |
Top three noisy pixels from each quadrant. If the there are fewer than three noisy pixels in the level2.evt file, extra rows are filled as -1
| Pixel properties | Quadrant properties | ||||||
|---|---|---|---|---|---|---|---|
| Quadrant | DetID | PixID | Counts | Sigma | Mean | Median | Sigma |
| A | 10 | 83 | 276832 | 2137.7 | 652 | 641 | 129.2 |
| A | 13 | 248 | 71790 | 550.69 | 652 | 641 | 129.2 |
| A | 15 | 222 | 26654 | 201.34 | 652 | 641 | 129.2 |
| B | 5 | 255 | 87954 | 718.05 | 646 | 632 | 121.6 |
| B | 5 | 172 | 63692 | 518.55 | 646 | 632 | 121.6 |
| B | 0 | 190 | 63559 | 517.45 | 646 | 632 | 121.6 |
| C | 1 | 23 | 946941 | 6580.95 | 623 | 628 | 143.8 |
| C | 15 | 214 | 224170 | 1554.58 | 623 | 628 | 143.8 |
| C | 0 | 10 | 164766 | 1141.47 | 623 | 628 | 143.8 |
| D | 10 | 253 | 3876317 | 28897.18 | 554 | 541 | 134.1 |
| D | 12 | 227 | 1068876 | 7965.34 | 554 | 541 | 134.1 |
| D | 2 | 249 | 176723 | 1313.59 | 554 | 541 | 134.1 |
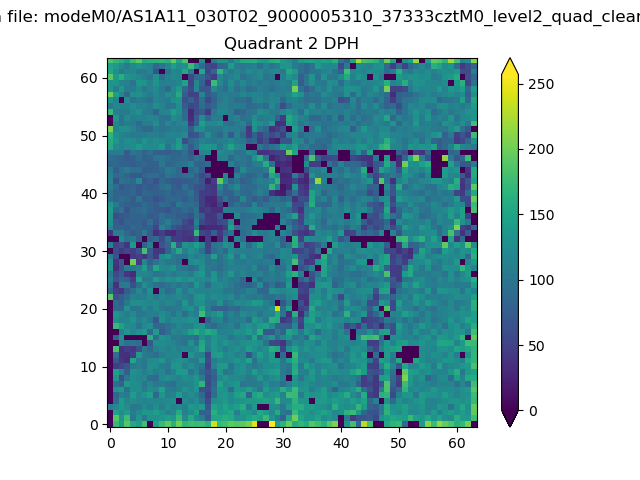
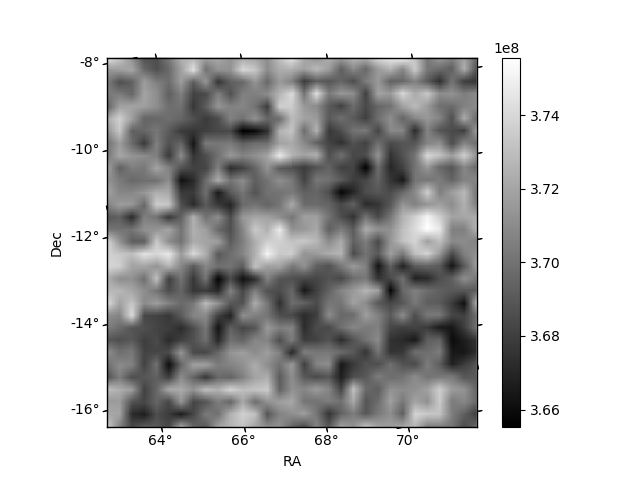
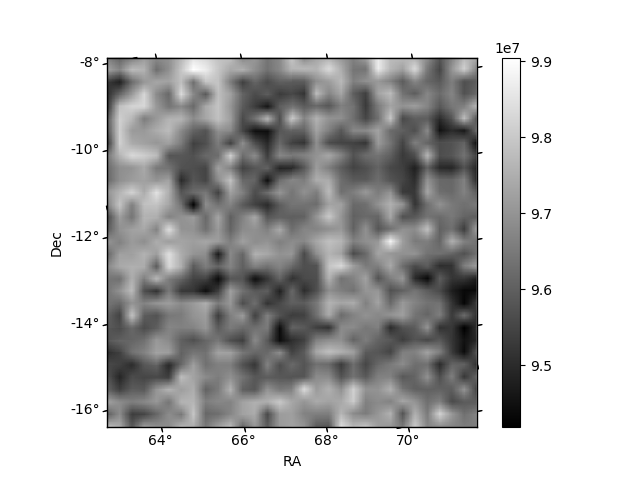
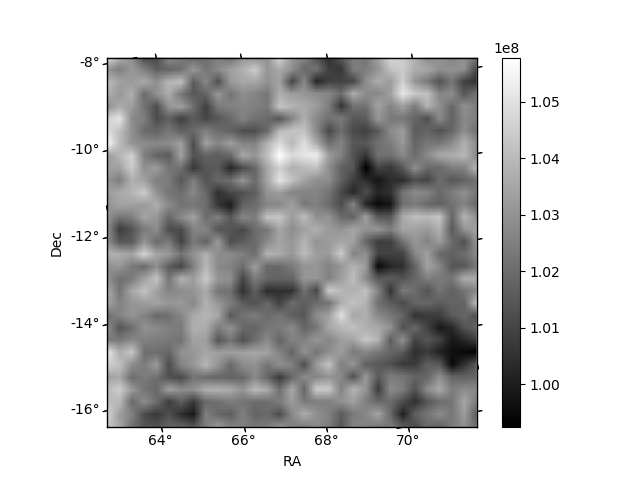
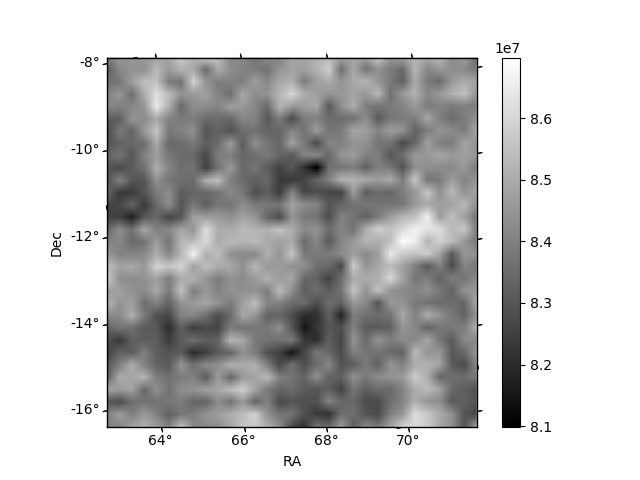
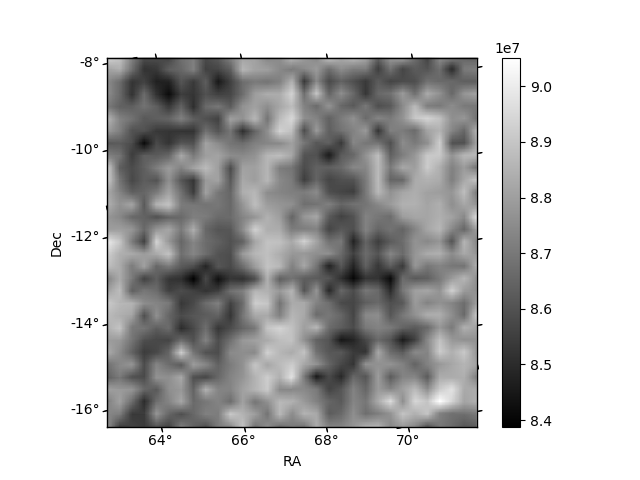
Histogram calculated using DETX and DETY for each event in the final _common_clean file
| Quadrant A | 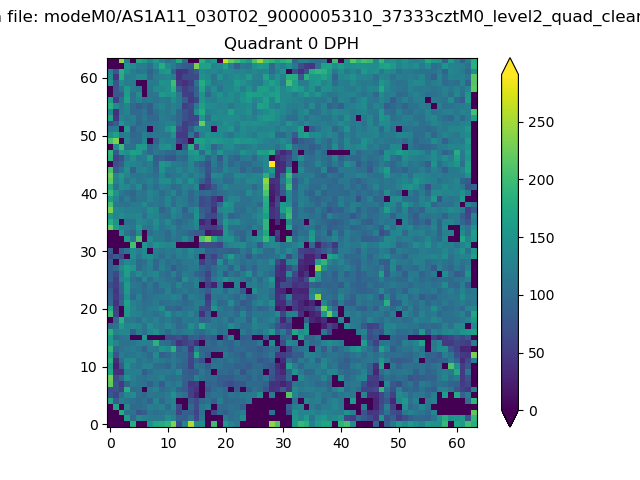 |
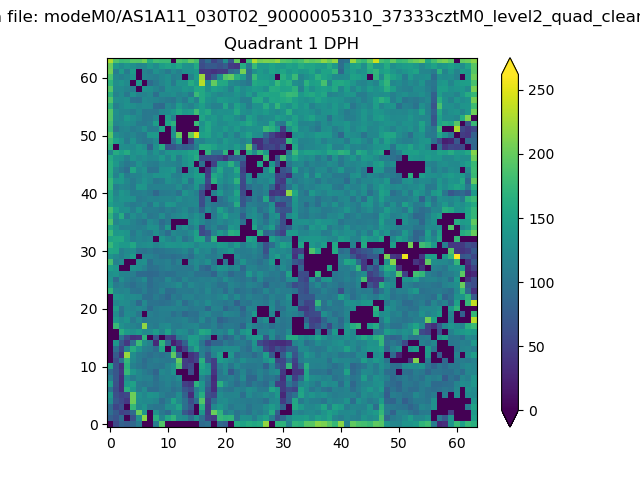 |
Quadrant B |
|---|---|---|---|
| Quadrant D | 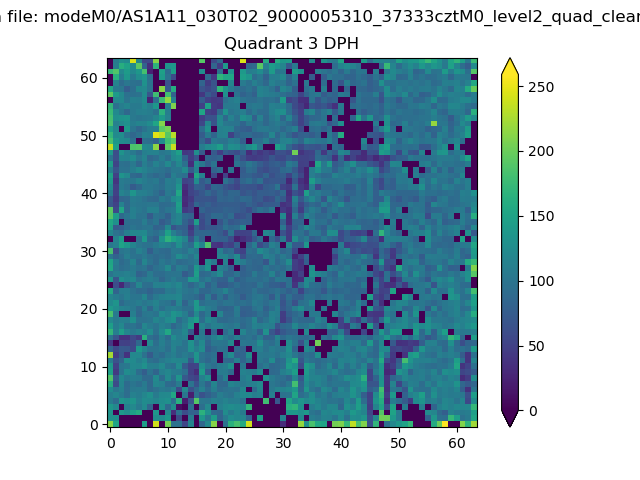 |
 |
Quadrant C |
| Plot type | Count rate plots | Images |
|---|---|---|
| Comparison with Poisson distribution Blue bars denote a histogram of data divided into 1 sec bins. Red curve is a Poisson curve with rate = median count rate of data. |
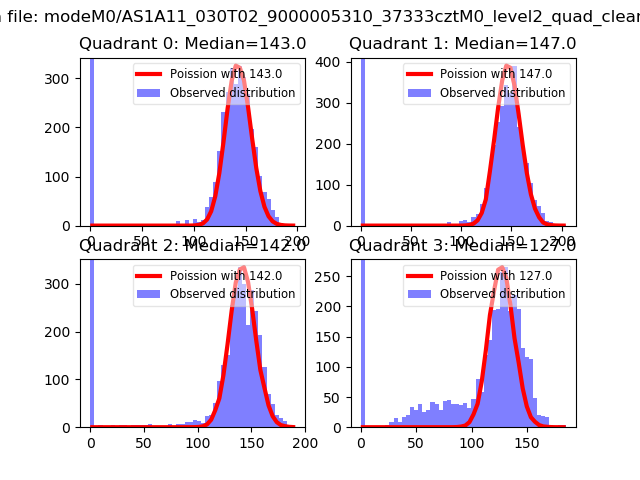 |
 |
| Quadrant-wise count rates Data is divided into 100 sec bins |
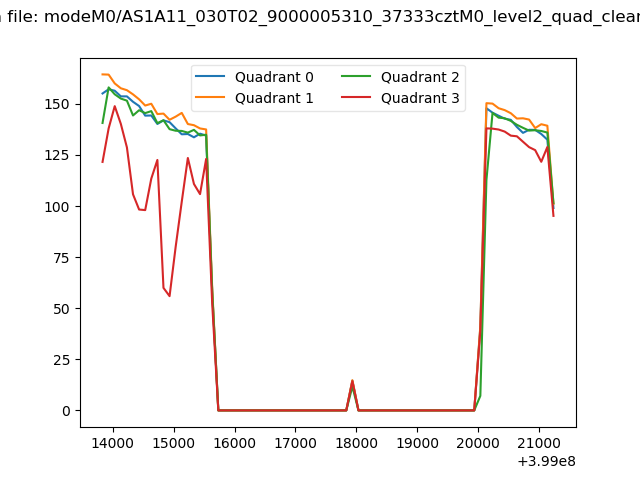 |
|
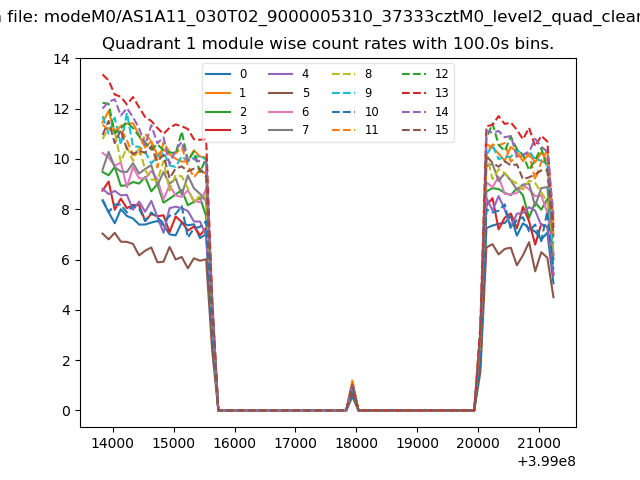
| Module-wise count rates for Quadrant A Data is divided into 100 sec bins |
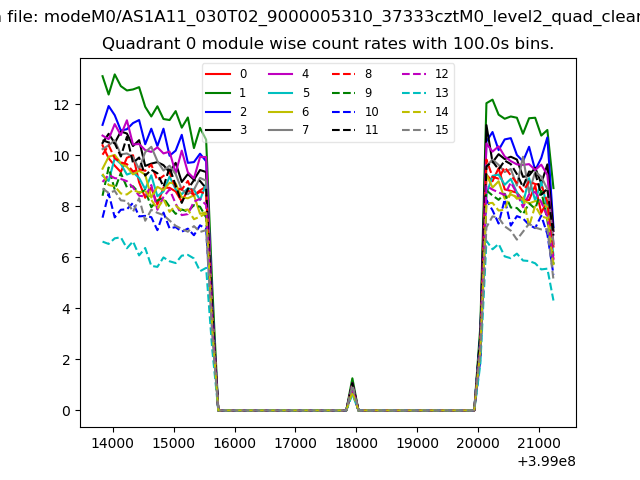 |
 |
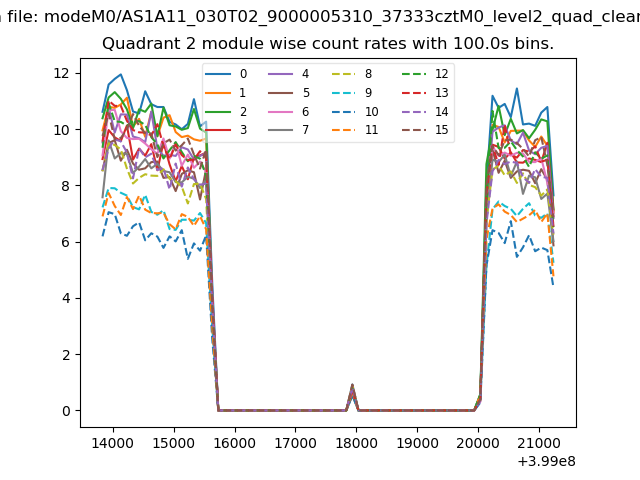
| Module-wise count rates for Quadrant B Data is divided into 100 sec bins |
 |
 |
| Module-wise count rates for Quadrant C Data is divided into 100 sec bins |
 |
 |
| Module-wise count rates for Quadrant D Data is divided into 100 sec bins |
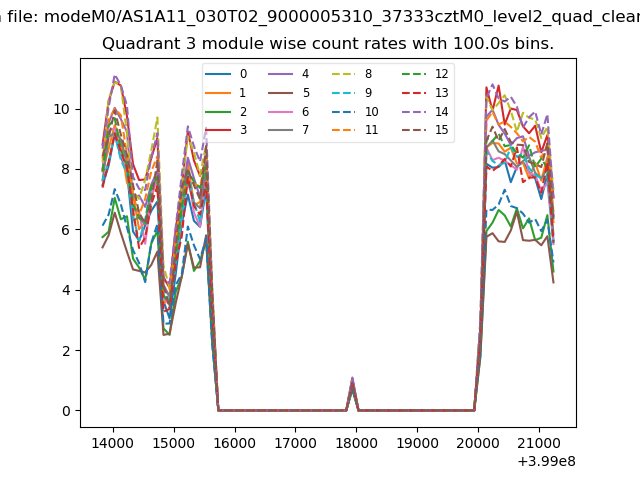 |
 |
| Parameter | Plot |
|---|---|
| CZT HV Monitor |  |
| D_VDD | 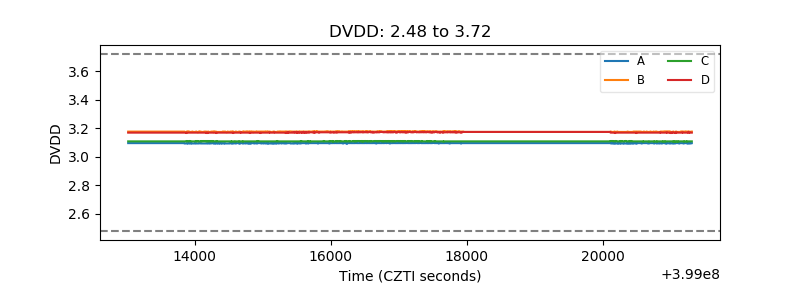 |
| Temperature 1 | 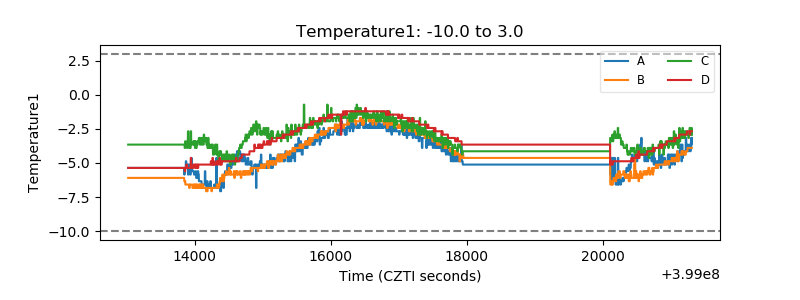 |
| Veto HV Monitor | 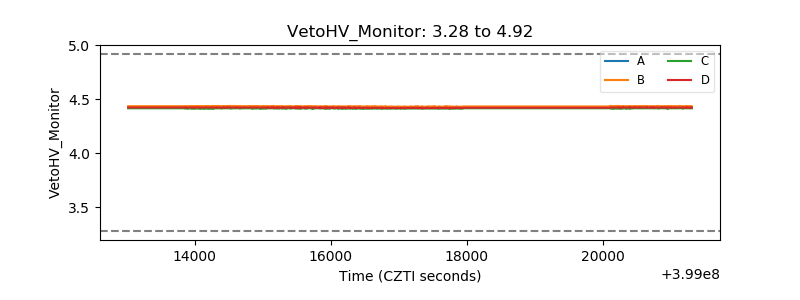 |
| Veto LLD | 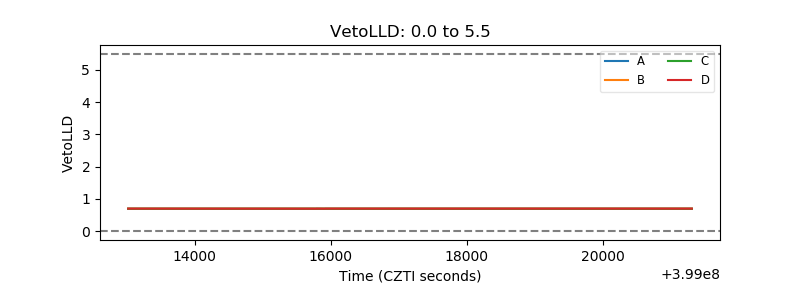 |
| Alpha Counter | 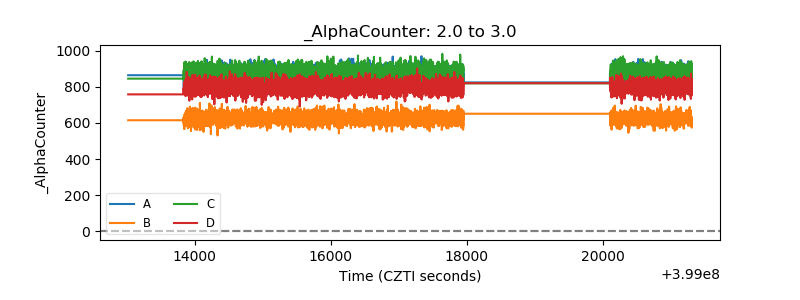 |
| _CPM_Rate | 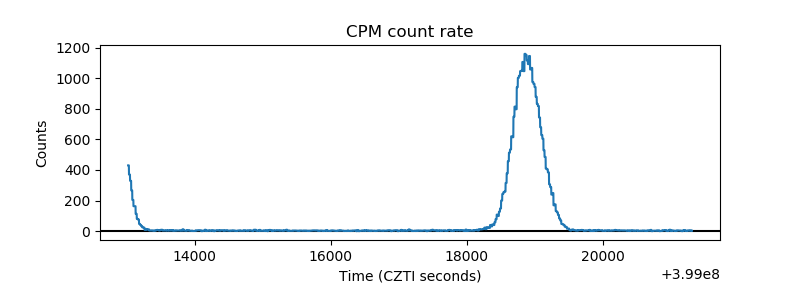 |
| CZT Counter | 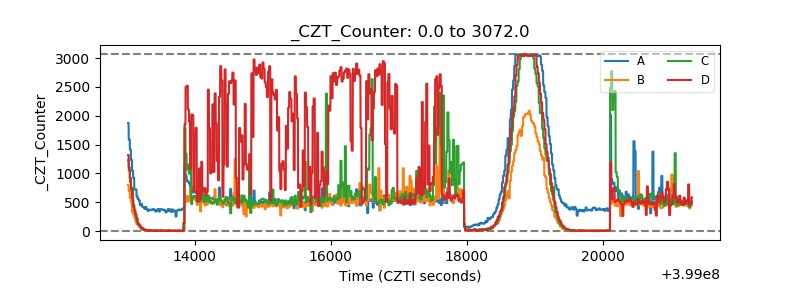 |
| +2.5 Volts monitor | 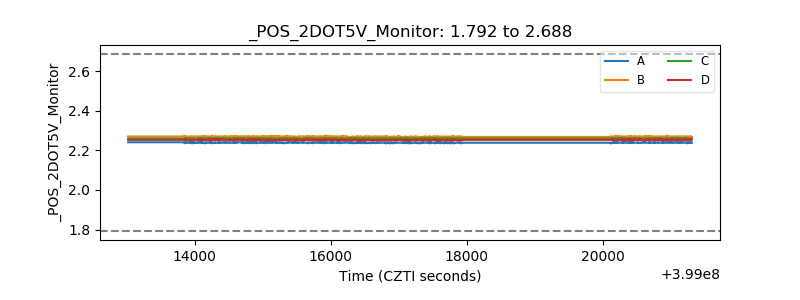 |
| +5 Volts monitor | 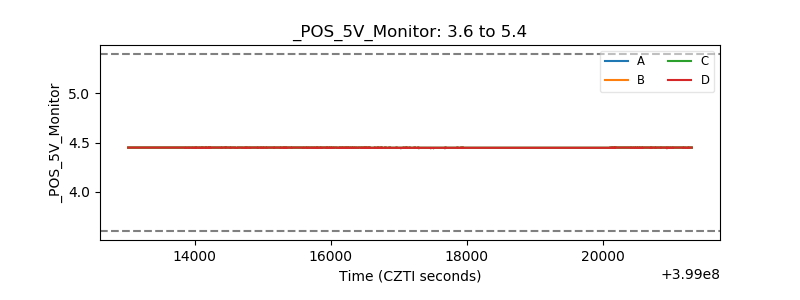 |
| _ROLL_ROT | 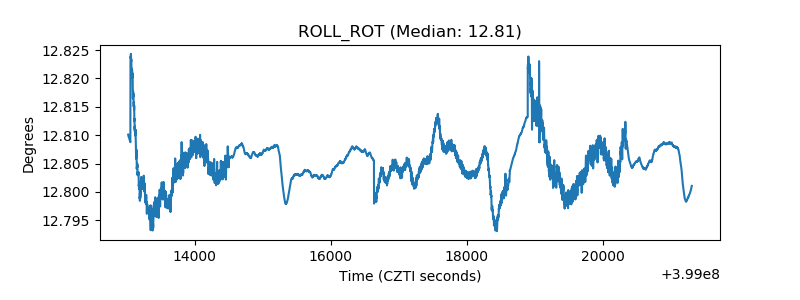 |
| _Roll_DEC | 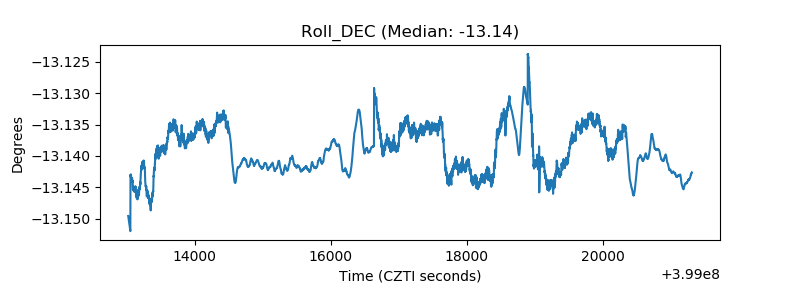 |
| _Roll_RA | 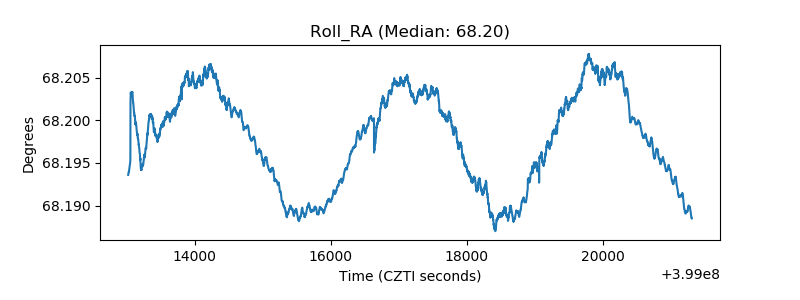 |
| Veto Counter | 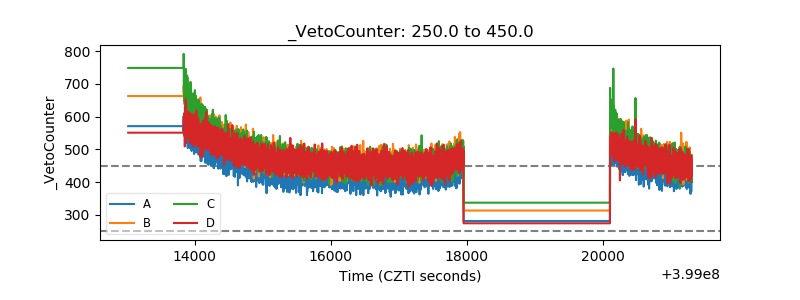 |