| Param | Original file | Final file |
|---|---|---|
| Filename | modeM0/AS1A11_030T02_9000005310_37334cztM0_level2.evt | modeM0/AS1A11_030T02_9000005310_37334cztM0_level2_quad_clean.evt |
| Size (bytes) | 415,264,320 | 62,138,880 |
| Size | 396.0 MB | 59.3 MB |
| Events in quadrant A | 3,026,818 | 380,052 |
| Events in quadrant B | 2,807,383 | 390,593 |
| Events in quadrant C | 3,167,389 | 377,677 |
| Events in quadrant D | 3,213,580 | 360,795 |
| Mode M0 | |||
|---|---|---|---|
| Quadrant | BADHDUFLAG | Total packets | Discarded packets |
| A | 0 | 12114 | 2 |
| B | 0 | 11647 | 1 |
| C | 0 | 12511 | 1 |
| D | 0 | 12859 | 1 |
| Mode SS | |||
|---|---|---|---|
| Quadrant | BADHDUFLAG | Total packets | Discarded packets |
| A | 0 | 108 | 0 |
| B | 0 | 108 | 0 |
| C | 0 | 108 | 0 |
| D | 0 | 108 | 0 |
| Mode M9 | |||
|---|---|---|---|
| Quadrant | BADHDUFLAG | Total packets | Discarded packets |
| A | 0 | 21 | 0 |
| B | 0 | 21 | 0 |
| C | 0 | 21 | 0 |
| D | 0 | 21 | 0 |
| Quadrant | Total seconds | Saturated seconds | Saturation percentage |
|---|---|---|---|
| A | 5317 | 16 | 0.300922% |
| B | 5317 | 46 | 0.865150% |
| C | 5317 | 85 | 1.598646% |
| D | 5317 | 138 | 2.595449% |
Noise dominated data is calculated using 1-second bins in cleaned event files. If a bin has >2000 counts, and if more than 50% of those come from <1% of pixels, then it is considered to be noise-dominated and hence unusable.
| Quadrant | # 1 sec bins | Bins with >0 counts | Bins with >2000 counts | High rate bins dominated by noise | Noise dominated (total time) | Noise dominated (detector-on time) | Marked lightcurve |
|---|---|---|---|---|---|---|---|
| A | 7439 | 5318 | 7 | 7 | 0.09% | 0.13% | 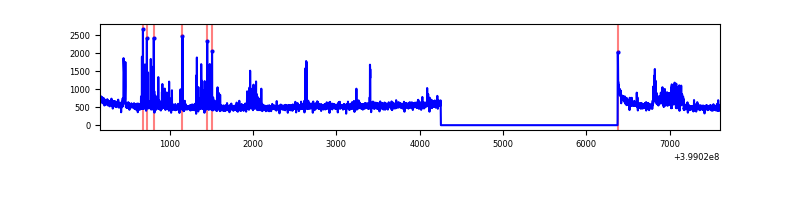 |
| B | 7439 | 5318 | 17 | 17 | 0.23% | 0.32% | 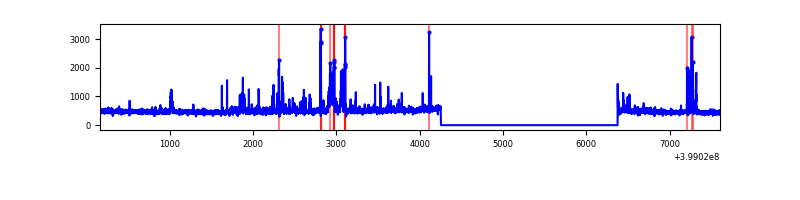 |
| C | 7439 | 5318 | 56 | 56 | 0.75% | 1.05% | 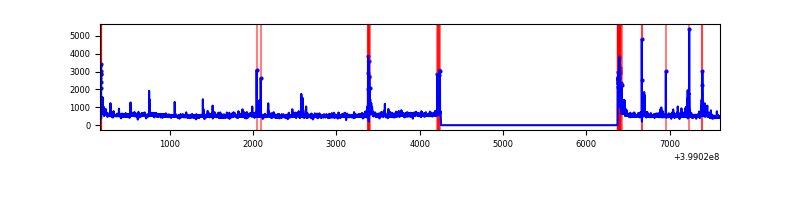 |
| D | 7439 | 5318 | 129 | 129 | 1.73% | 2.43% | 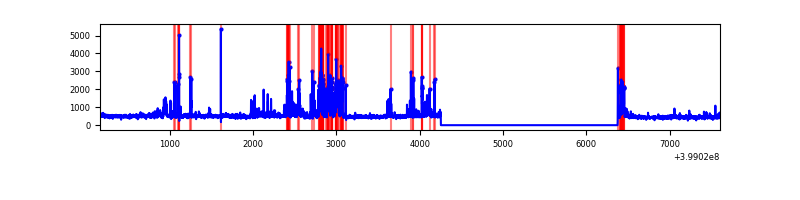 |
Top three noisy pixels from each quadrant. If the there are fewer than three noisy pixels in the level2.evt file, extra rows are filled as -1
| Pixel properties | Quadrant properties | ||||||
|---|---|---|---|---|---|---|---|
| Quadrant | DetID | PixID | Counts | Sigma | Mean | Median | Sigma |
| A | 10 | 83 | 252386 | 1970.19 | 638 | 628 | 127.8 |
| A | 13 | 248 | 133900 | 1042.95 | 638 | 628 | 127.8 |
| A | 15 | 254 | 92615 | 719.87 | 638 | 628 | 127.8 |
| B | 5 | 255 | 119034 | 982.46 | 629 | 615 | 120.5 |
| B | 0 | 190 | 64263 | 528.05 | 629 | 615 | 120.5 |
| B | 5 | 172 | 48329 | 395.86 | 629 | 615 | 120.5 |
| C | 1 | 23 | 285733 | 2009.54 | 613 | 619 | 141.9 |
| C | 15 | 214 | 224896 | 1580.75 | 613 | 619 | 141.9 |
| C | 0 | 10 | 123058 | 862.97 | 613 | 619 | 141.9 |
| D | 10 | 253 | 394647 | 2597.5 | 620 | 604 | 151.7 |
| D | 2 | 249 | 141288 | 927.38 | 620 | 604 | 151.7 |
| D | 10 | 204 | 104624 | 685.69 | 620 | 604 | 151.7 |
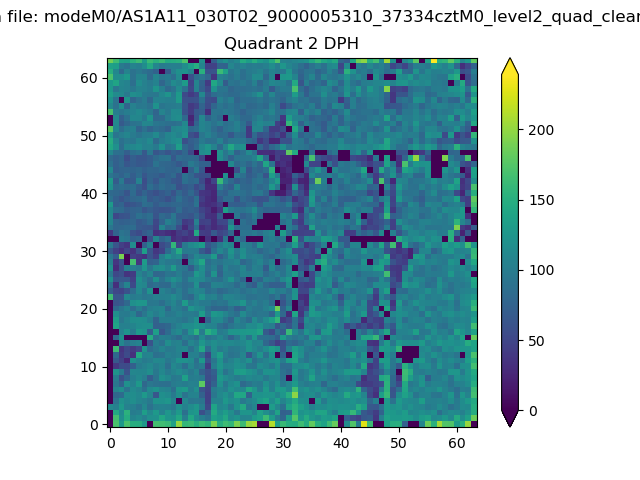
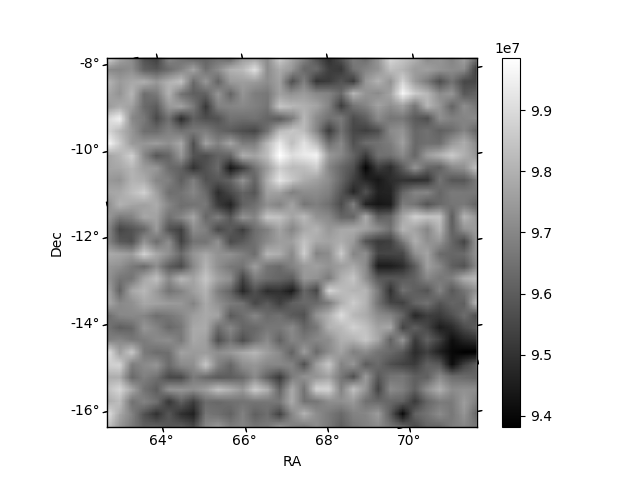
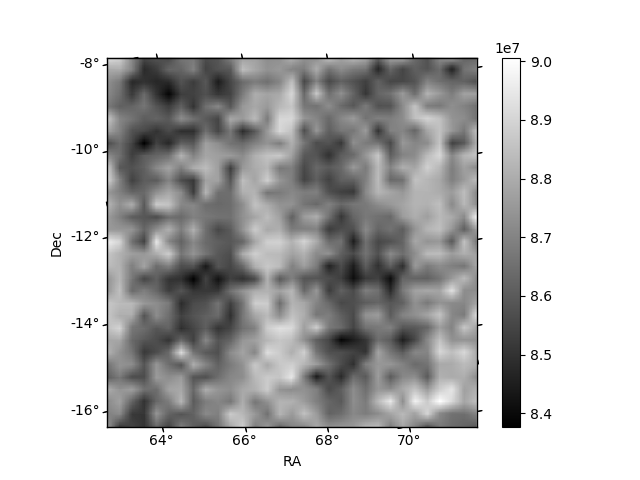
Histogram calculated using DETX and DETY for each event in the final _common_clean file
| Quadrant A | 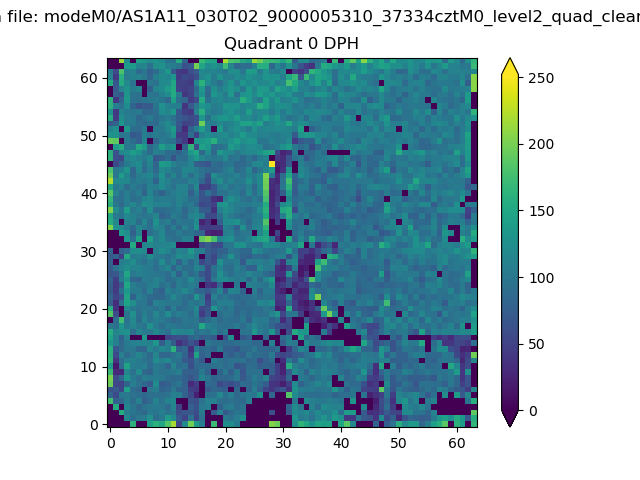 |
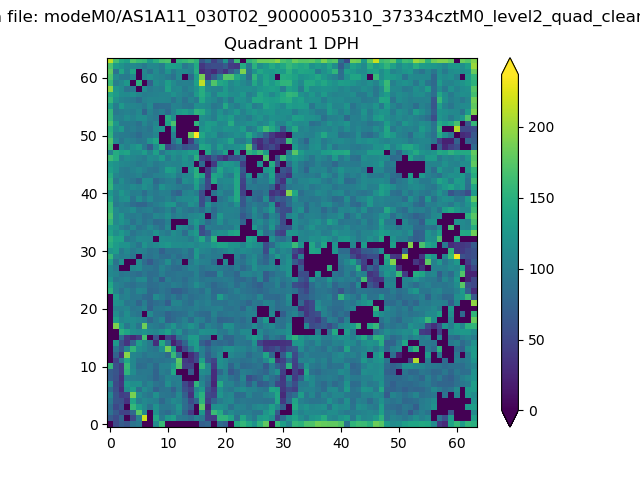 |
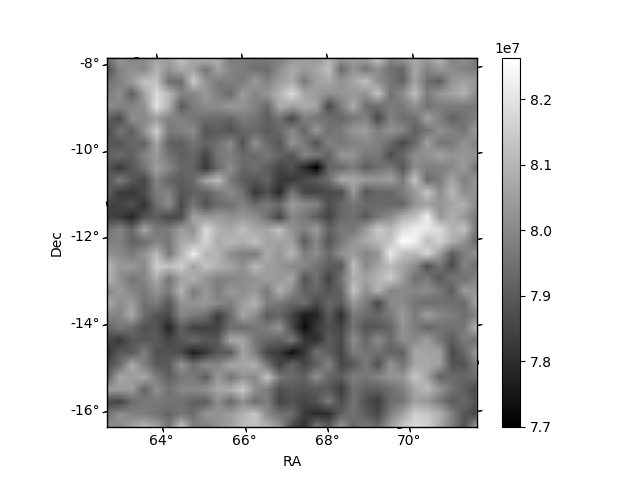
Quadrant B |
|---|---|---|---|
| Quadrant D | 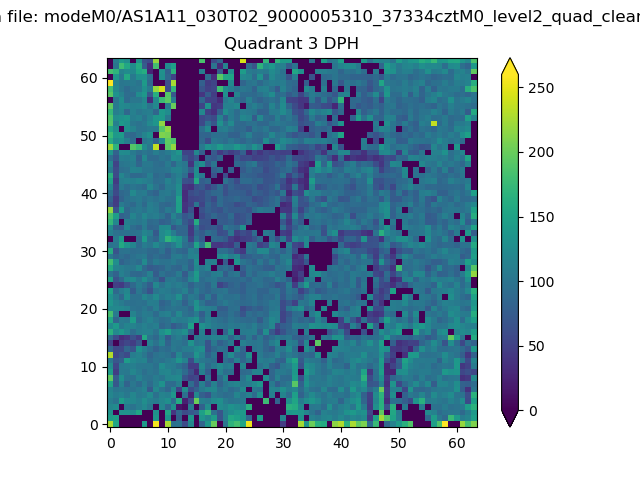 |
 |
Quadrant C |
| Plot type | Count rate plots | Images |
|---|---|---|
| Comparison with Poisson distribution Blue bars denote a histogram of data divided into 1 sec bins. Red curve is a Poisson curve with rate = median count rate of data. |
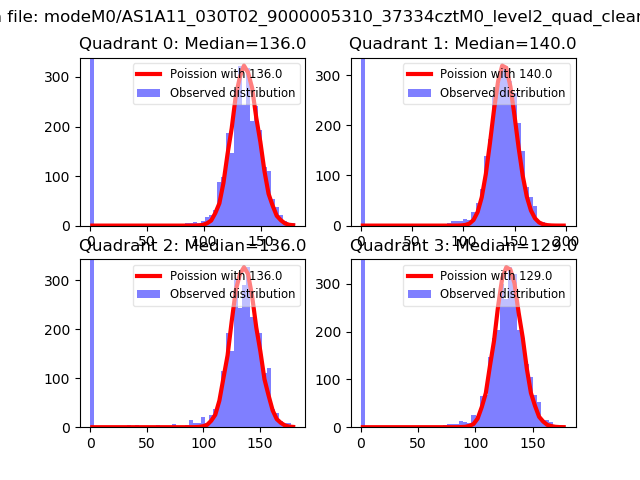 |
 |
| Quadrant-wise count rates Data is divided into 100 sec bins |
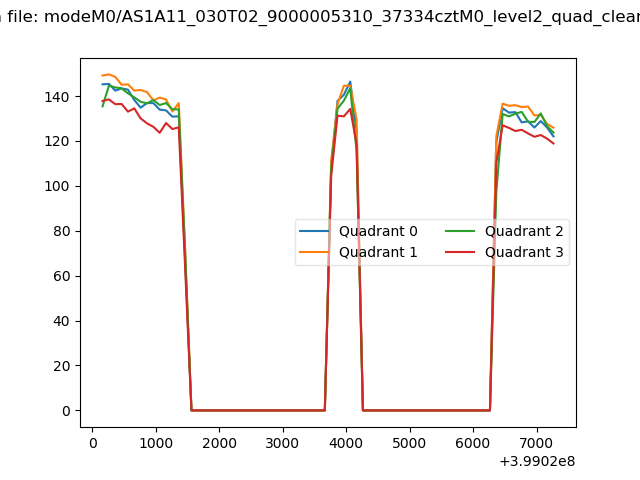 |
|
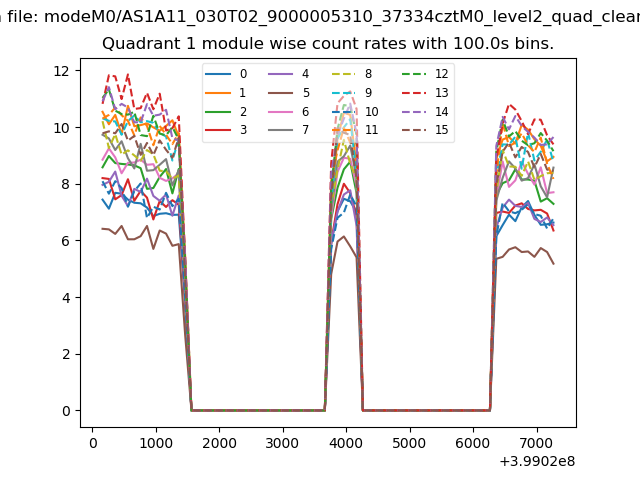
| Module-wise count rates for Quadrant A Data is divided into 100 sec bins |
 |
 |
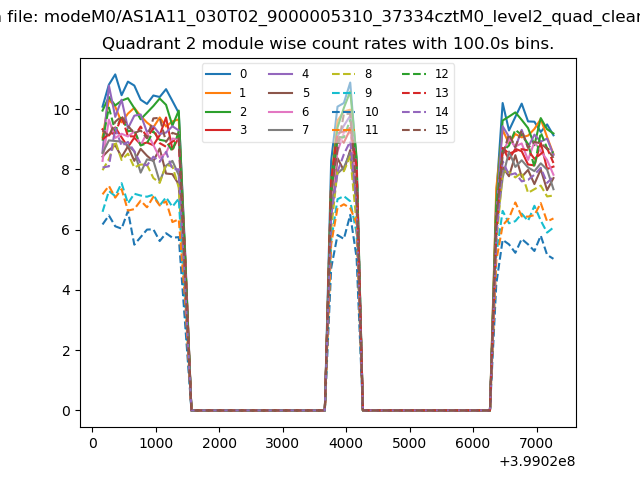
| Module-wise count rates for Quadrant B Data is divided into 100 sec bins |
 |
 |
| Module-wise count rates for Quadrant C Data is divided into 100 sec bins |
 |
 |
| Module-wise count rates for Quadrant D Data is divided into 100 sec bins |
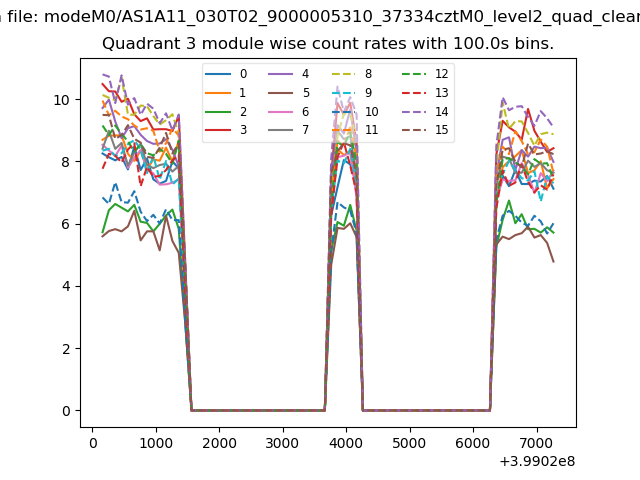 |
 |
| Parameter | Plot |
|---|---|
| CZT HV Monitor | 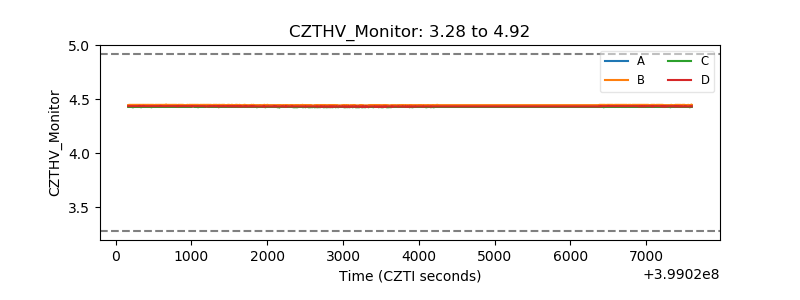 |
| D_VDD | 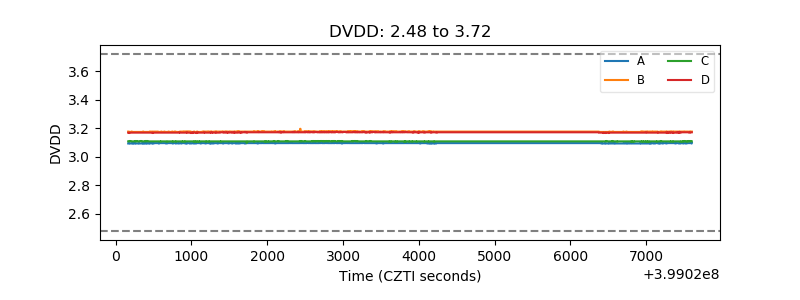 |
| Temperature 1 | 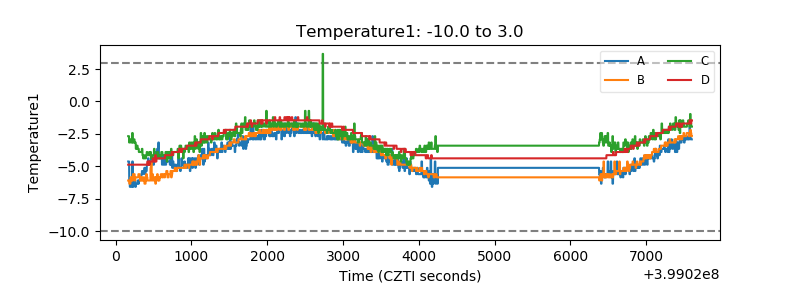 |
| Veto HV Monitor | 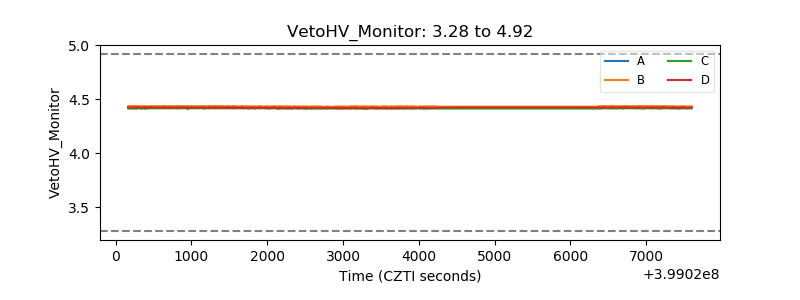 |
| Veto LLD | 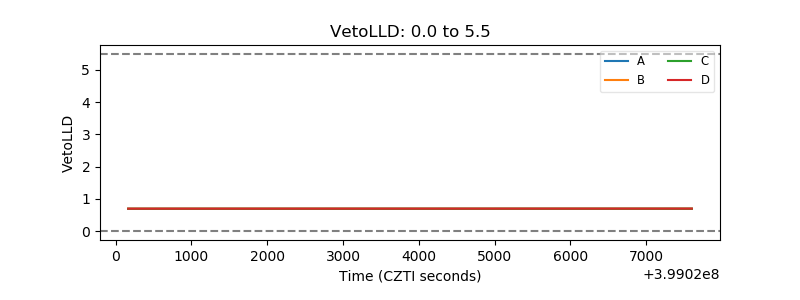 |
| Alpha Counter | 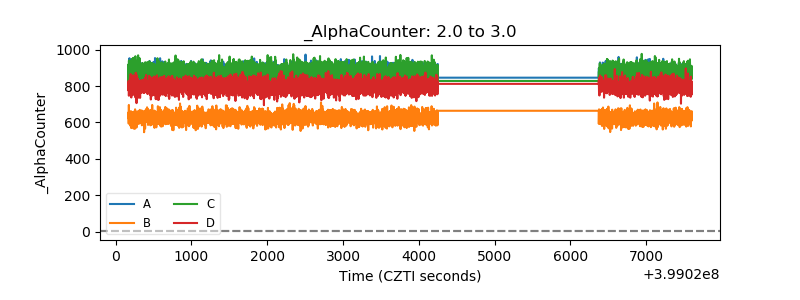 |
| _CPM_Rate | 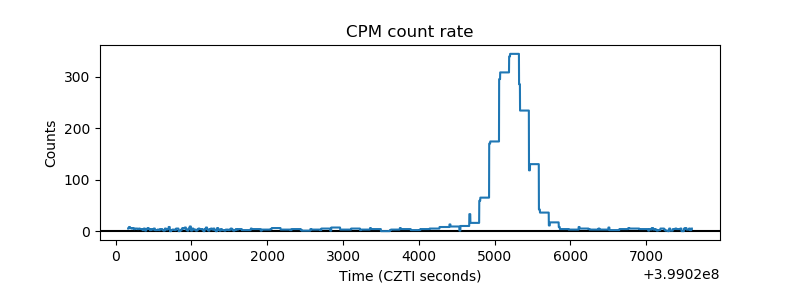 |
| CZT Counter | 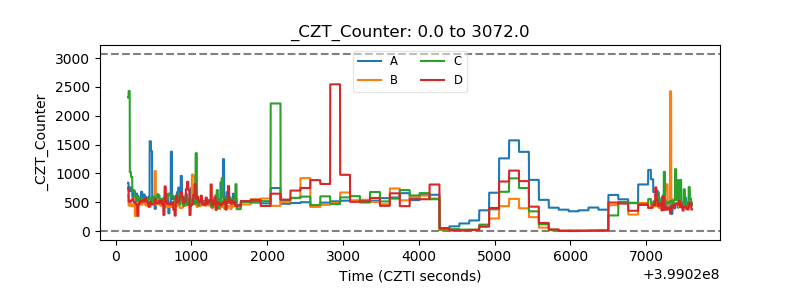 |
| +2.5 Volts monitor | 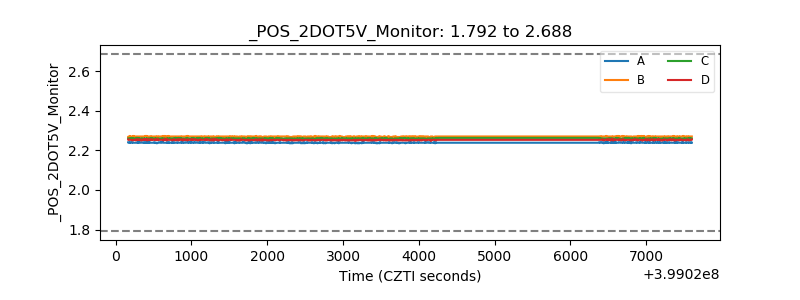 |
| +5 Volts monitor | 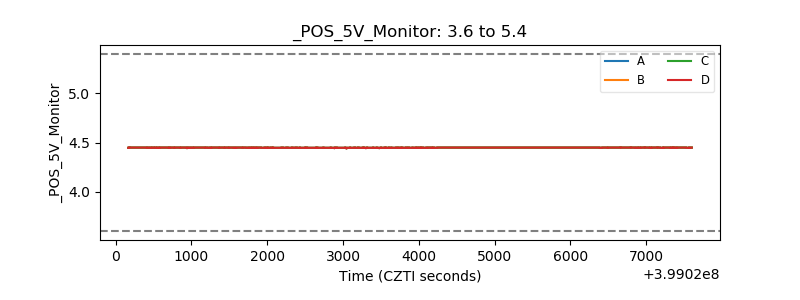 |
| _ROLL_ROT | 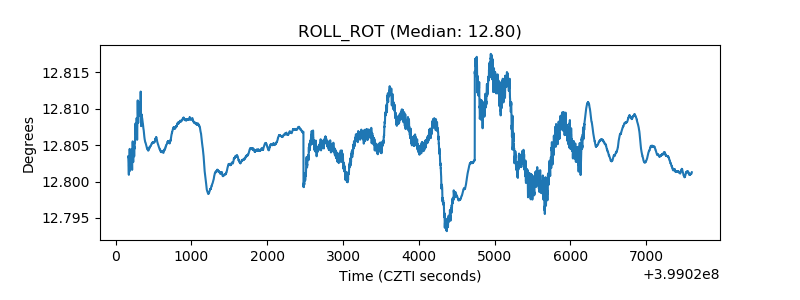 |
| _Roll_DEC | 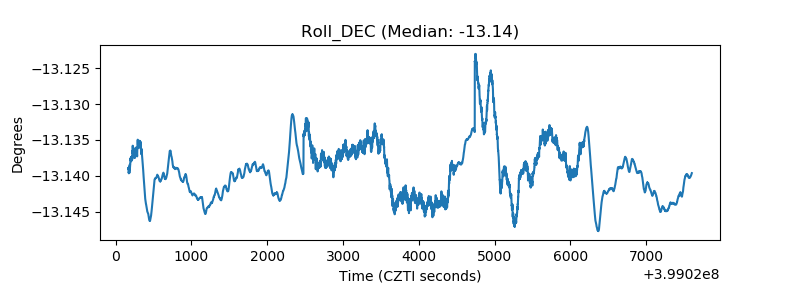 |
| _Roll_RA | 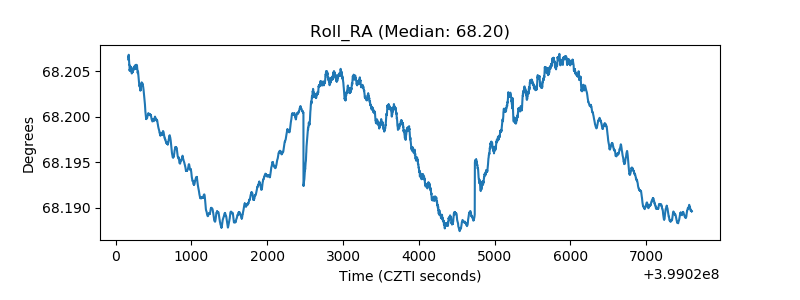 |
| Veto Counter |  |