| Param | Original file | Final file |
|---|---|---|
| Filename | modeM0/AS1A11_030T02_9000005310_37335cztM0_level2.evt | modeM0/AS1A11_030T02_9000005310_37335cztM0_level2_quad_clean.evt |
| Size (bytes) | 448,850,880 | 56,442,240 |
| Size | 428.1 MB | 53.8 MB |
| Events in quadrant A | 2,994,603 | 337,909 |
| Events in quadrant B | 2,821,478 | 346,343 |
| Events in quadrant C | 3,529,416 | 329,762 |
| Events in quadrant D | 3,882,576 | 318,019 |
| Mode M0 | |||
|---|---|---|---|
| Quadrant | BADHDUFLAG | Total packets | Discarded packets |
| A | 0 | 11975 | 3 |
| B | 0 | 11773 | 2 |
| C | 0 | 13837 | 2 |
| D | 0 | 15139 | 2 |
| Mode SS | |||
|---|---|---|---|
| Quadrant | BADHDUFLAG | Total packets | Discarded packets |
| A | 0 | 110 | 0 |
| B | 0 | 110 | 0 |
| C | 0 | 110 | 0 |
| D | 0 | 110 | 0 |
| Mode M9 | |||
|---|---|---|---|
| Quadrant | BADHDUFLAG | Total packets | Discarded packets |
| A | 0 | 20 | 0 |
| B | 0 | 20 | 0 |
| C | 0 | 20 | 0 |
| D | 0 | 20 | 0 |
| Quadrant | Total seconds | Saturated seconds | Saturation percentage |
|---|---|---|---|
| A | 5379 | 18 | 0.334635% |
| B | 5379 | 45 | 0.836587% |
| C | 5379 | 153 | 2.844395% |
| D | 5380 | 288 | 5.353160% |
Noise dominated data is calculated using 1-second bins in cleaned event files. If a bin has >2000 counts, and if more than 50% of those come from <1% of pixels, then it is considered to be noise-dominated and hence unusable.
| Quadrant | # 1 sec bins | Bins with >0 counts | Bins with >2000 counts | High rate bins dominated by noise | Noise dominated (total time) | Noise dominated (detector-on time) | Marked lightcurve |
|---|---|---|---|---|---|---|---|
| A | 7353 | 5380 | 11 | 11 | 0.15% | 0.20% | 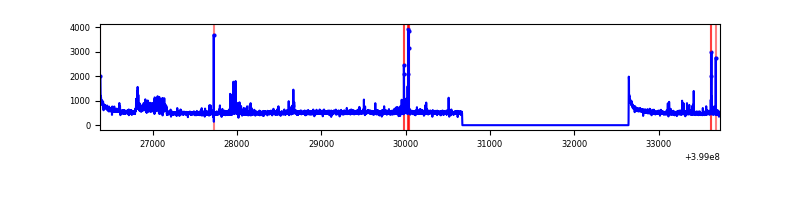 |
| B | 7353 | 5380 | 18 | 18 | 0.24% | 0.33% | 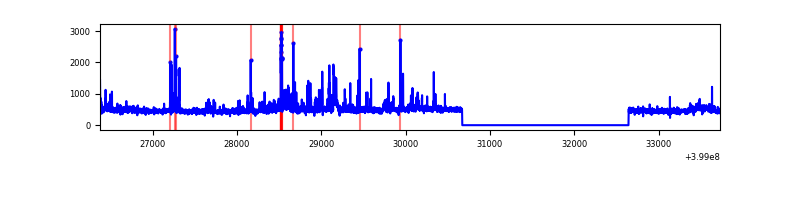 |
| C | 7353 | 5380 | 125 | 125 | 1.70% | 2.32% | 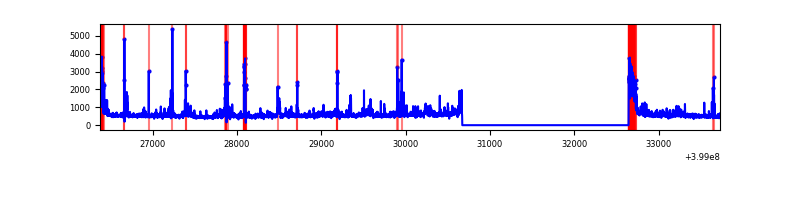 |
| D | 7354 | 5381 | 234 | 234 | 3.18% | 4.35% | 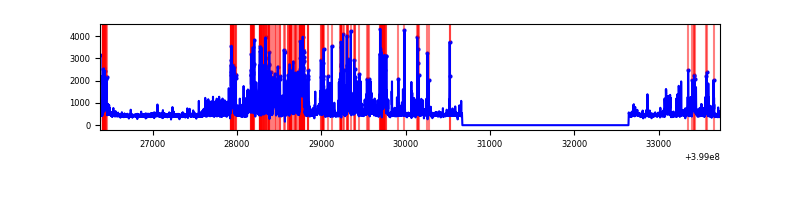 |
Top three noisy pixels from each quadrant. If the there are fewer than three noisy pixels in the level2.evt file, extra rows are filled as -1
| Pixel properties | Quadrant properties | ||||||
|---|---|---|---|---|---|---|---|
| Quadrant | DetID | PixID | Counts | Sigma | Mean | Median | Sigma |
| A | 10 | 83 | 279317 | 2185.67 | 629 | 617 | 127.5 |
| A | 15 | 254 | 92623 | 721.55 | 629 | 617 | 127.5 |
| A | 13 | 248 | 83130 | 647.1 | 629 | 617 | 127.5 |
| B | 5 | 172 | 103506 | 861.35 | 622 | 608 | 119.5 |
| B | 0 | 190 | 103304 | 859.66 | 622 | 608 | 119.5 |
| B | 5 | 255 | 62234 | 515.87 | 622 | 608 | 119.5 |
| C | 1 | 23 | 468853 | 3311.59 | 603 | 609 | 141.4 |
| C | 0 | 10 | 278073 | 1962.32 | 603 | 609 | 141.4 |
| C | 15 | 214 | 226292 | 1596.11 | 603 | 609 | 141.4 |
| D | 2 | 249 | 631093 | 4324.34 | 602 | 586 | 145.8 |
| D | 10 | 253 | 462721 | 3169.56 | 602 | 586 | 145.8 |
| D | 12 | 233 | 126488 | 863.5 | 602 | 586 | 145.8 |
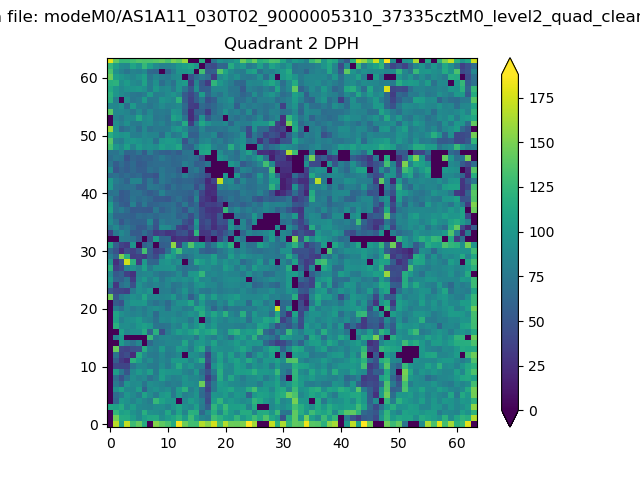
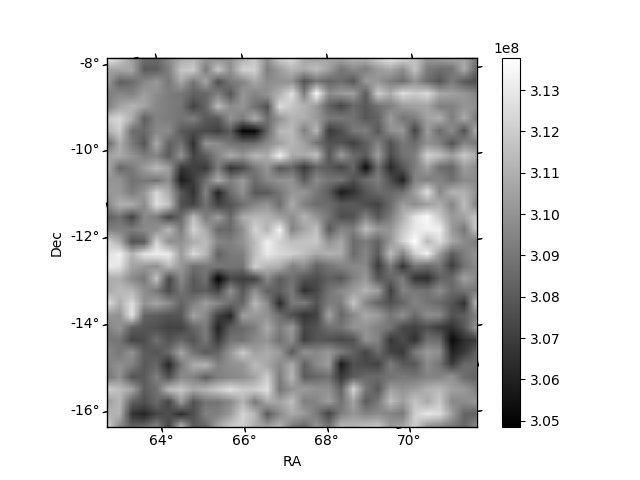
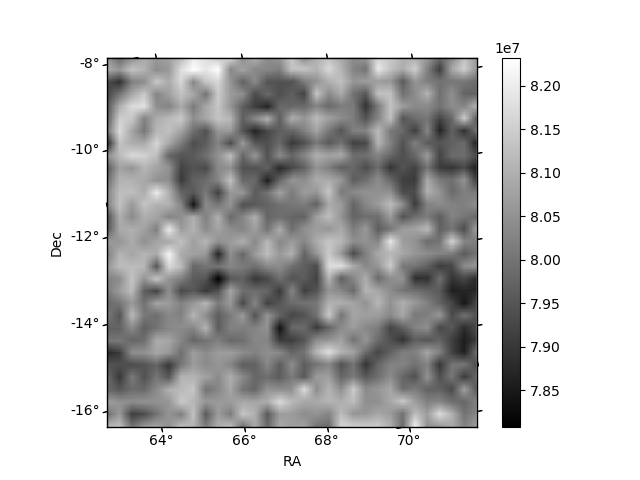
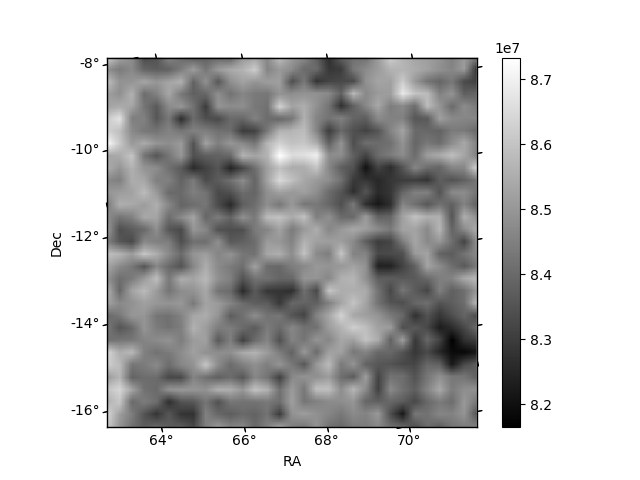
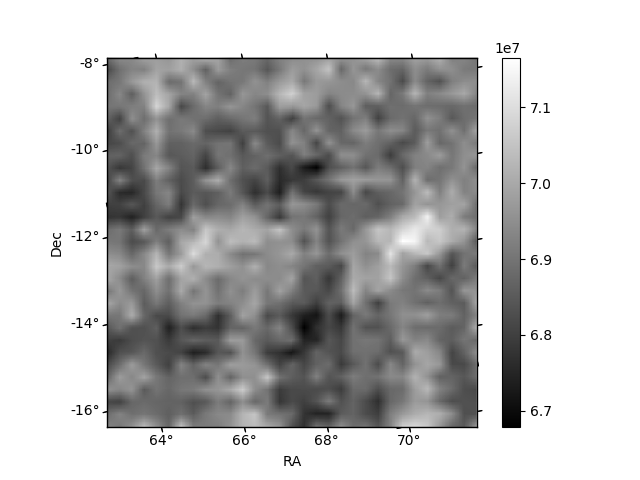
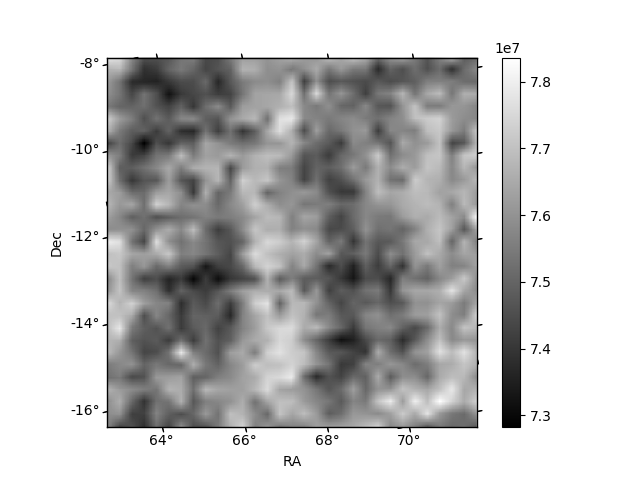
Histogram calculated using DETX and DETY for each event in the final _common_clean file
| Quadrant A | 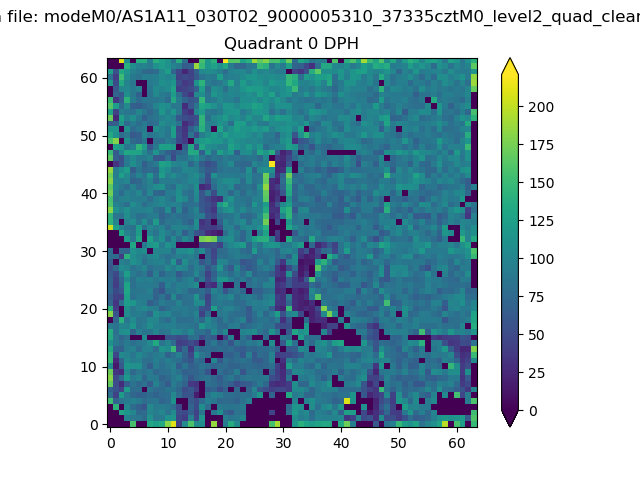 |
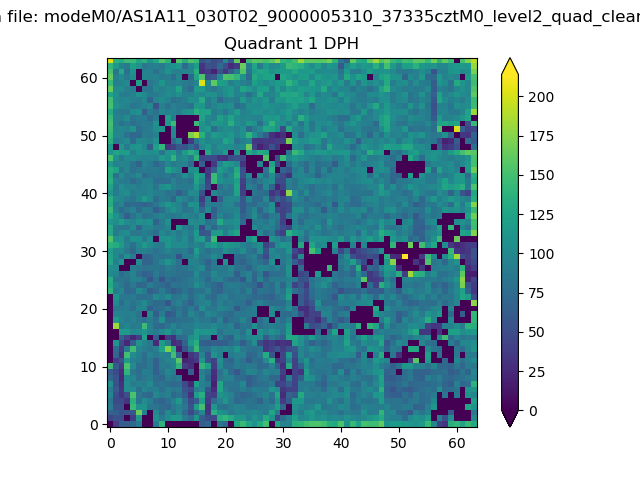 |
Quadrant B |
|---|---|---|---|
| Quadrant D | 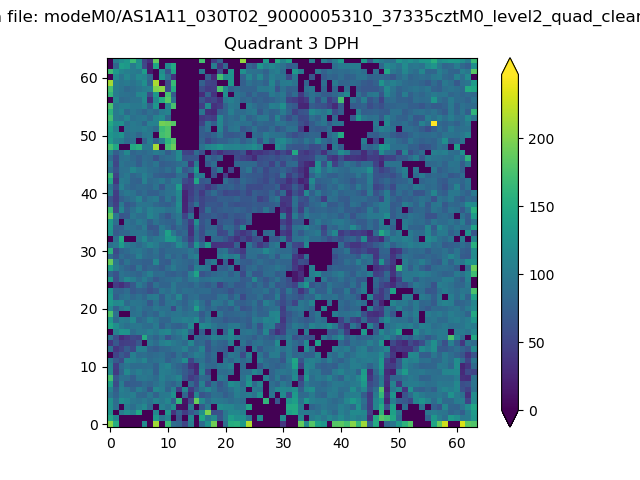 |
 |
Quadrant C |
| Plot type | Count rate plots | Images |
|---|---|---|
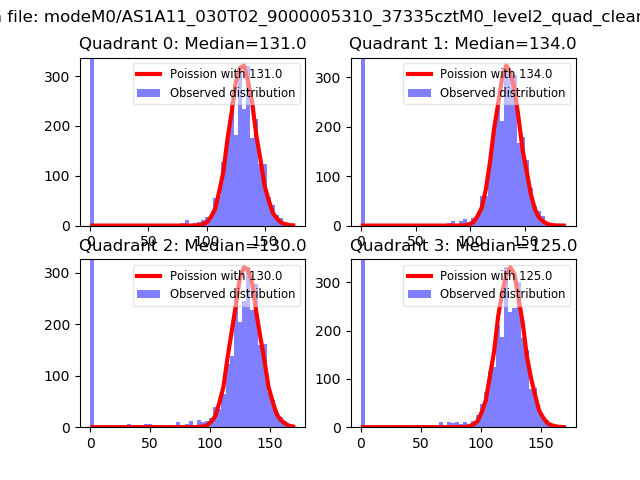
| Comparison with Poisson distribution Blue bars denote a histogram of data divided into 1 sec bins. Red curve is a Poisson curve with rate = median count rate of data. |
 |
 |
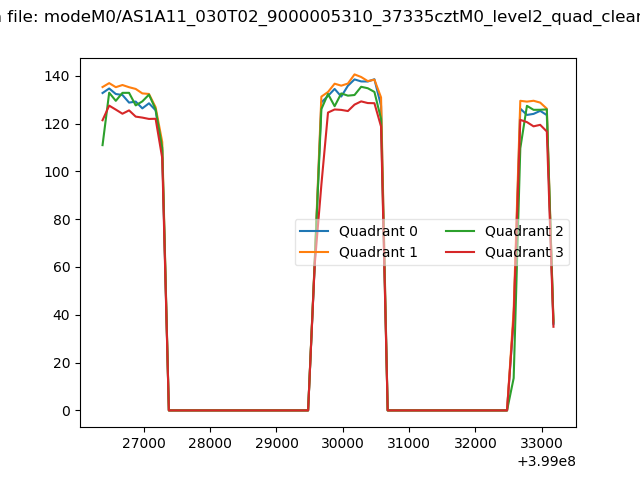
| Quadrant-wise count rates Data is divided into 100 sec bins |
 |
|
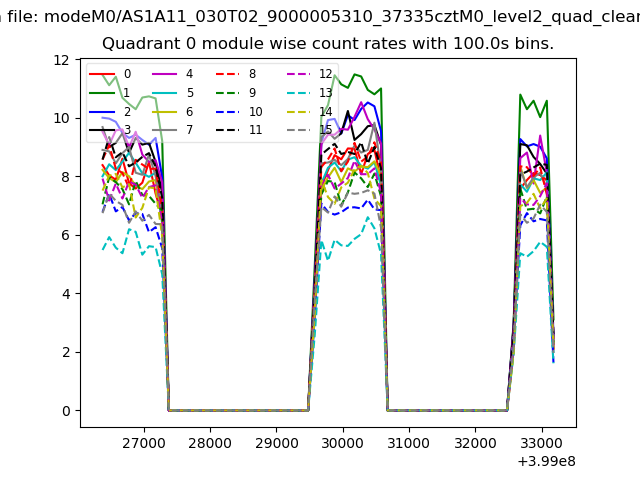
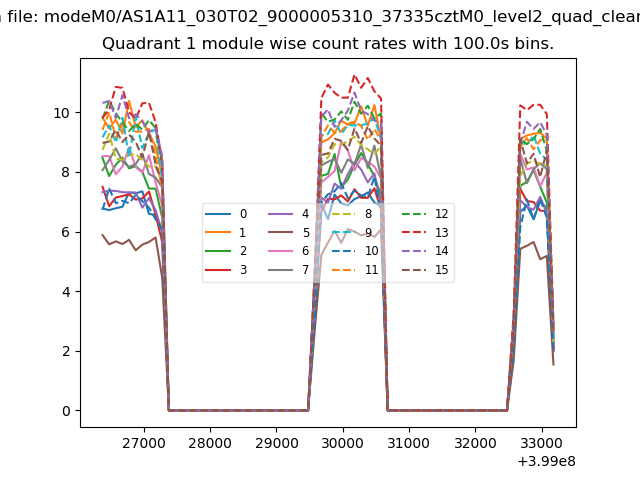
| Module-wise count rates for Quadrant A Data is divided into 100 sec bins |
 |
 |
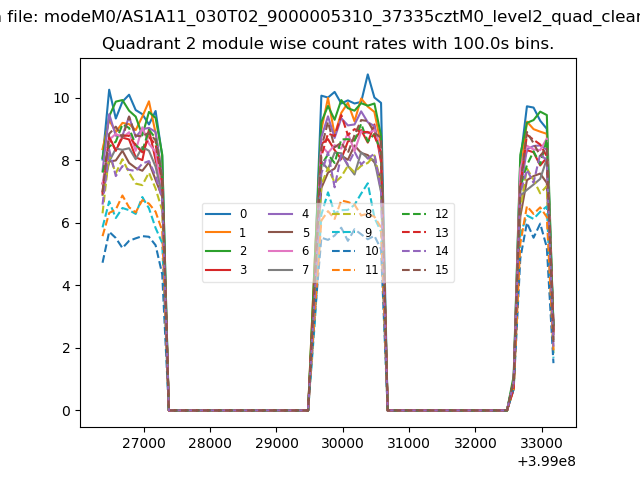
| Module-wise count rates for Quadrant B Data is divided into 100 sec bins |
 |
 |
| Module-wise count rates for Quadrant C Data is divided into 100 sec bins |
 |
 |
| Module-wise count rates for Quadrant D Data is divided into 100 sec bins |
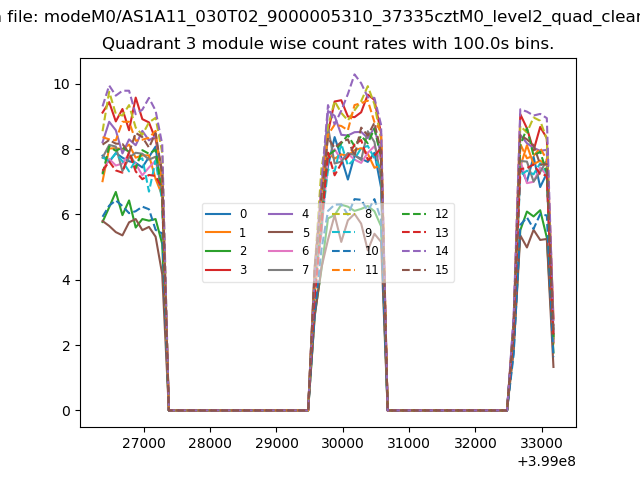 |
 |
| Parameter | Plot |
|---|---|
| CZT HV Monitor | 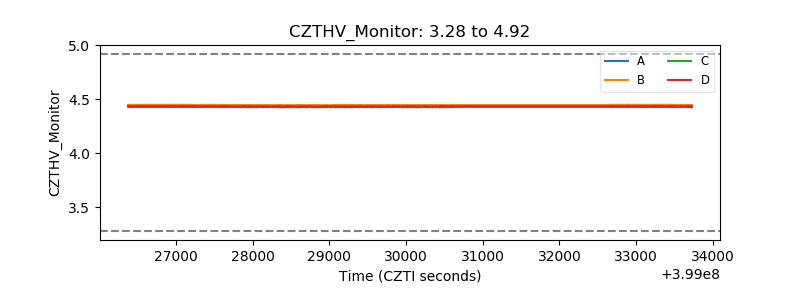 |
| D_VDD | 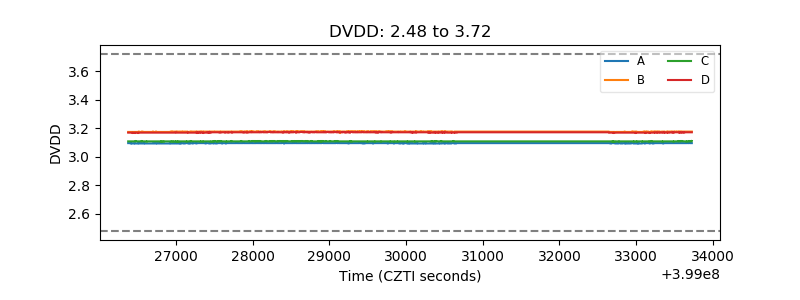 |
| Temperature 1 | 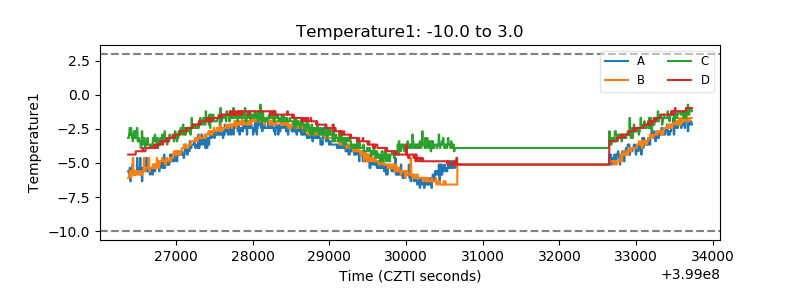 |
| Veto HV Monitor | 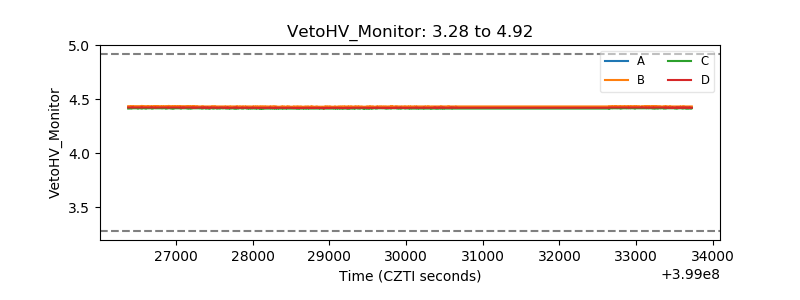 |
| Veto LLD | 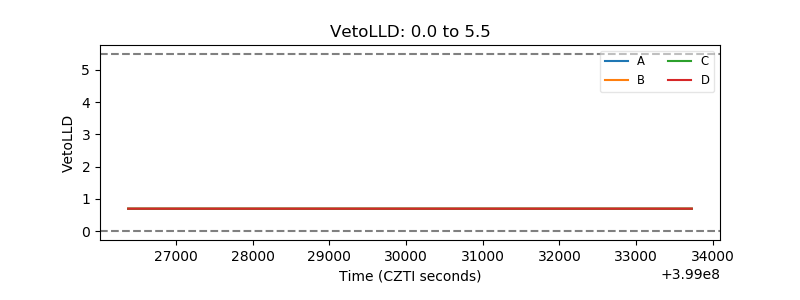 |
| Alpha Counter | 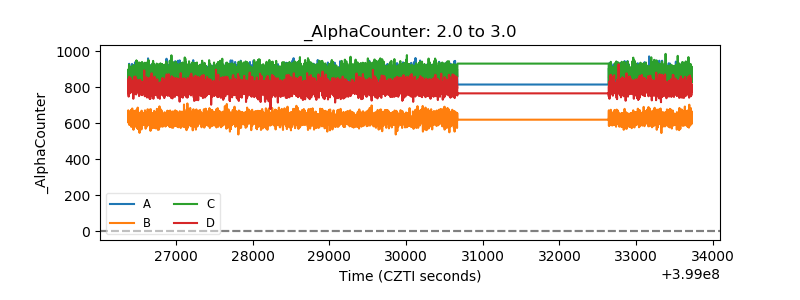 |
| _CPM_Rate | 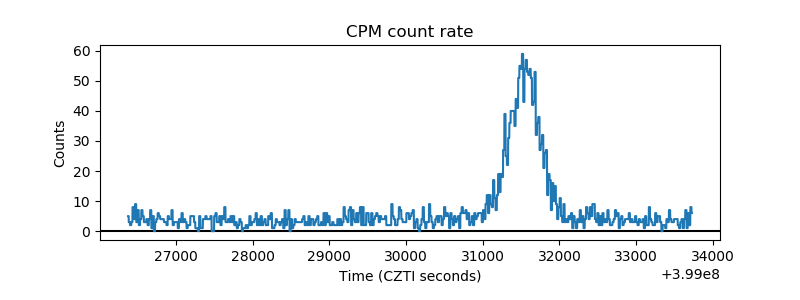 |
| CZT Counter | 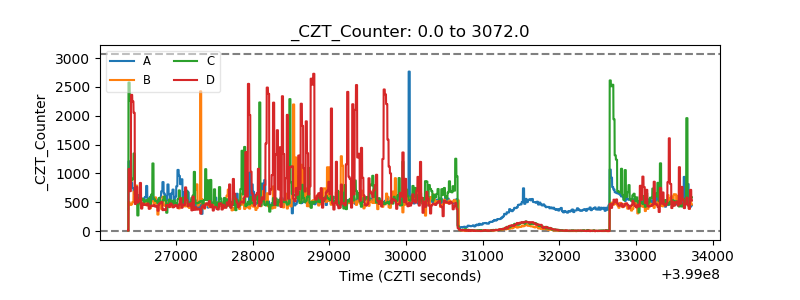 |
| +2.5 Volts monitor |  |
| +5 Volts monitor | 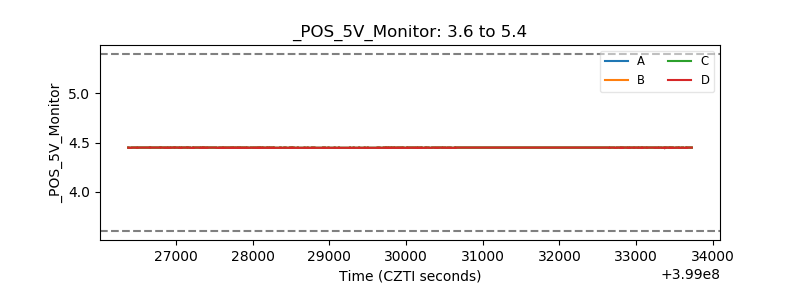 |
| _ROLL_ROT | 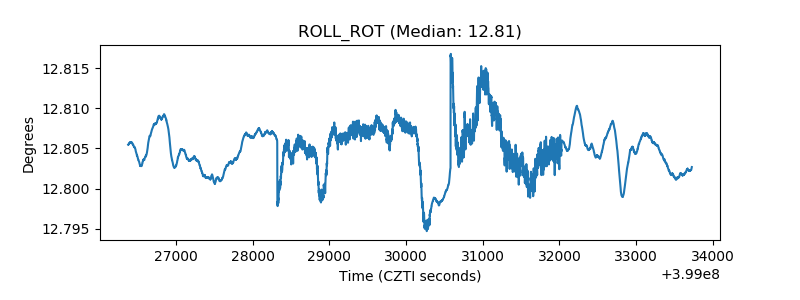 |
| _Roll_DEC |  |
| _Roll_RA | 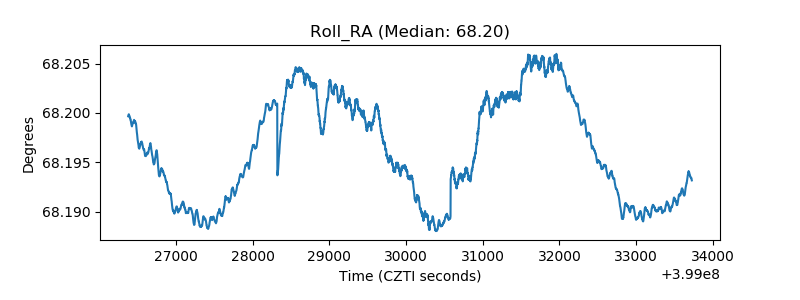 |
| Veto Counter | 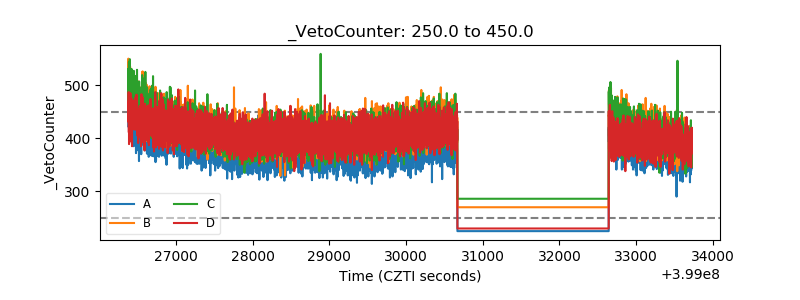 |