| Param | Original file | Final file |
|---|---|---|
| Filename | modeM0/AS1A11_030T02_9000005310_37336cztM0_level2.evt | modeM0/AS1A11_030T02_9000005310_37336cztM0_level2_quad_clean.evt |
| Size (bytes) | 464,325,120 | 54,956,160 |
| Size | 442.8 MB | 52.4 MB |
| Events in quadrant A | 3,029,878 | 324,578 |
| Events in quadrant B | 2,817,339 | 327,684 |
| Events in quadrant C | 3,673,771 | 314,522 |
| Events in quadrant D | 4,158,805 | 303,005 |
| Mode M0 | |||
|---|---|---|---|
| Quadrant | BADHDUFLAG | Total packets | Discarded packets |
| A | 0 | 12359 | 3 |
| B | 0 | 11939 | 2 |
| C | 0 | 14471 | 2 |
| D | 0 | 16150 | 2 |
| Mode SS | |||
|---|---|---|---|
| Quadrant | BADHDUFLAG | Total packets | Discarded packets |
| A | 0 | 114 | 0 |
| B | 0 | 114 | 0 |
| C | 0 | 114 | 0 |
| D | 0 | 114 | 0 |
| Mode M9 | |||
|---|---|---|---|
| Quadrant | BADHDUFLAG | Total packets | Discarded packets |
| A | 0 | 16 | 0 |
| B | 0 | 16 | 0 |
| C | 0 | 16 | 0 |
| D | 0 | 17 | 0 |
| Quadrant | Total seconds | Saturated seconds | Saturation percentage |
|---|---|---|---|
| A | 5634 | 33 | 0.585729% |
| B | 5634 | 41 | 0.727725% |
| C | 5634 | 111 | 1.970181% |
| D | 5634 | 382 | 6.780263% |
Noise dominated data is calculated using 1-second bins in cleaned event files. If a bin has >2000 counts, and if more than 50% of those come from <1% of pixels, then it is considered to be noise-dominated and hence unusable.
| Quadrant | # 1 sec bins | Bins with >0 counts | Bins with >2000 counts | High rate bins dominated by noise | Noise dominated (total time) | Noise dominated (detector-on time) | Marked lightcurve |
|---|---|---|---|---|---|---|---|
| A | 7246 | 5635 | 19 | 19 | 0.26% | 0.34% | 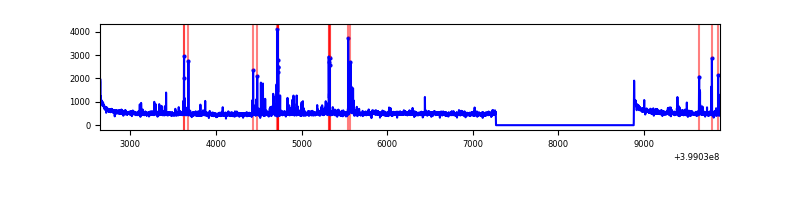 |
| B | 7246 | 5635 | 22 | 22 | 0.30% | 0.39% | 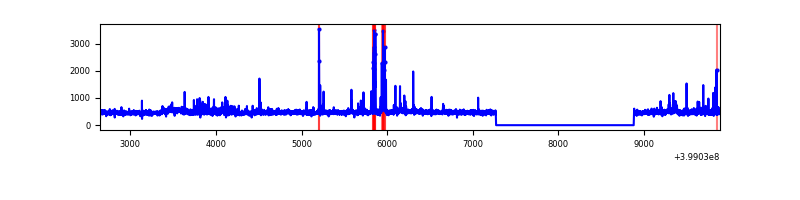 |
| C | 7246 | 5635 | 102 | 102 | 1.41% | 1.81% | 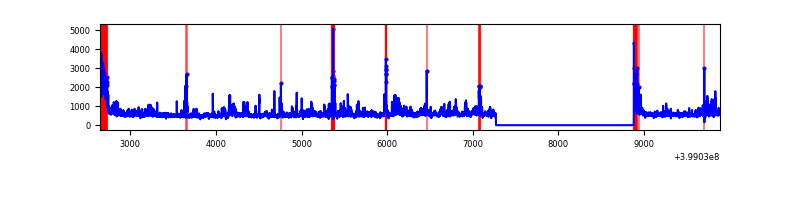 |
| D | 7246 | 5635 | 339 | 339 | 4.68% | 6.02% | 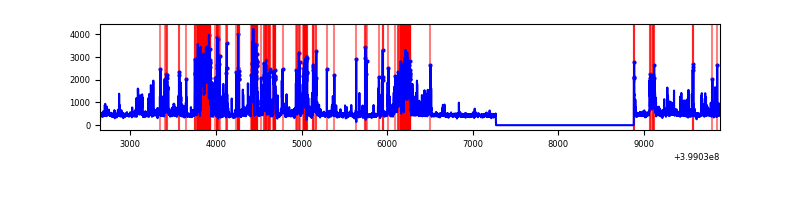 |
Top three noisy pixels from each quadrant. If the there are fewer than three noisy pixels in the level2.evt file, extra rows are filled as -1
| Pixel properties | Quadrant properties | ||||||
|---|---|---|---|---|---|---|---|
| Quadrant | DetID | PixID | Counts | Sigma | Mean | Median | Sigma |
| A | 10 | 83 | 290101 | 2179.58 | 649 | 636 | 132.8 |
| A | 13 | 248 | 159256 | 1194.36 | 649 | 636 | 132.8 |
| A | 7 | 3 | 31831 | 234.89 | 649 | 636 | 132.8 |
| B | 5 | 172 | 134084 | 1084.21 | 643 | 625 | 123.1 |
| B | 0 | 190 | 104069 | 840.37 | 643 | 625 | 123.1 |
| B | 12 | 111 | 15458 | 120.5 | 643 | 625 | 123.1 |
| C | 1 | 23 | 541360 | 3690.42 | 626 | 629 | 146.5 |
| C | 0 | 10 | 244699 | 1665.75 | 626 | 629 | 146.5 |
| C | 15 | 214 | 237474 | 1616.44 | 626 | 629 | 146.5 |
| D | 10 | 253 | 1054146 | 6879.62 | 619 | 600 | 153.1 |
| D | 2 | 249 | 363598 | 2370.36 | 619 | 600 | 153.1 |
| D | 5 | 32 | 143929 | 935.93 | 619 | 600 | 153.1 |
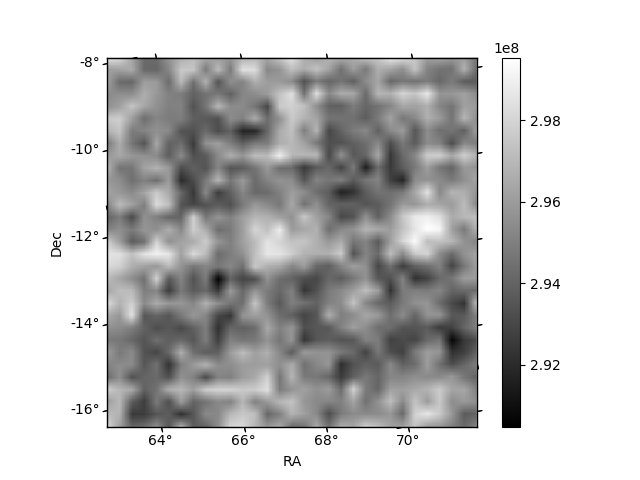
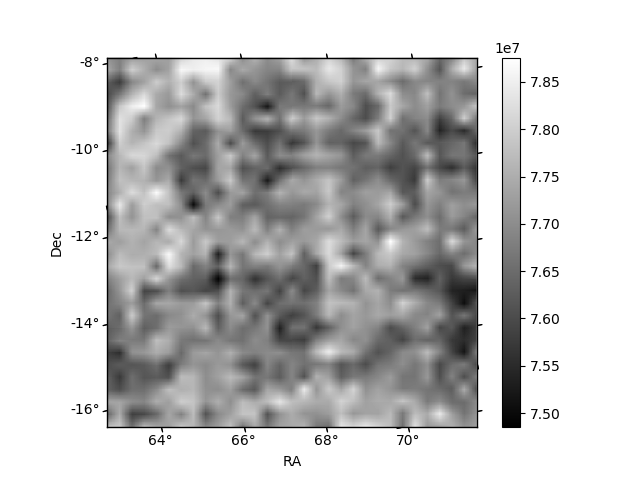
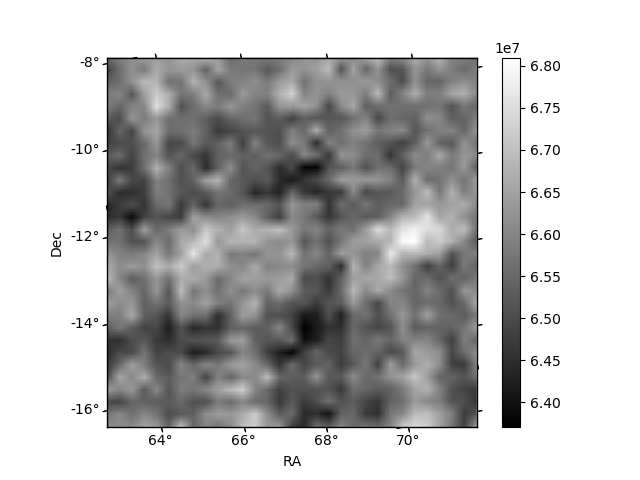
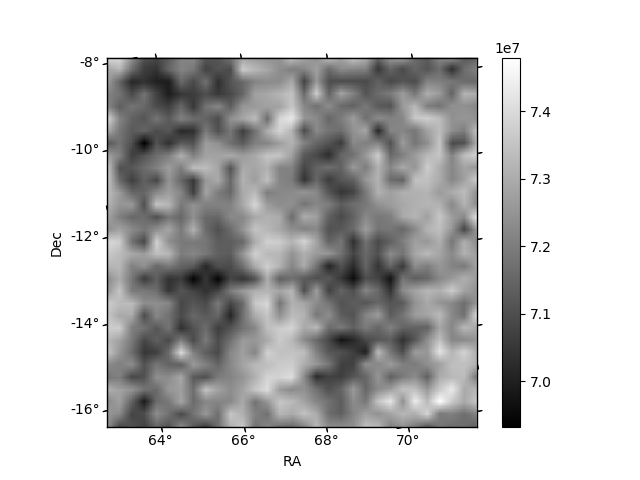
Histogram calculated using DETX and DETY for each event in the final _common_clean file
| Quadrant A | 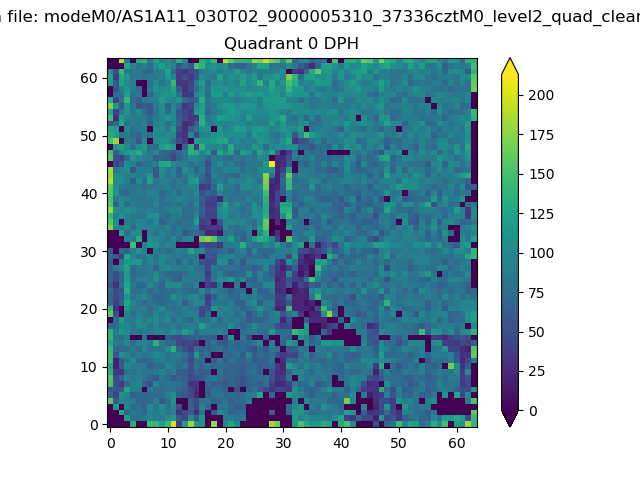 |
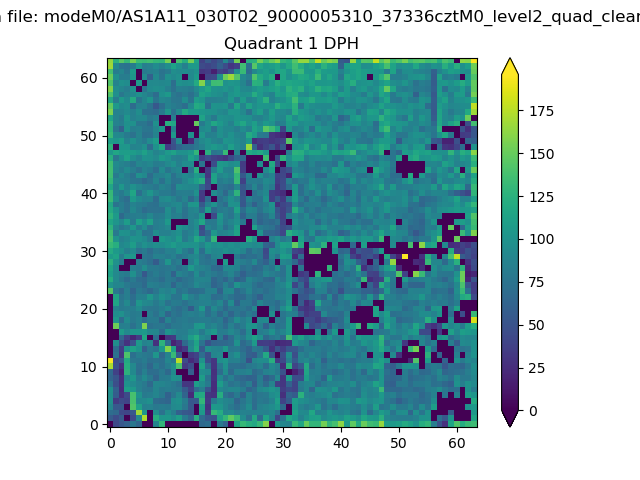 |
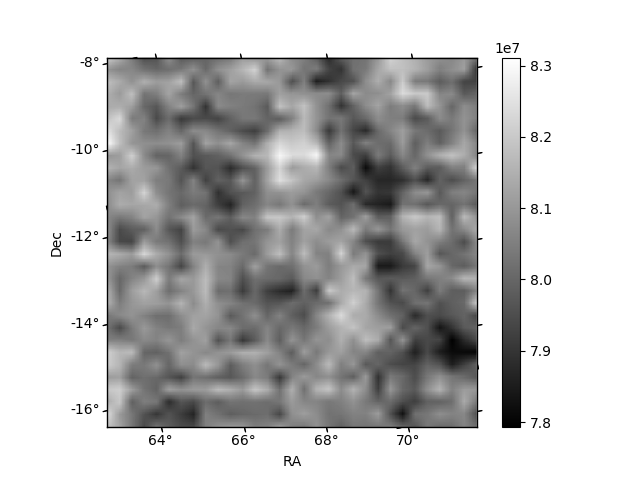
Quadrant B |
|---|---|---|---|
| Quadrant D | 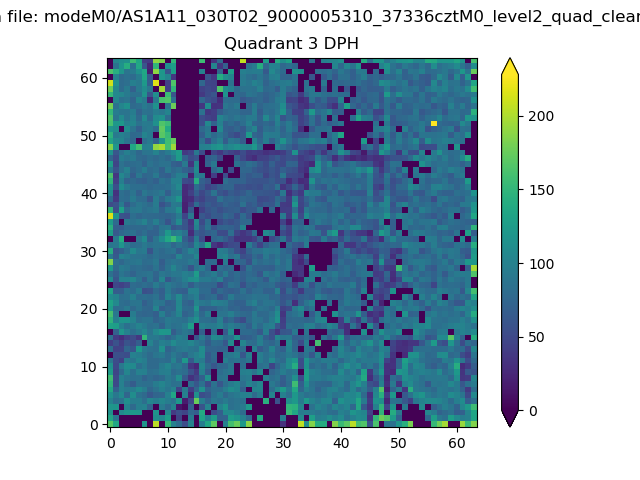 |
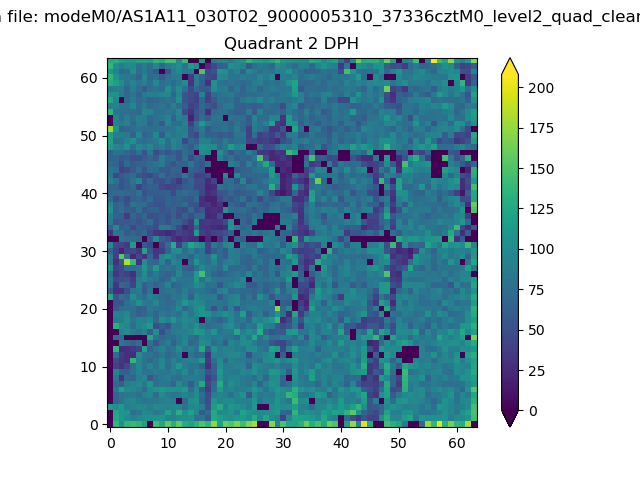 |
Quadrant C |
| Plot type | Count rate plots | Images |
|---|---|---|
| Comparison with Poisson distribution Blue bars denote a histogram of data divided into 1 sec bins. Red curve is a Poisson curve with rate = median count rate of data. |
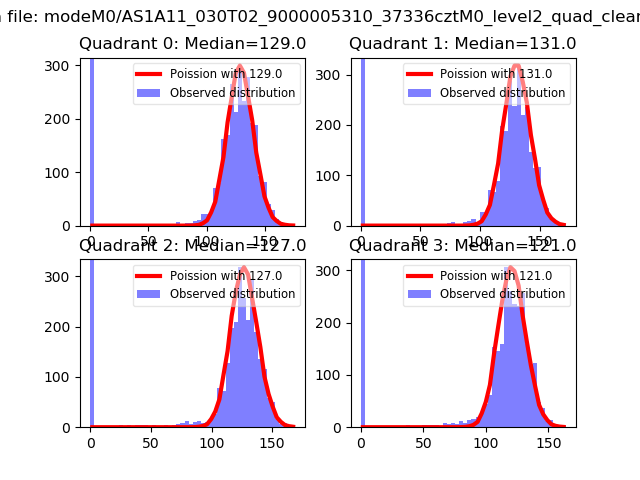 |
 |
| Quadrant-wise count rates Data is divided into 100 sec bins |
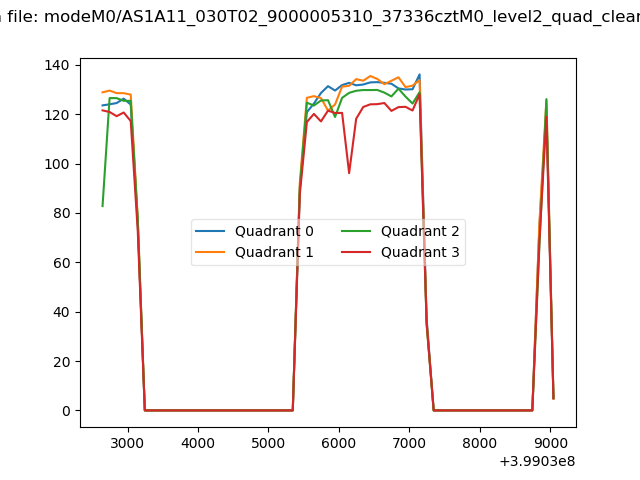 |
|
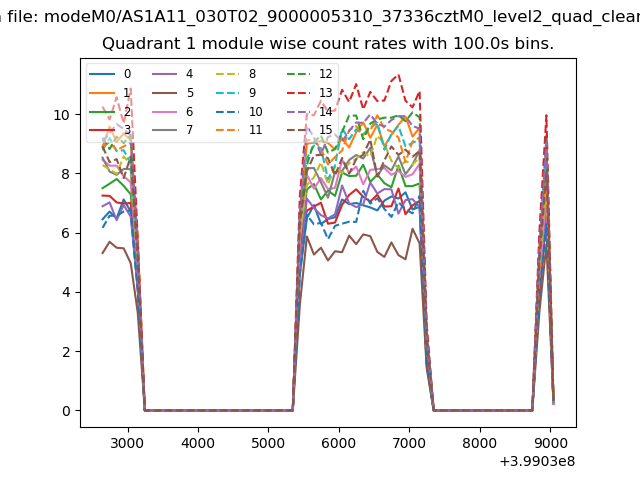
| Module-wise count rates for Quadrant A Data is divided into 100 sec bins |
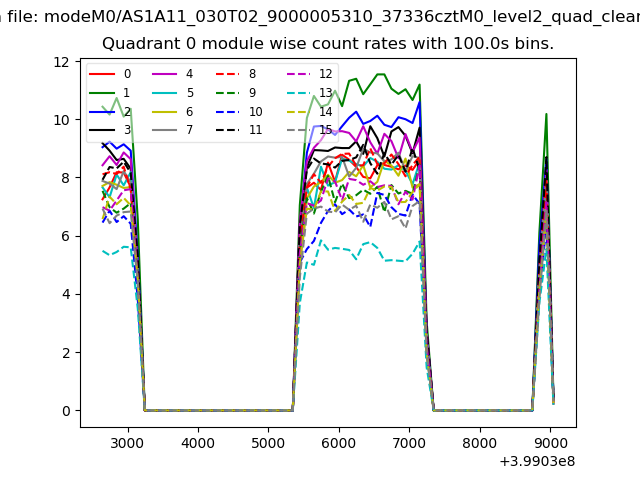 |
 |
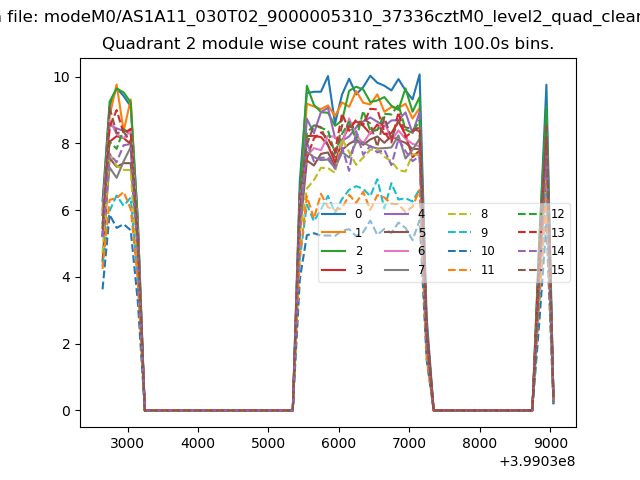
| Module-wise count rates for Quadrant B Data is divided into 100 sec bins |
 |
 |
| Module-wise count rates for Quadrant C Data is divided into 100 sec bins |
 |
 |
| Module-wise count rates for Quadrant D Data is divided into 100 sec bins |
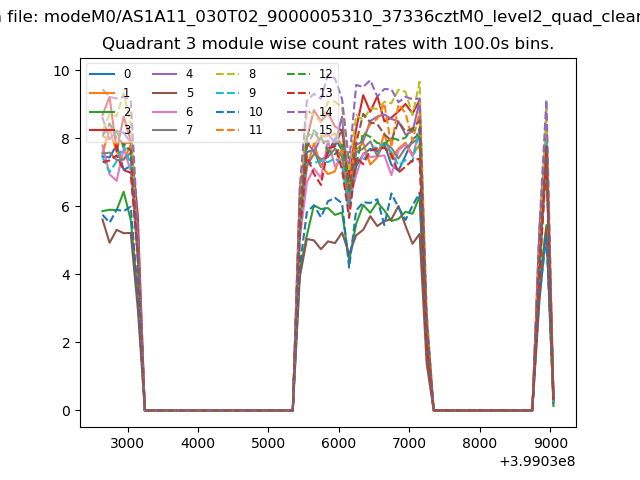 |
 |
| Parameter | Plot |
|---|---|
| CZT HV Monitor | 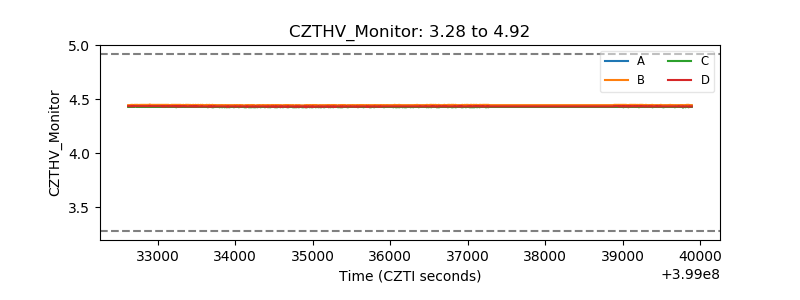 |
| D_VDD | 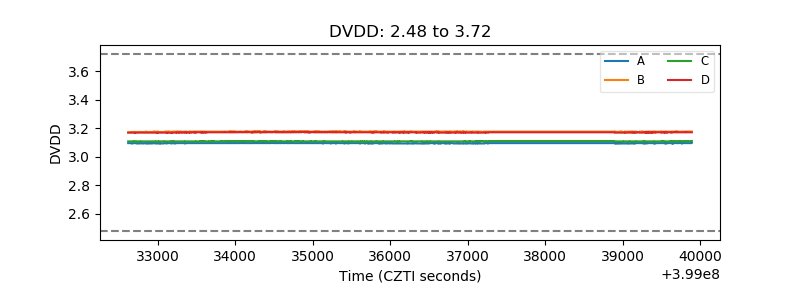 |
| Temperature 1 | 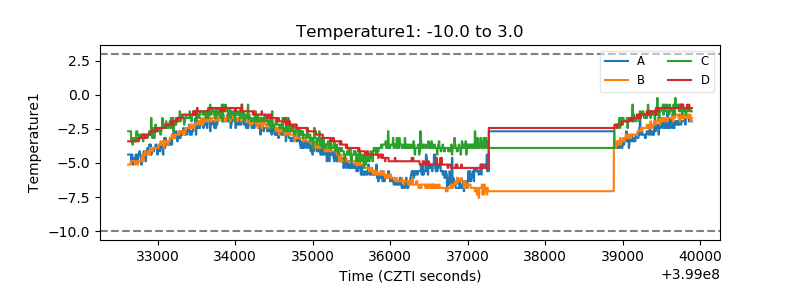 |
| Veto HV Monitor | 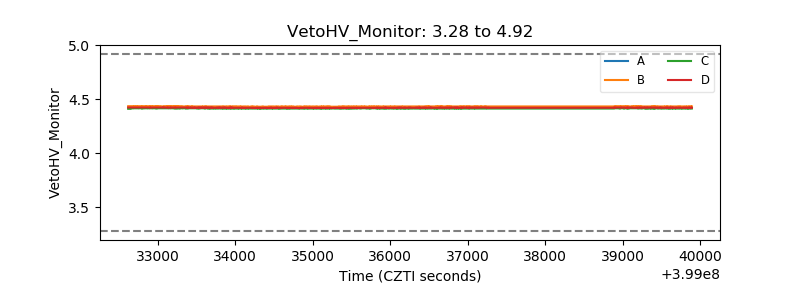 |
| Veto LLD | 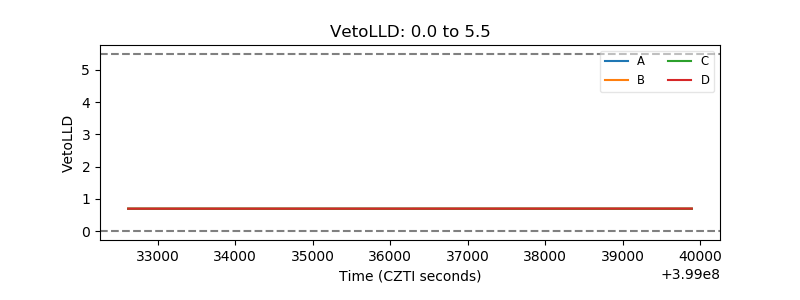 |
| Alpha Counter | 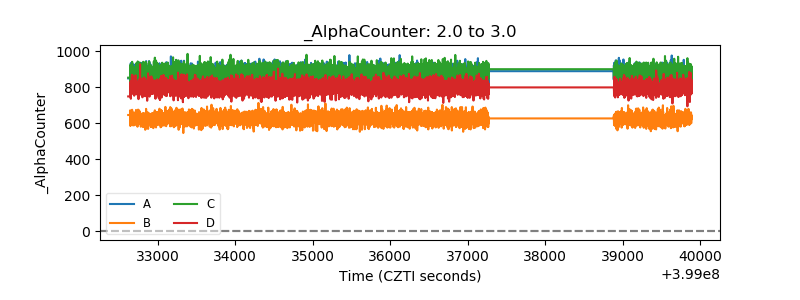 |
| _CPM_Rate | 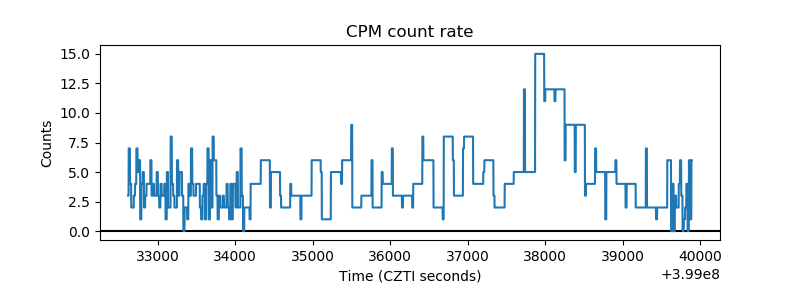 |
| CZT Counter | 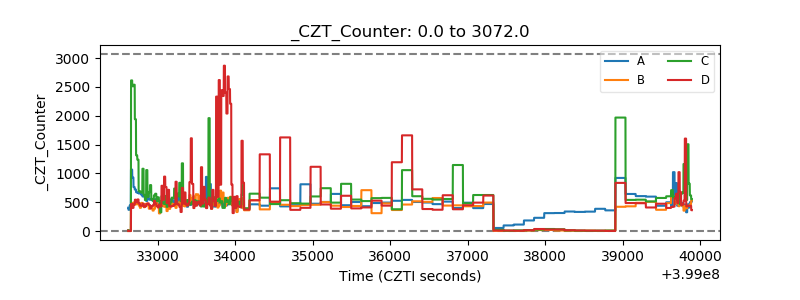 |
| +2.5 Volts monitor | 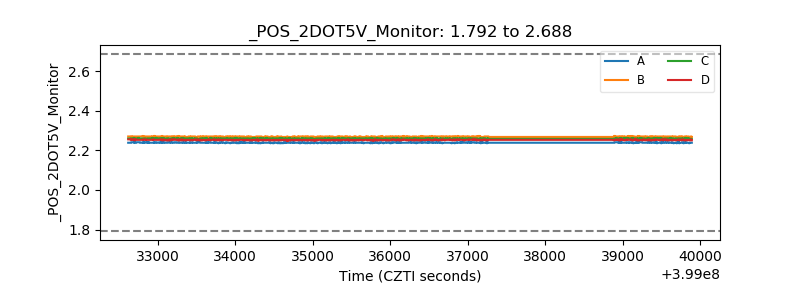 |
| +5 Volts monitor | 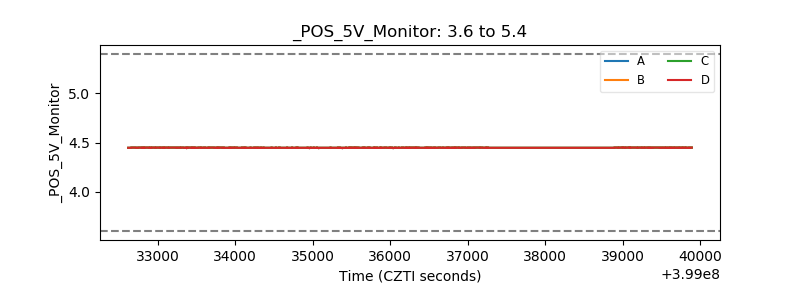 |
| _ROLL_ROT | 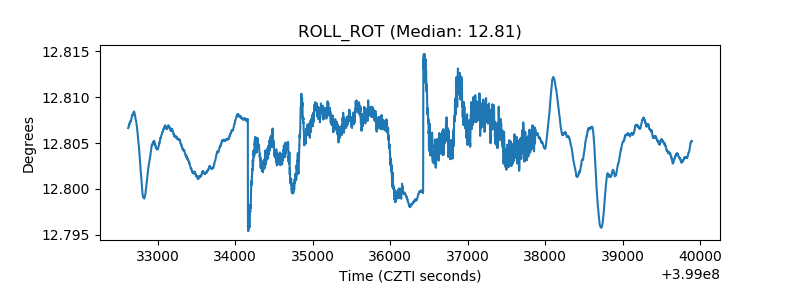 |
| _Roll_DEC | 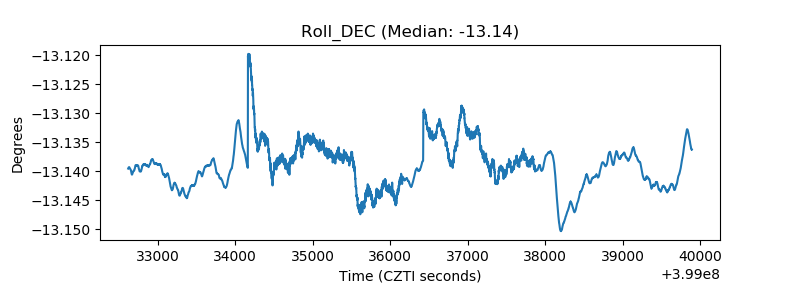 |
| _Roll_RA | 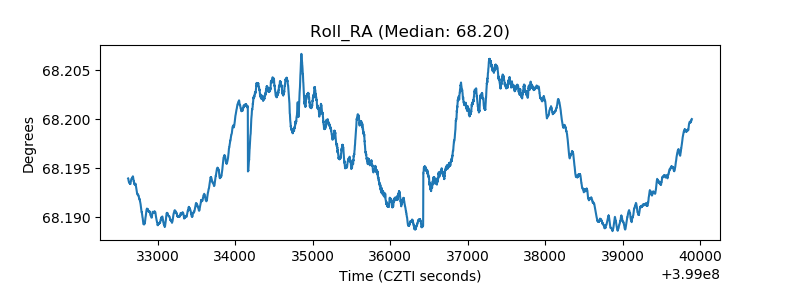 |
| Veto Counter | 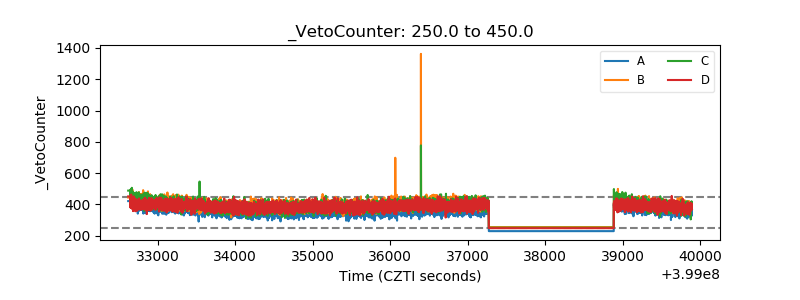 |