| Param | Original file | Final file |
|---|---|---|
| Filename | modeM0/AS1A11_030T02_9000005310_37337cztM0_level2.evt | modeM0/AS1A11_030T02_9000005310_37337cztM0_level2_quad_clean.evt |
| Size (bytes) | 274,322,880 | 26,991,360 |
| Size | 261.6 MB | 25.7 MB |
| Events in quadrant A | 1,761,163 | 148,003 |
| Events in quadrant B | 1,669,805 | 149,720 |
| Events in quadrant C | 2,134,082 | 144,204 |
| Events in quadrant D | 2,506,618 | 129,615 |
| Mode M0 | |||
|---|---|---|---|
| Quadrant | BADHDUFLAG | Total packets | Discarded packets |
| A | 0 | 7365 | 1 |
| B | 0 | 7219 | 1 |
| C | 0 | 8449 | 1 |
| D | 0 | 9704 | 1 |
| Mode SS | |||
|---|---|---|---|
| Quadrant | BADHDUFLAG | Total packets | Discarded packets |
| A | 0 | 70 | 0 |
| B | 0 | 70 | 0 |
| C | 0 | 70 | 0 |
| D | 0 | 70 | 0 |
| Mode M9 | |||
|---|---|---|---|
| Quadrant | BADHDUFLAG | Total packets | Discarded packets |
| A | 0 | 10 | 0 |
| B | 0 | 10 | 0 |
| C | 0 | 10 | 0 |
| D | 0 | 11 | 0 |
| Quadrant | Total seconds | Saturated seconds | Saturation percentage |
|---|---|---|---|
| A | 3454 | 12 | 0.347423% |
| B | 3454 | 6 | 0.173712% |
| C | 3454 | 26 | 0.752750% |
| D | 3454 | 174 | 5.037638% |
Noise dominated data is calculated using 1-second bins in cleaned event files. If a bin has >2000 counts, and if more than 50% of those come from <1% of pixels, then it is considered to be noise-dominated and hence unusable.
| Quadrant | # 1 sec bins | Bins with >0 counts | Bins with >2000 counts | High rate bins dominated by noise | Noise dominated (total time) | Noise dominated (detector-on time) | Marked lightcurve |
|---|---|---|---|---|---|---|---|
| A | 3454 | 3454 | 6 | 6 | 0.17% | 0.17% | 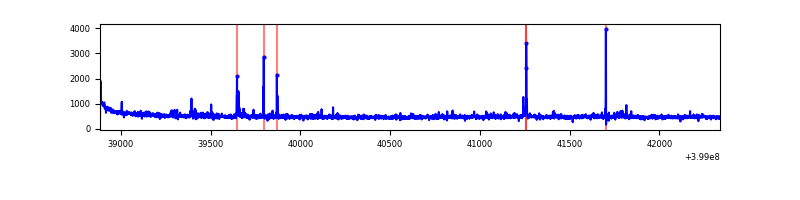 |
| B | 3454 | 3454 | 2 | 2 | 0.06% | 0.06% | 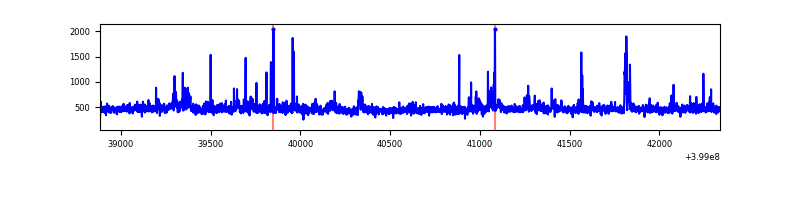 |
| C | 3454 | 3454 | 21 | 21 | 0.61% | 0.61% | 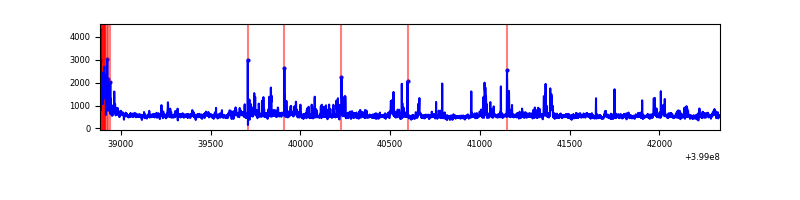 |
| D | 3454 | 3454 | 154 | 154 | 4.46% | 4.46% | 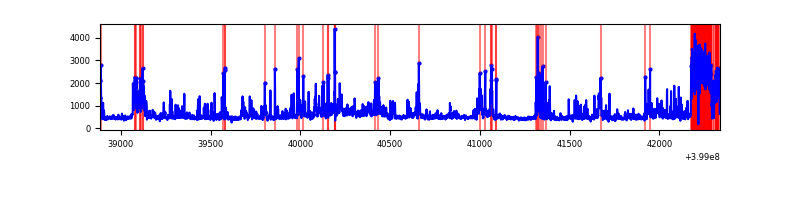 |
Top three noisy pixels from each quadrant. If the there are fewer than three noisy pixels in the level2.evt file, extra rows are filled as -1
| Pixel properties | Quadrant properties | ||||||
|---|---|---|---|---|---|---|---|
| Quadrant | DetID | PixID | Counts | Sigma | Mean | Median | Sigma |
| A | 10 | 83 | 165221 | 2042.67 | 391 | 384 | 80.7 |
| A | 13 | 248 | 33986 | 416.4 | 391 | 384 | 80.7 |
| A | 9 | 143 | 31335 | 383.55 | 391 | 384 | 80.7 |
| B | 0 | 190 | 43233 | 564.93 | 388 | 378 | 75.9 |
| B | 4 | 171 | 24336 | 315.82 | 388 | 378 | 75.9 |
| B | 5 | 172 | 19301 | 249.45 | 388 | 378 | 75.9 |
| C | 1 | 23 | 345485 | 3849.97 | 378 | 380 | 89.6 |
| C | 15 | 214 | 144555 | 1608.41 | 378 | 380 | 89.6 |
| C | 14 | 254 | 80001 | 888.25 | 378 | 380 | 89.6 |
| D | 10 | 253 | 404932 | 4392.01 | 373 | 363 | 92.1 |
| D | 2 | 249 | 276992 | 3003.09 | 373 | 363 | 92.1 |
| D | 12 | 235 | 176028 | 1907.02 | 373 | 363 | 92.1 |
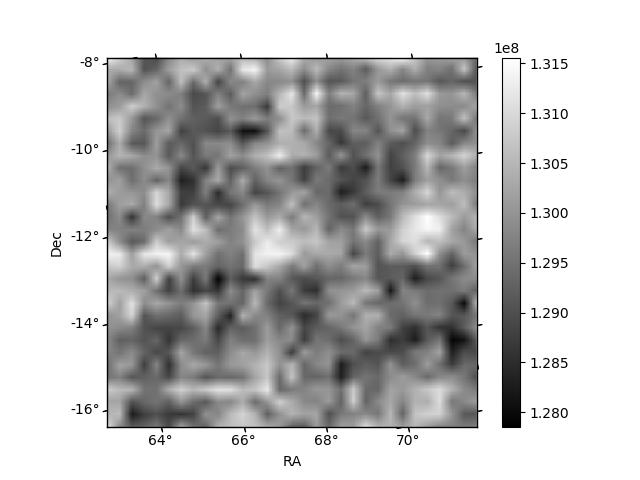
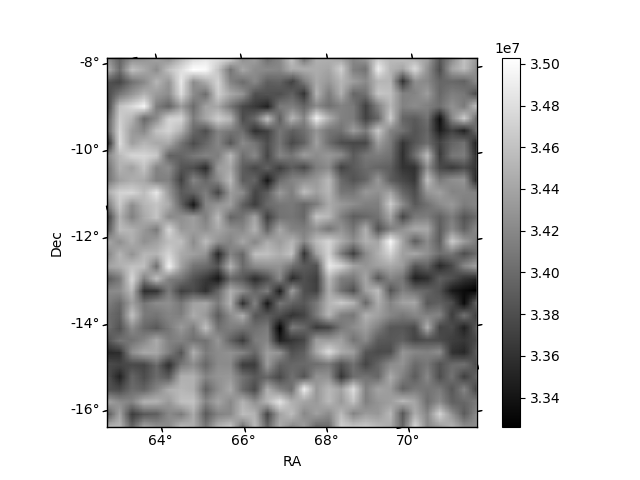
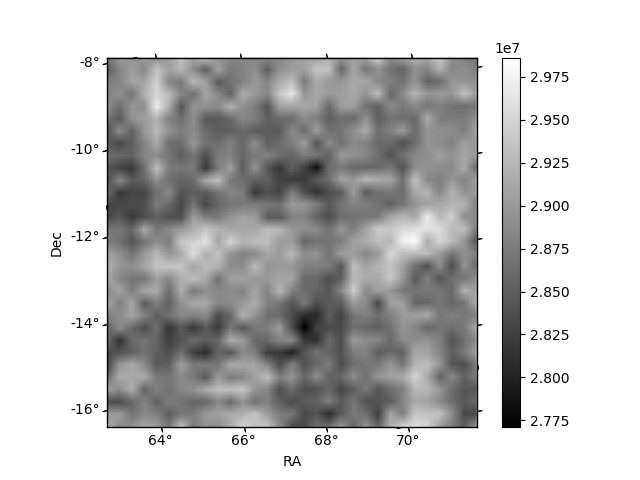
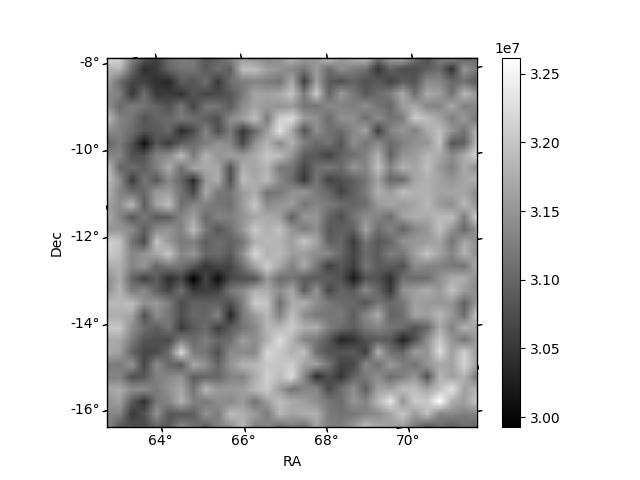
Histogram calculated using DETX and DETY for each event in the final _common_clean file
| Quadrant A | 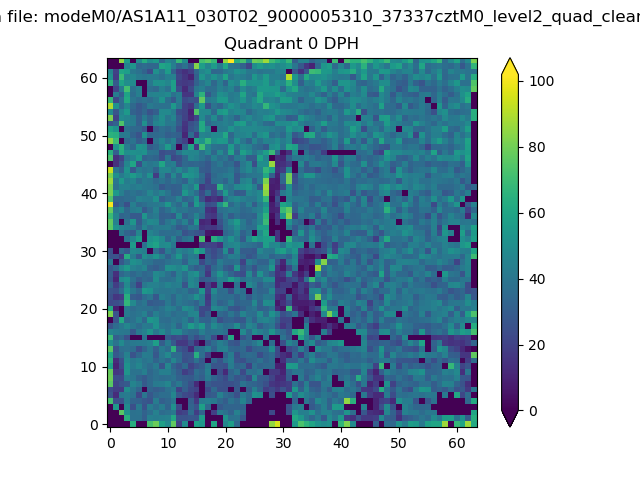 |
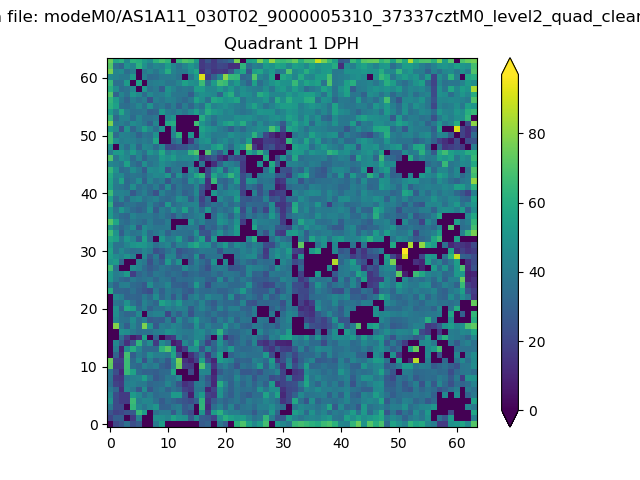 |
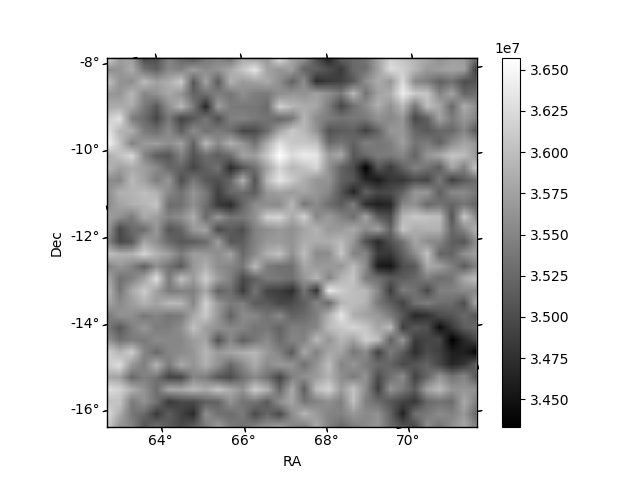
Quadrant B |
|---|---|---|---|
| Quadrant D | 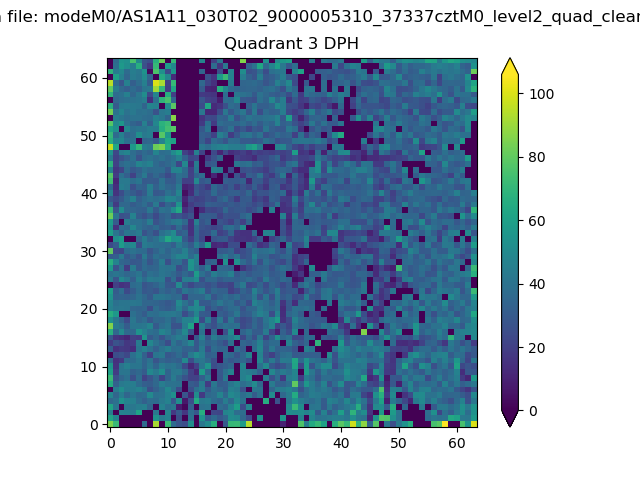 |
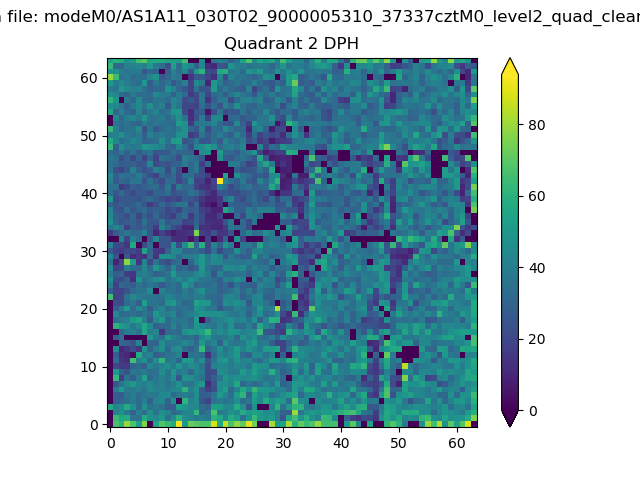 |
Quadrant C |
| Plot type | Count rate plots | Images |
|---|---|---|
| Comparison with Poisson distribution Blue bars denote a histogram of data divided into 1 sec bins. Red curve is a Poisson curve with rate = median count rate of data. |
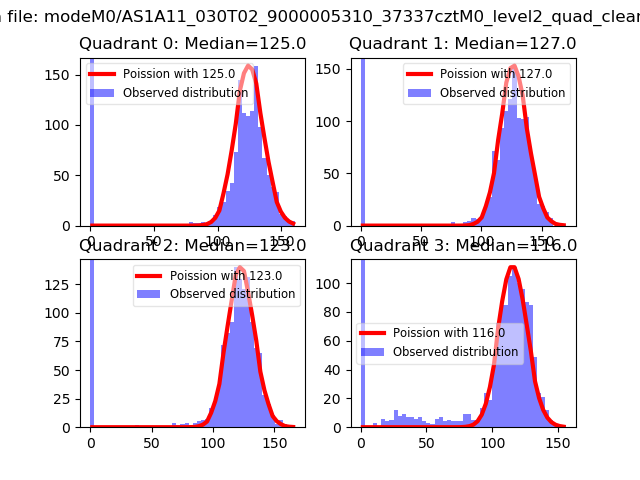 |
 |
| Quadrant-wise count rates Data is divided into 100 sec bins |
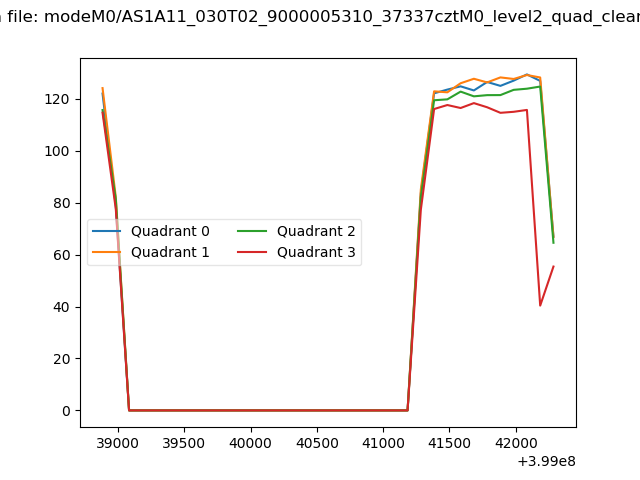 |
|
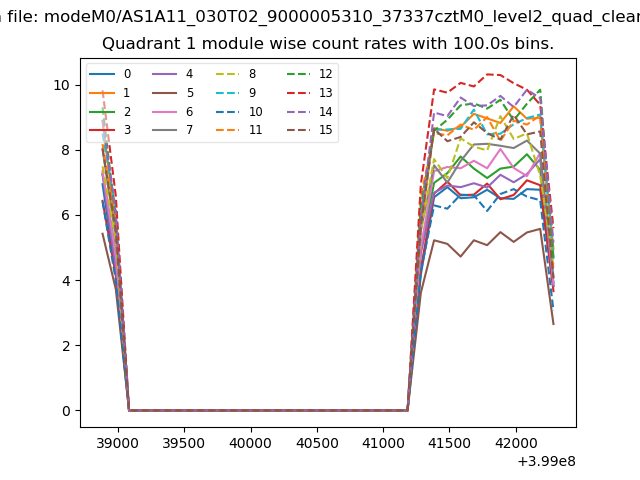
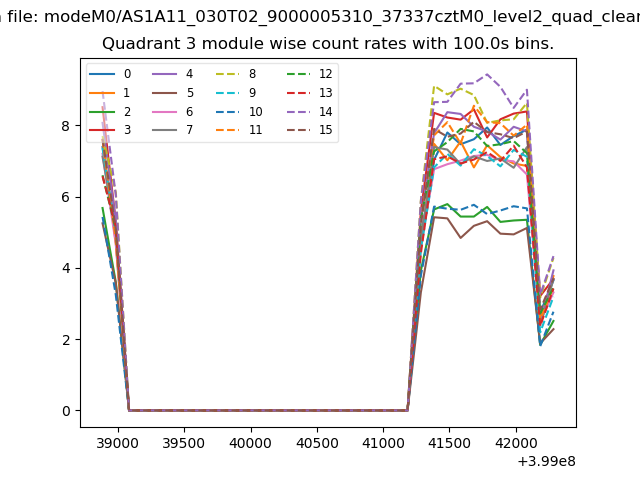
| Module-wise count rates for Quadrant A Data is divided into 100 sec bins |
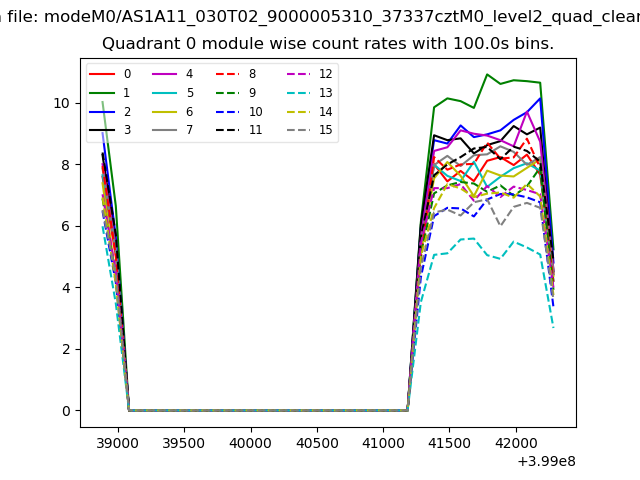 |
 |
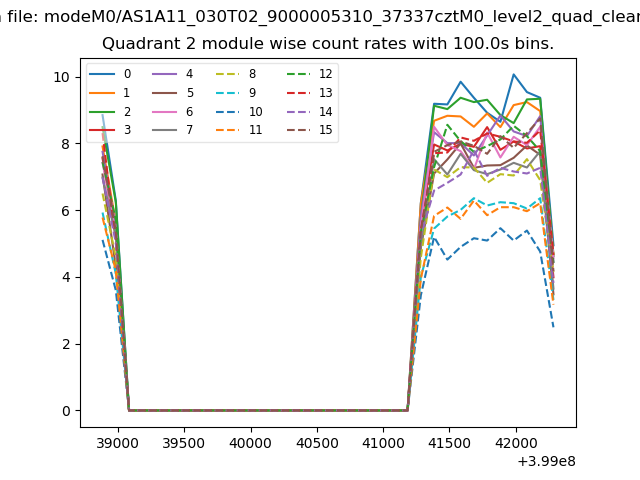
| Module-wise count rates for Quadrant B Data is divided into 100 sec bins |
 |
 |
| Module-wise count rates for Quadrant C Data is divided into 100 sec bins |
 |
 |
| Module-wise count rates for Quadrant D Data is divided into 100 sec bins |
 |
 |
| Parameter | Plot |
|---|---|
| CZT HV Monitor | 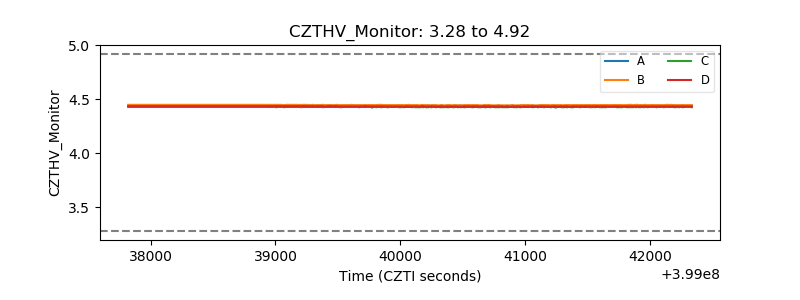 |
| D_VDD | 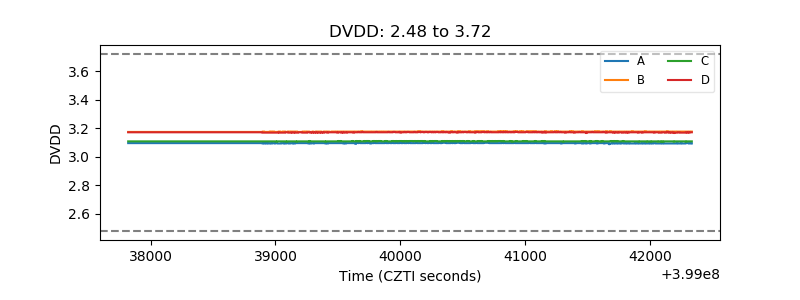 |
| Temperature 1 | 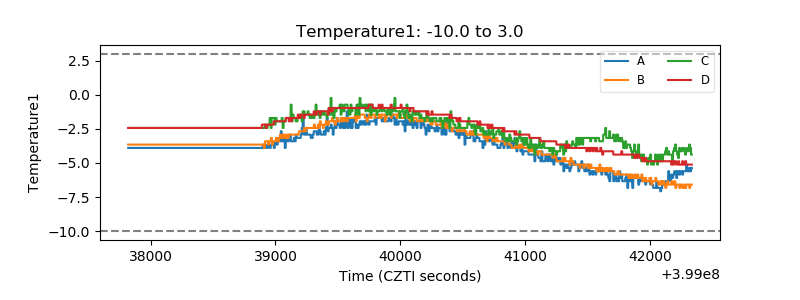 |
| Veto HV Monitor | 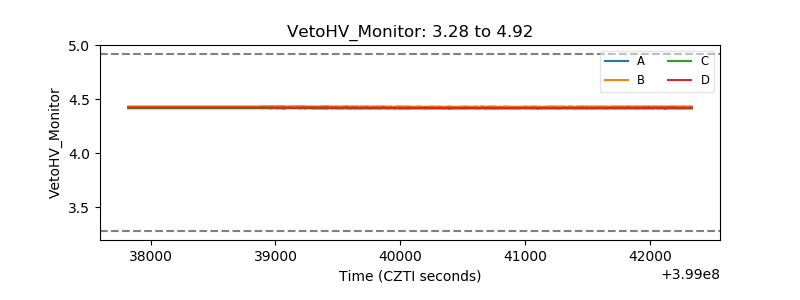 |
| Veto LLD | 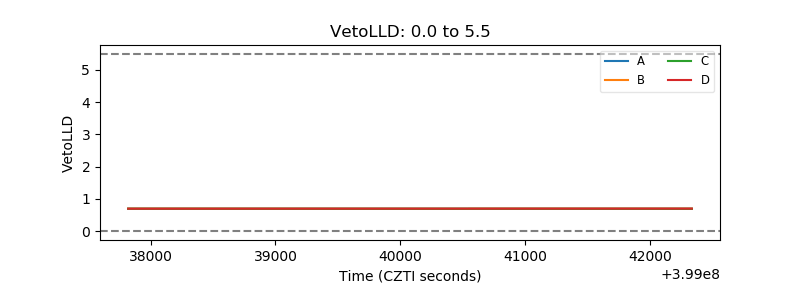 |
| Alpha Counter | 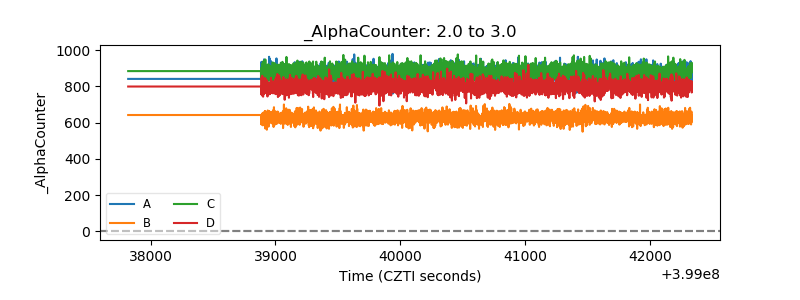 |
| _CPM_Rate | 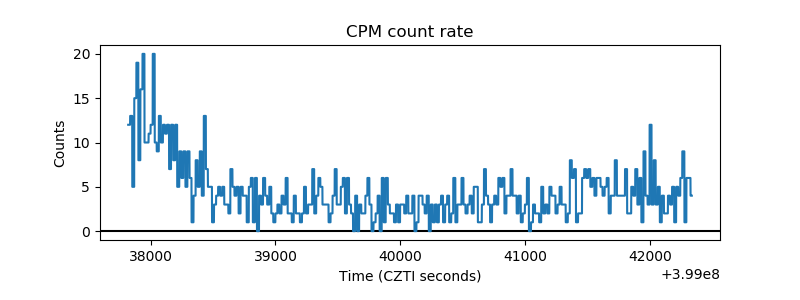 |
| CZT Counter | 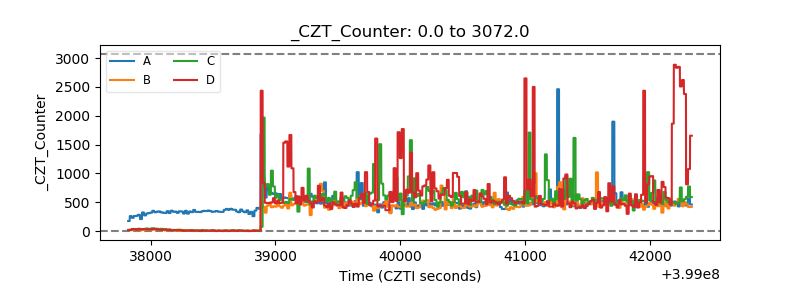 |
| +2.5 Volts monitor | 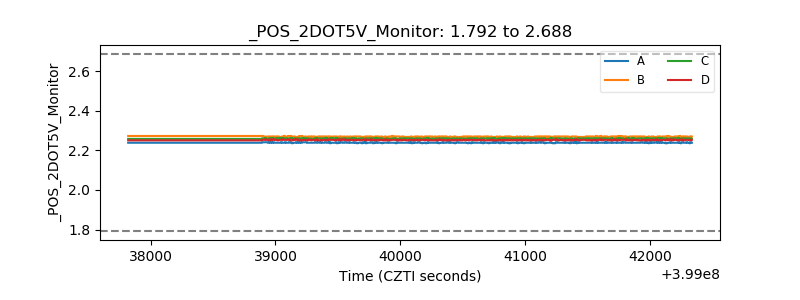 |
| +5 Volts monitor | 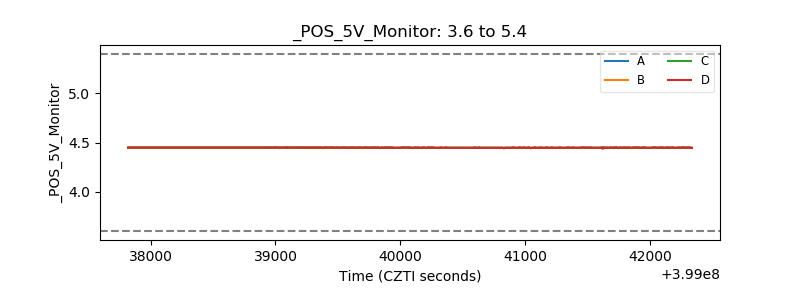 |
| _ROLL_ROT | 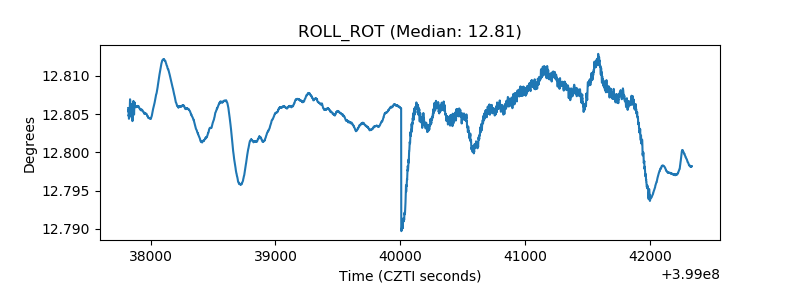 |
| _Roll_DEC | 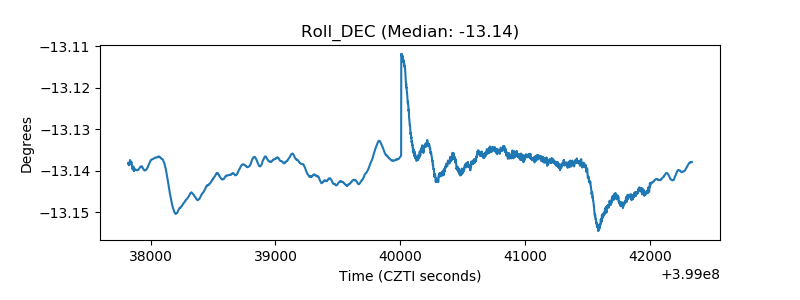 |
| _Roll_RA | 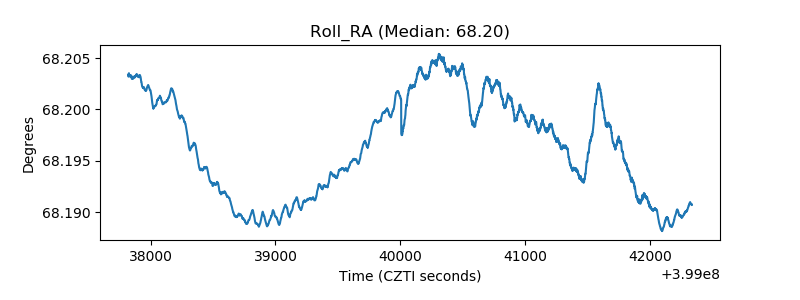 |
| Veto Counter | 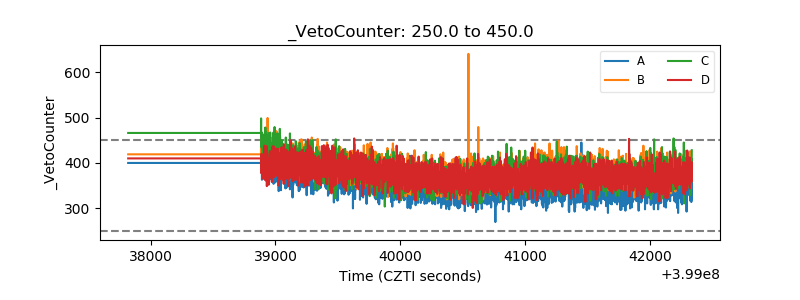 |