| Param | Original file | Final file |
|---|---|---|
| Filename | modeM0/AS1A10_094T15_9000005312cztM0_level2.fits | modeM0/AS1A10_094T15_9000005312cztM0_level2_quad_clean.evt |
| Size (bytes) | 30,994,560 | 19,396,800 |
| Size | 29.6 MB | 18.5 MB |
| Events in quadrant A | 183,448 | 89,058 |
| Events in quadrant B | 175,848 | 88,809 |
| Events in quadrant C | 179,780 | 85,189 |
| Events in quadrant D | 153,762 | 77,107 |
| Mode M0 | |||
|---|---|---|---|
| Quadrant | BADHDUFLAG | Total packets | Discarded packets |
| A | 0 | 7338 | 0 |
| B | 0 | 7156 | 0 |
| C | 0 | 7776 | 0 |
| D | 0 | 9691 | 0 |
| Mode M9 | |||
|---|---|---|---|
| Quadrant | BADHDUFLAG | Total packets | Discarded packets |
| A | 0 | 14 | 0 |
| B | 0 | 14 | 0 |
| C | 0 | 14 | 0 |
| D | 0 | 14 | 0 |
| Mode SS | |||
|---|---|---|---|
| Quadrant | BADHDUFLAG | Total packets | Discarded packets |
| A | 0 | 70 | 0 |
| B | 0 | 70 | 0 |
| C | 0 | 70 | 0 |
| D | 0 | 70 | 0 |
| Quadrant | Total seconds | Saturated seconds | Saturation percentage |
|---|---|---|---|
| A | 3479 | 14 | 0.402414% |
| B | 3476 | 7 | 0.201381% |
| C | 3476 | 44 | 1.265823% |
| D | 3476 | 130 | 3.739931% |
Noise dominated data is calculated using 1-second bins in cleaned event files. If a bin has >2000 counts, and if more than 50% of those come from <1% of pixels, then it is considered to be noise-dominated and hence unusable.
| Quadrant | # 1 sec bins | Bins with >0 counts | Bins with >2000 counts | High rate bins dominated by noise | Noise dominated (total time) | Noise dominated (detector-on time) | Marked lightcurve |
|---|---|---|---|---|---|---|---|
| A | 4822 | 3479 | 0 | 0 | 0.00% | 0.00% | 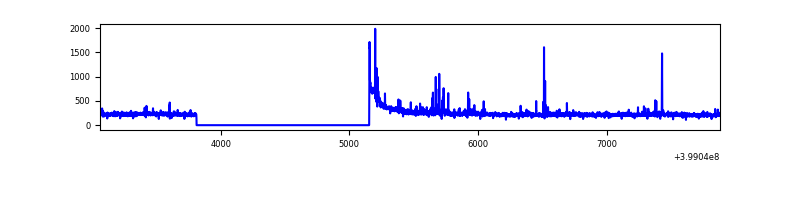 |
| B | 4822 | 3478 | 0 | 0 | 0.00% | 0.00% | 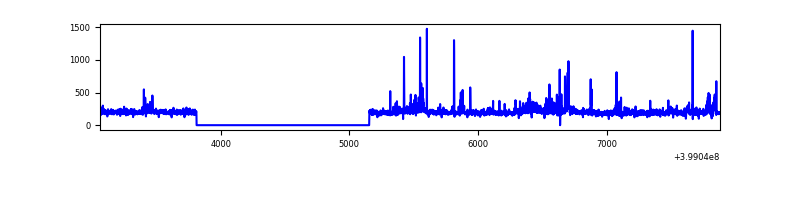 |
| C | 4822 | 3478 | 0 | 0 | 0.00% | 0.00% |  |
| D | 4822 | 3478 | 0 | 0 | 0.00% | 0.00% | 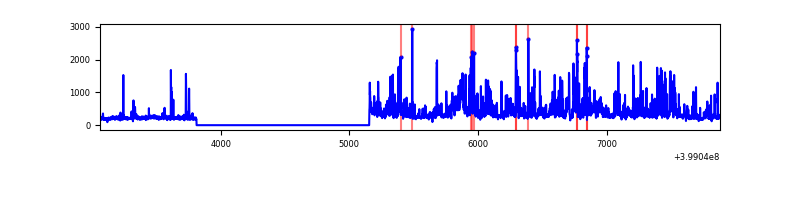 |
Top three noisy pixels from each quadrant. If the there are fewer than three noisy pixels in the level2.evt file, extra rows are filled as -1
| Pixel properties | Quadrant properties | ||||||
|---|---|---|---|---|---|---|---|
| Quadrant | DetID | PixID | Counts | Sigma | Mean | Median | Sigma |
| A | 9 | 19 | 168 | 8.93 | 47 | 45 | 13.8 |
| A | 7 | 110 | 153 | 7.84 | 47 | 45 | 13.8 |
| A | 0 | 29 | 141 | 6.97 | 47 | 45 | 13.8 |
| B | 2 | 9 | 148 | 9.09 | 46 | 44 | 11.4 |
| B | 2 | 8 | 145 | 8.83 | 46 | 44 | 11.4 |
| B | 3 | 80 | 134 | 7.87 | 46 | 44 | 11.4 |
| C | 1 | 81 | 149 | 7.55 | 47 | 45 | 13.8 |
| C | 3 | 203 | 143 | 7.12 | 47 | 45 | 13.8 |
| C | 1 | 80 | 141 | 6.97 | 47 | 45 | 13.8 |
| D | 10 | 113 | 133 | 7.1 | 43 | 40 | 13.1 |
| D | 6 | 83 | 125 | 6.49 | 43 | 40 | 13.1 |
| D | 7 | 3 | 120 | 6.11 | 43 | 40 | 13.1 |
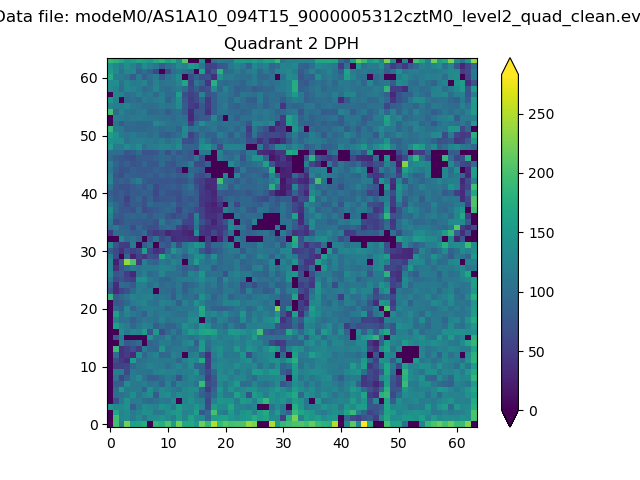
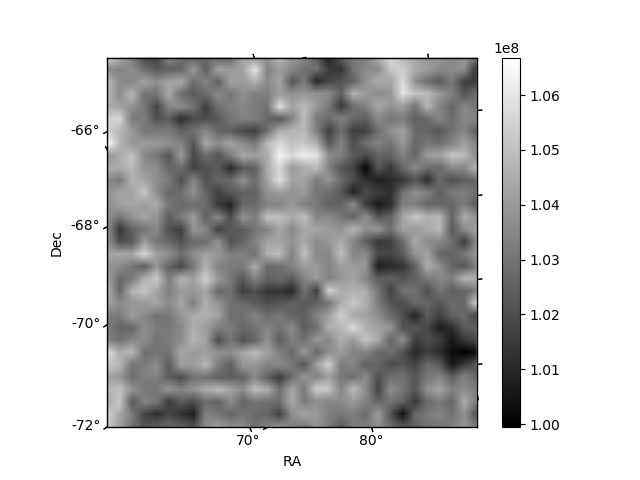
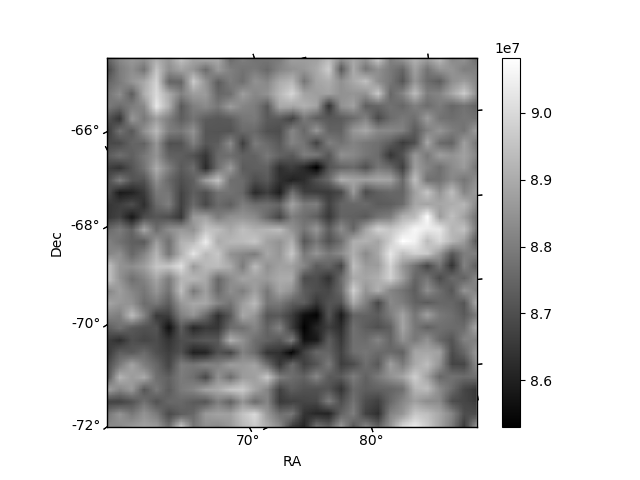
Histogram calculated using DETX and DETY for each event in the final _common_clean file
| Quadrant A | 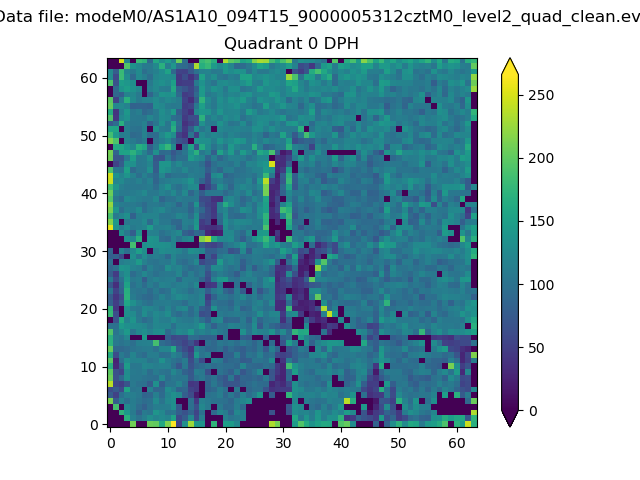 |
 |
Quadrant B |
|---|---|---|---|
| Quadrant D | 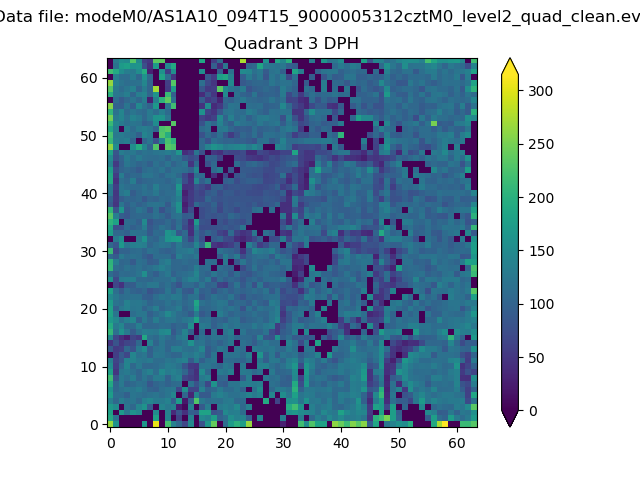 |
 |
Quadrant C |
| Plot type | Count rate plots | Images |
|---|---|---|
| Comparison with Poisson distribution Blue bars denote a histogram of data divided into 1 sec bins. Red curve is a Poisson curve with rate = median count rate of data. |
 |
 |
| Quadrant-wise count rates Data is divided into 100 sec bins |
 |
|
| Module-wise count rates for Quadrant A Data is divided into 100 sec bins |
 |
 |
| Module-wise count rates for Quadrant B Data is divided into 100 sec bins |
 |
 |
| Module-wise count rates for Quadrant C Data is divided into 100 sec bins |
 |
 |
| Module-wise count rates for Quadrant D Data is divided into 100 sec bins |
 |
 |
| Parameter | Plot |
|---|---|
| CZT HV Monitor |  |
| D_VDD | 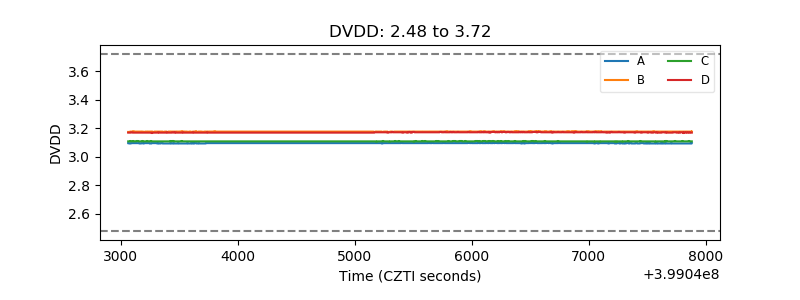 |
| Temperature 1 |  |
| Veto HV Monitor |  |
| Veto LLD |  |
| Alpha Counter |  |
| _CPM_Rate | 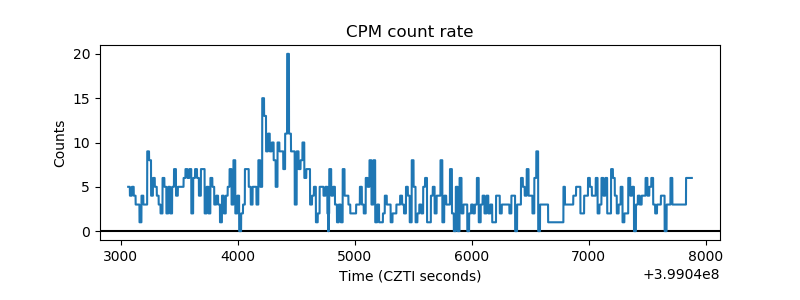 |
| CZT Counter | 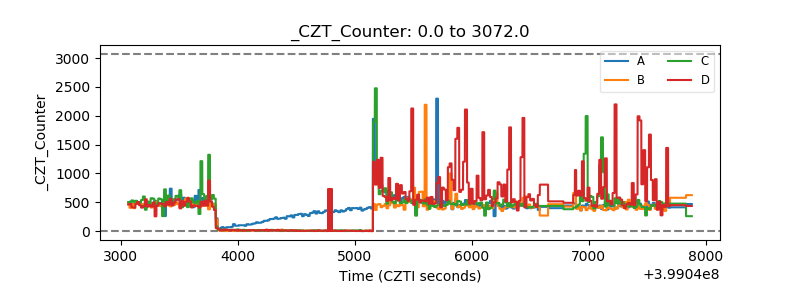 |
| +2.5 Volts monitor |  |
| +5 Volts monitor |  |
| _ROLL_ROT | 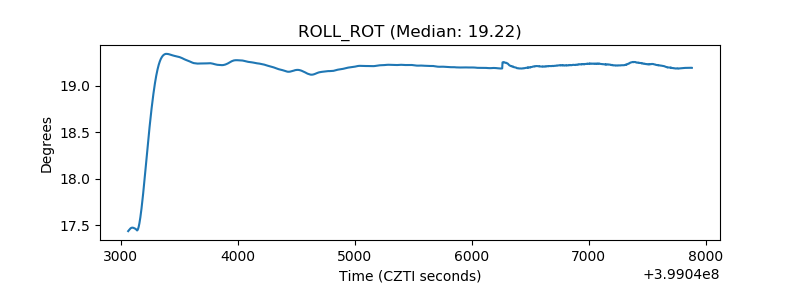 |
| _Roll_DEC | 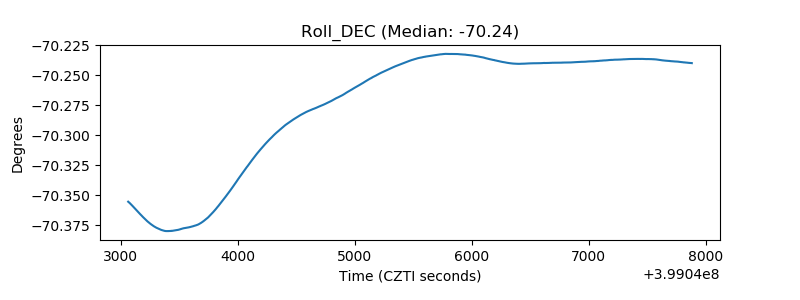 |
| _Roll_RA | 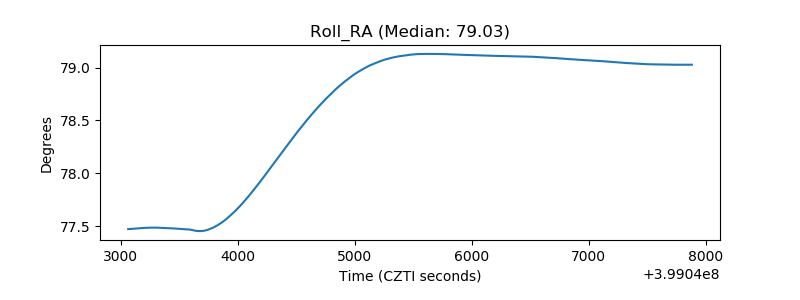 |
| Veto Counter |  |