| Param | Original file | Final file |
|---|---|---|
| Filename | modeM0/AS1A10_094T15_9000005312_37337cztM0_level2.evt | modeM0/AS1A10_094T15_9000005312_37337cztM0_level2_quad_clean.evt |
| Size (bytes) | 138,991,680 | 33,782,400 |
| Size | 132.6 MB | 32.2 MB |
| Events in quadrant A | 971,021 | 220,093 |
| Events in quadrant B | 845,398 | 225,125 |
| Events in quadrant C | 1,042,708 | 226,583 |
| Events in quadrant D | 1,223,908 | 217,613 |
| Mode M0 | |||
|---|---|---|---|
| Quadrant | BADHDUFLAG | Total packets | Discarded packets |
| A | 0 | 3988 | 2 |
| B | 0 | 3731 | 2 |
| C | 0 | 4135 | 1 |
| D | 0 | 4827 | 10 |
| Mode M9 | |||
|---|---|---|---|
| Quadrant | BADHDUFLAG | Total packets | Discarded packets |
| A | 0 | 14 | 0 |
| B | 0 | 14 | 0 |
| C | 0 | 14 | 0 |
| D | 0 | 14 | 0 |
| Mode SS | |||
|---|---|---|---|
| Quadrant | BADHDUFLAG | Total packets | Discarded packets |
| A | 0 | 38 | 0 |
| B | 0 | 38 | 0 |
| C | 0 | 38 | 0 |
| D | 0 | 38 | 0 |
| Quadrant | Total seconds | Saturated seconds | Saturation percentage |
|---|---|---|---|
| A | 1824 | 12 | 0.657895% |
| B | 1823 | 5 | 0.274273% |
| C | 1824 | 26 | 1.425439% |
| D | 1821 | 49 | 2.690829% |
Noise dominated data is calculated using 1-second bins in cleaned event files. If a bin has >2000 counts, and if more than 50% of those come from <1% of pixels, then it is considered to be noise-dominated and hence unusable.
| Quadrant | # 1 sec bins | Bins with >0 counts | Bins with >2000 counts | High rate bins dominated by noise | Noise dominated (total time) | Noise dominated (detector-on time) | Marked lightcurve |
|---|---|---|---|---|---|---|---|
| A | 3167 | 1825 | 2 | 2 | 0.06% | 0.11% | 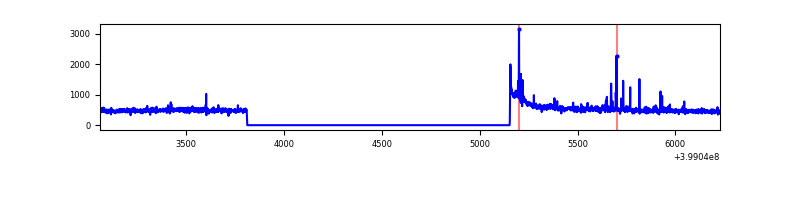 |
| B | 3167 | 1825 | 1 | 1 | 0.03% | 0.05% | 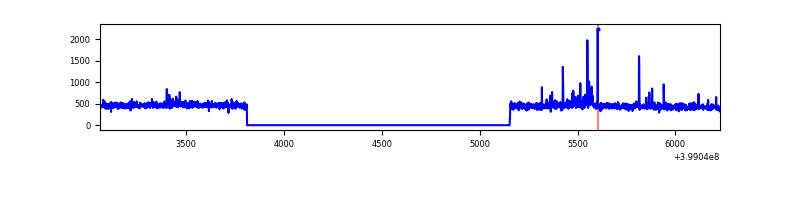 |
| C | 3167 | 1825 | 16 | 16 | 0.51% | 0.88% | 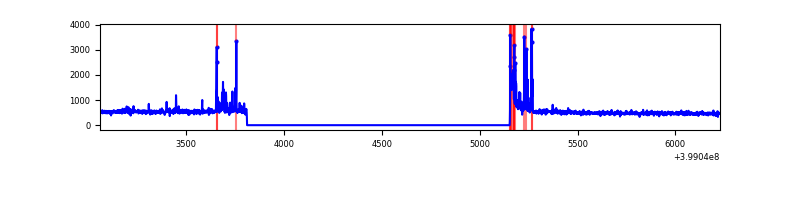 |
| D | 3167 | 1825 | 40 | 40 | 1.26% | 2.19% | 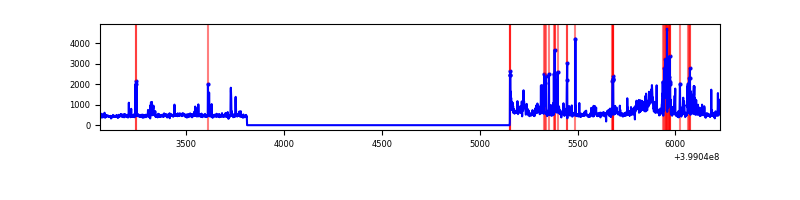 |
Top three noisy pixels from each quadrant. If the there are fewer than three noisy pixels in the level2.evt file, extra rows are filled as -1
| Pixel properties | Quadrant properties | ||||||
|---|---|---|---|---|---|---|---|
| Quadrant | DetID | PixID | Counts | Sigma | Mean | Median | Sigma |
| A | 10 | 83 | 118369 | 2673.85 | 207 | 203 | 44.2 |
| A | 9 | 143 | 23717 | 532.07 | 207 | 203 | 44.2 |
| A | 13 | 248 | 12328 | 274.36 | 207 | 203 | 44.2 |
| B | 5 | 172 | 10920 | 263.01 | 204 | 198 | 40.8 |
| B | 0 | 190 | 10156 | 244.27 | 204 | 198 | 40.8 |
| B | 4 | 141 | 5637 | 133.42 | 204 | 198 | 40.8 |
| C | 15 | 214 | 78987 | 1616.39 | 203 | 204 | 48.7 |
| C | 1 | 23 | 78699 | 1610.48 | 203 | 204 | 48.7 |
| C | 14 | 254 | 44859 | 916.19 | 203 | 204 | 48.7 |
| D | 12 | 235 | 202282 | 4018.37 | 204 | 197 | 50.3 |
| D | 2 | 249 | 167736 | 3331.44 | 204 | 197 | 50.3 |
| D | 13 | 249 | 28908 | 570.91 | 204 | 197 | 50.3 |
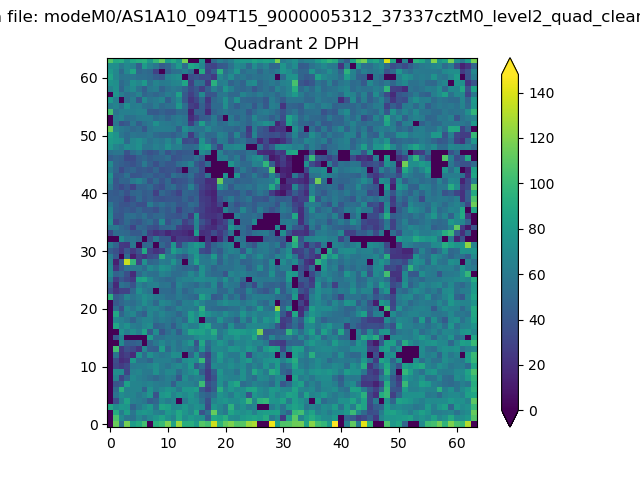
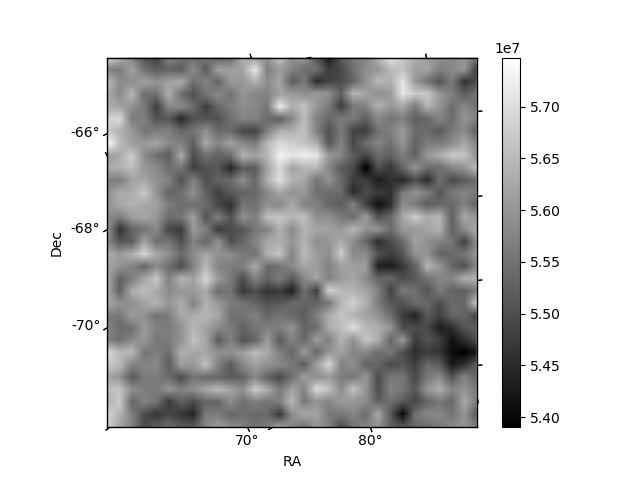
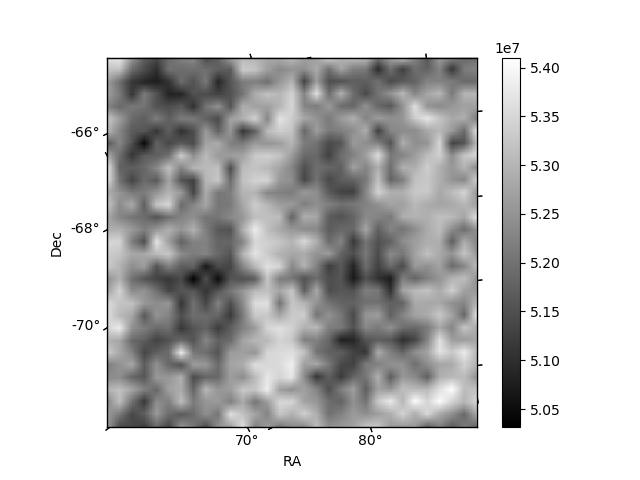
Histogram calculated using DETX and DETY for each event in the final _common_clean file
| Quadrant A | 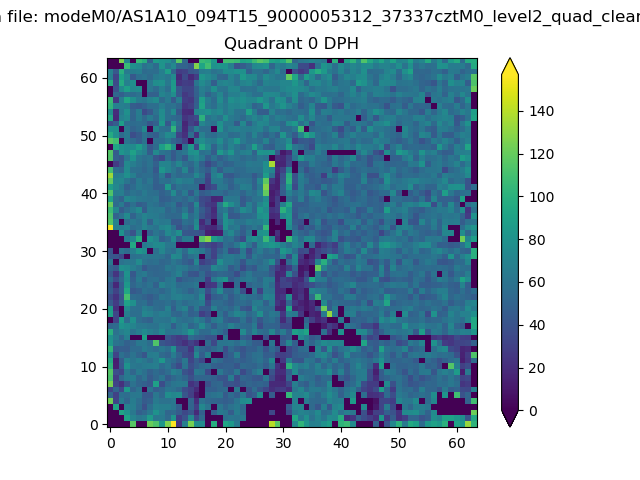 |
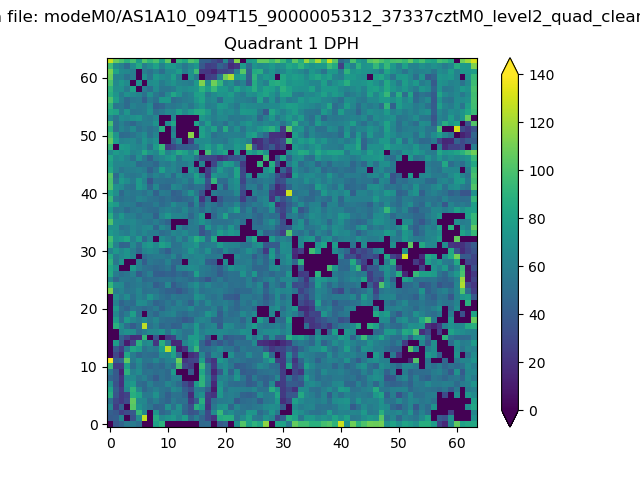 |
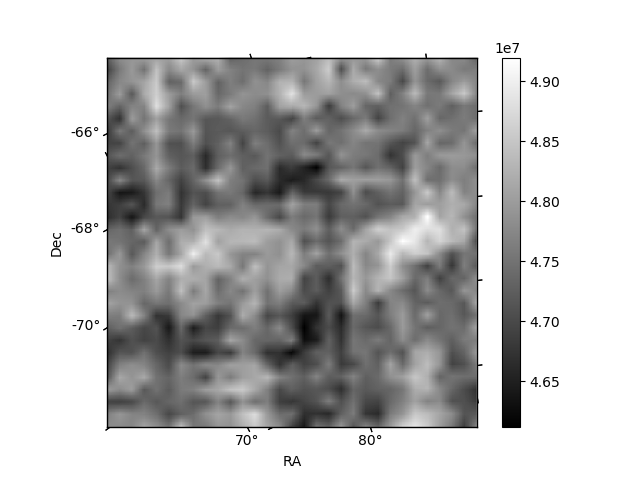
Quadrant B |
|---|---|---|---|
| Quadrant D | 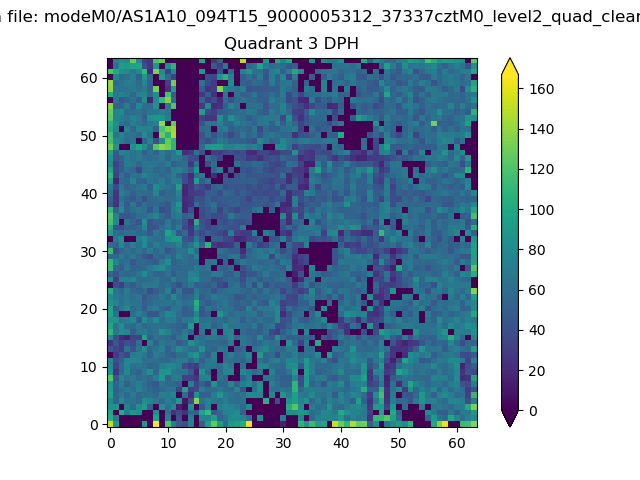 |
 |
Quadrant C |
| Plot type | Count rate plots | Images |
|---|---|---|
| Comparison with Poisson distribution Blue bars denote a histogram of data divided into 1 sec bins. Red curve is a Poisson curve with rate = median count rate of data. |
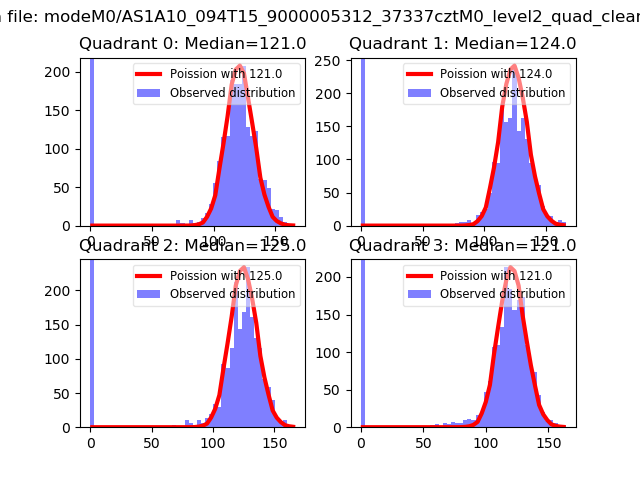 |
 |
| Quadrant-wise count rates Data is divided into 100 sec bins |
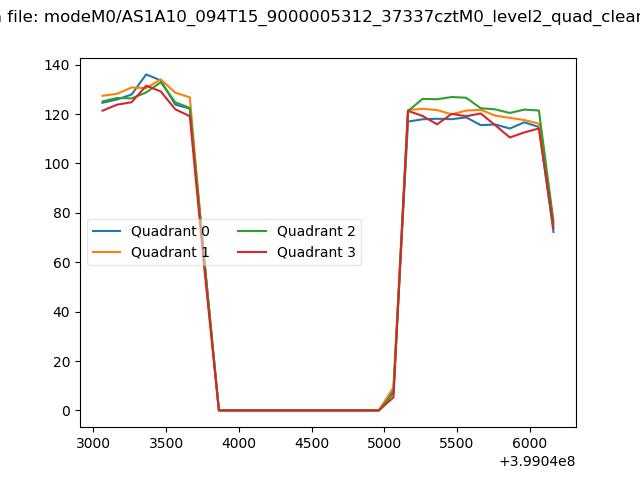 |
|
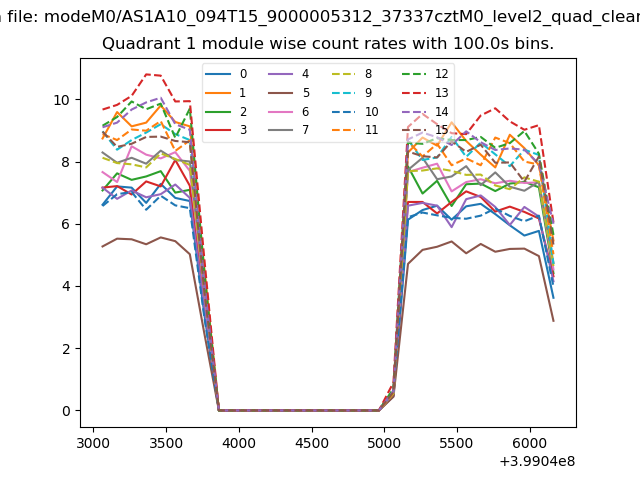
| Module-wise count rates for Quadrant A Data is divided into 100 sec bins |
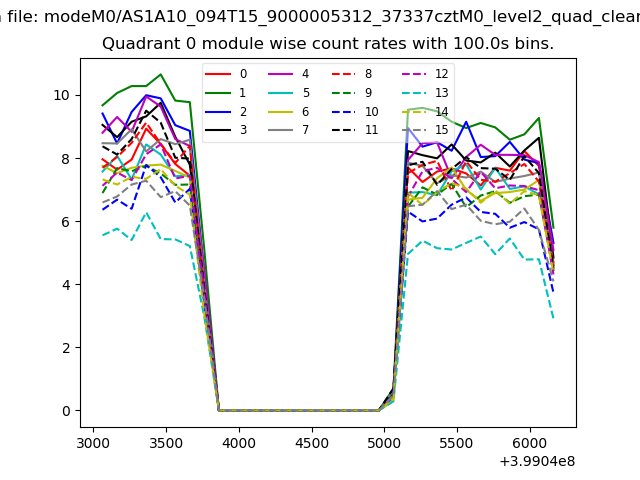 |
 |
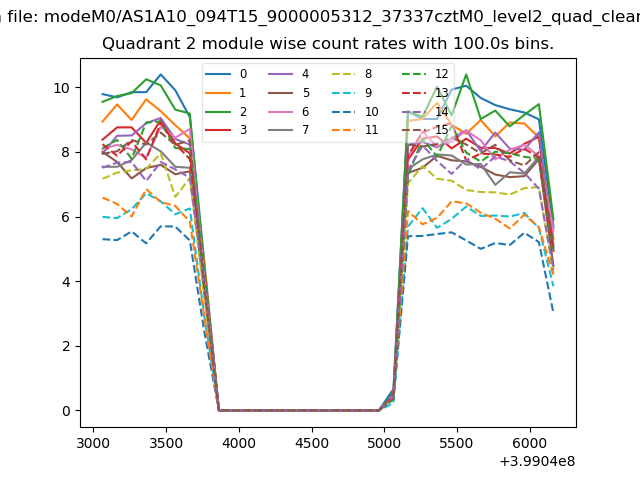
| Module-wise count rates for Quadrant B Data is divided into 100 sec bins |
 |
 |
| Module-wise count rates for Quadrant C Data is divided into 100 sec bins |
 |
 |
| Module-wise count rates for Quadrant D Data is divided into 100 sec bins |
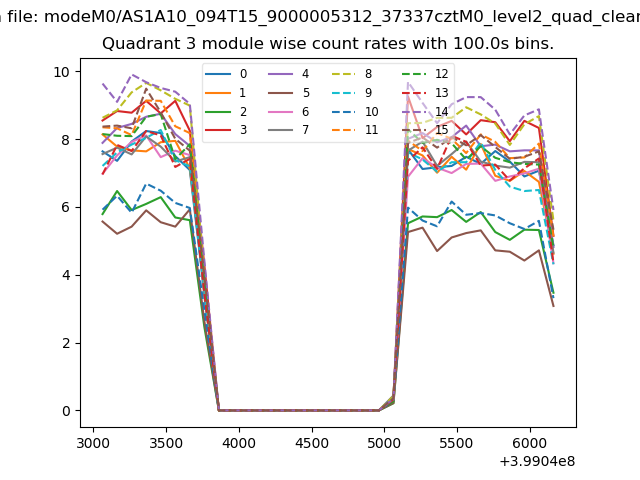 |
 |
| Parameter | Plot |
|---|---|
| CZT HV Monitor | 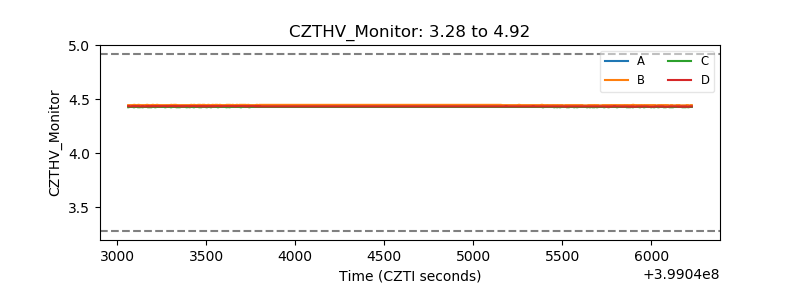 |
| D_VDD | 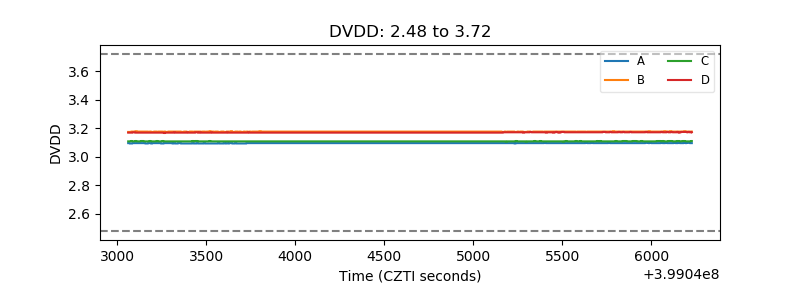 |
| Temperature 1 | 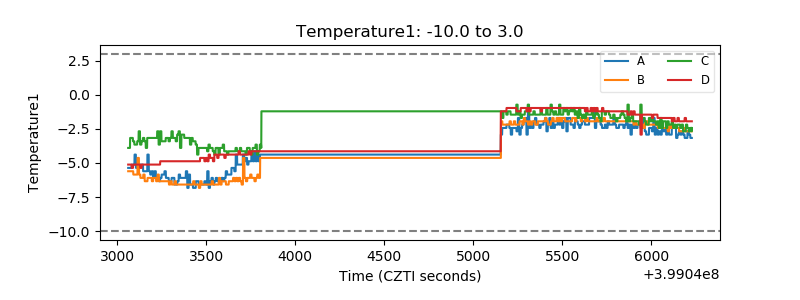 |
| Veto HV Monitor | 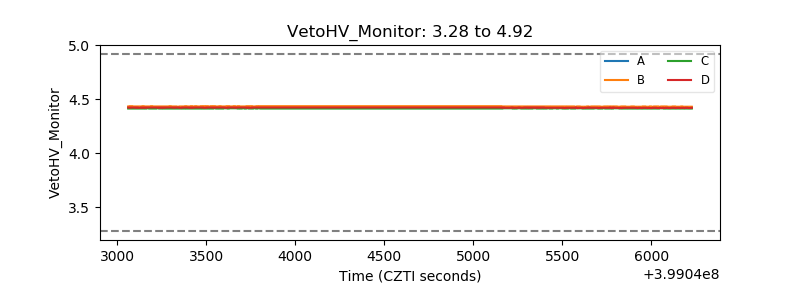 |
| Veto LLD | 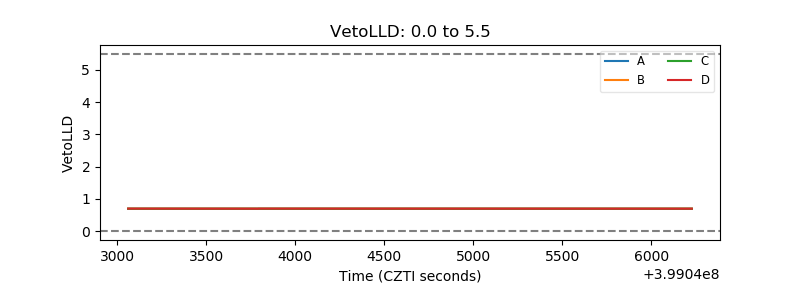 |
| Alpha Counter | 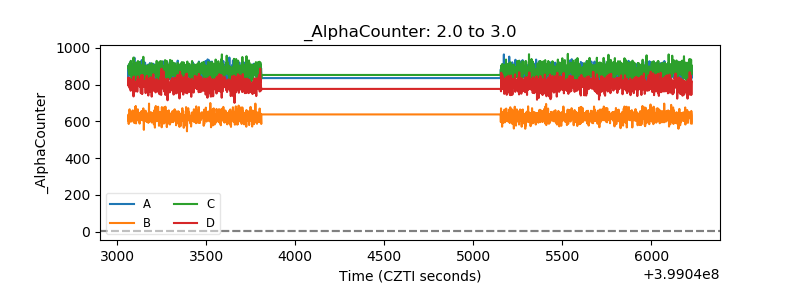 |
| _CPM_Rate | 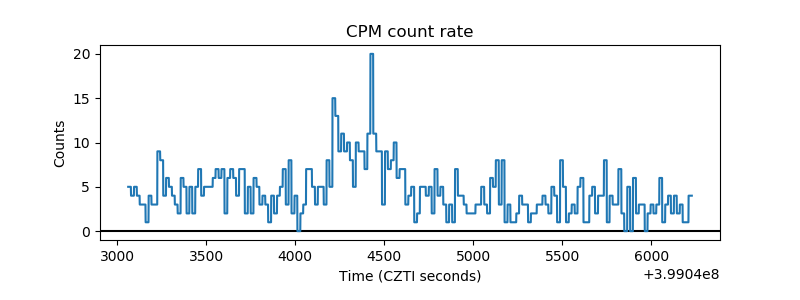 |
| CZT Counter | 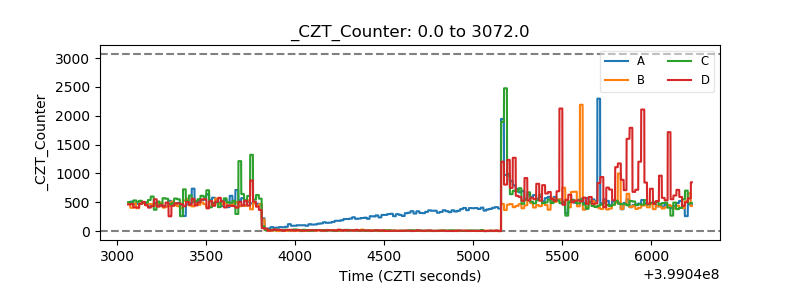 |
| +2.5 Volts monitor | 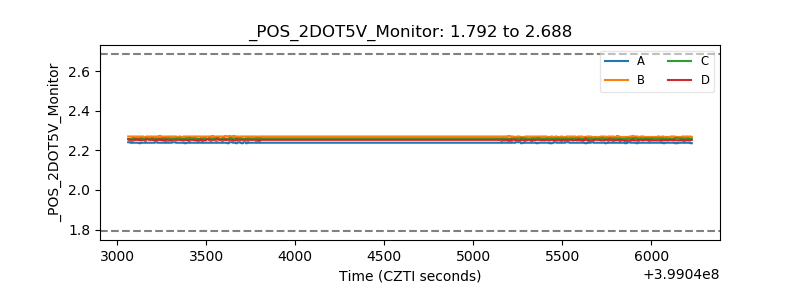 |
| +5 Volts monitor | 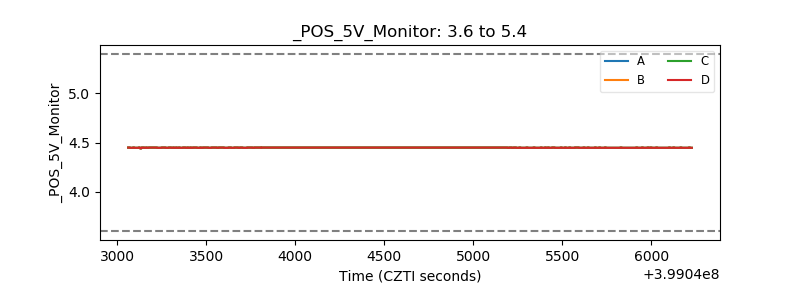 |
| _ROLL_ROT | 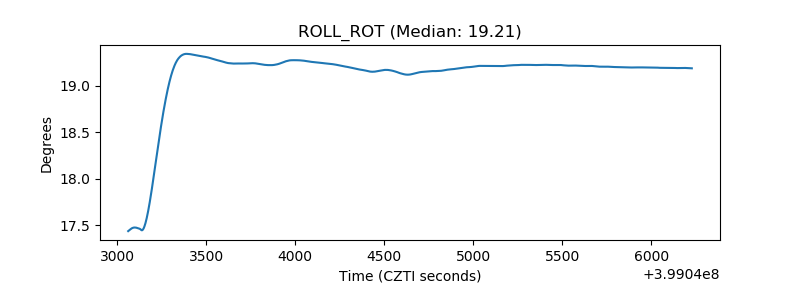 |
| _Roll_DEC | 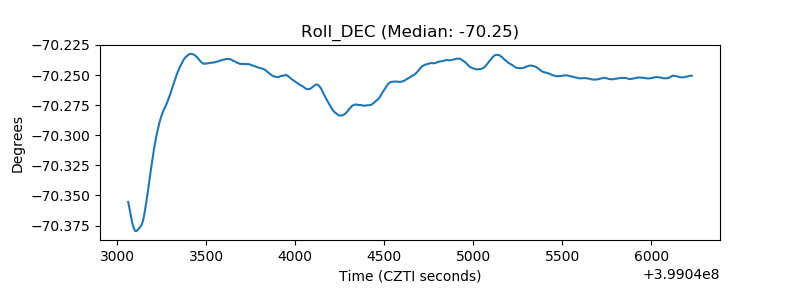 |
| _Roll_RA |  |
| Veto Counter | 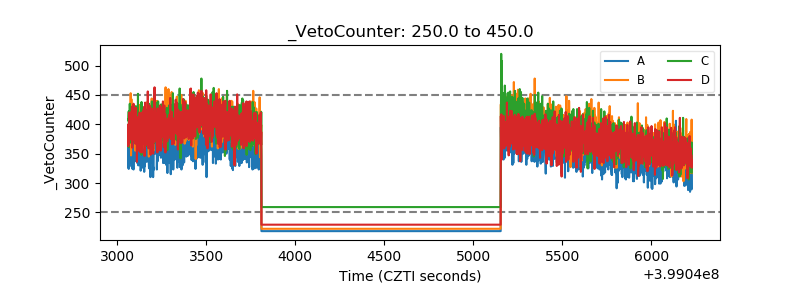 |