| Param | Original file | Final file |
|---|---|---|
| Filename | modeM0/AS1A10_094T15_9000005312_37338cztM0_level2.evt | modeM0/AS1A10_094T15_9000005312_37338cztM0_level2_quad_clean.evt |
| Size (bytes) | 188,602,560 | 44,570,880 |
| Size | 179.9 MB | 42.5 MB |
| Events in quadrant A | 1,174,045 | 291,357 |
| Events in quadrant B | 1,148,020 | 295,554 |
| Events in quadrant C | 1,278,145 | 299,406 |
| Events in quadrant D | 1,938,901 | 282,789 |
| Mode M0 | |||
|---|---|---|---|
| Quadrant | BADHDUFLAG | Total packets | Discarded packets |
| A | 0 | 5166 | 0 |
| B | 0 | 5211 | 3 |
| C | 0 | 5370 | 4 |
| D | 0 | 7430 | 0 |
| Mode SS | |||
|---|---|---|---|
| Quadrant | BADHDUFLAG | Total packets | Discarded packets |
| A | 0 | 50 | 0 |
| B | 0 | 50 | 0 |
| C | 0 | 50 | 0 |
| D | 0 | 50 | 0 |
| Quadrant | Total seconds | Saturated seconds | Saturation percentage |
|---|---|---|---|
| A | 2513 | 6 | 0.238758% |
| B | 2511 | 4 | 0.159299% |
| C | 2510 | 18 | 0.717131% |
| D | 2513 | 118 | 4.695583% |
Noise dominated data is calculated using 1-second bins in cleaned event files. If a bin has >2000 counts, and if more than 50% of those come from <1% of pixels, then it is considered to be noise-dominated and hence unusable.
| Quadrant | # 1 sec bins | Bins with >0 counts | Bins with >2000 counts | High rate bins dominated by noise | Noise dominated (total time) | Noise dominated (detector-on time) | Marked lightcurve |
|---|---|---|---|---|---|---|---|
| A | 2513 | 2513 | 2 | 2 | 0.08% | 0.08% |  |
| B | 2513 | 2512 | 2 | 2 | 0.08% | 0.08% |  |
| C | 2513 | 2512 | 15 | 15 | 0.60% | 0.60% |  |
| D | 2513 | 2513 | 112 | 112 | 4.46% | 4.46% | 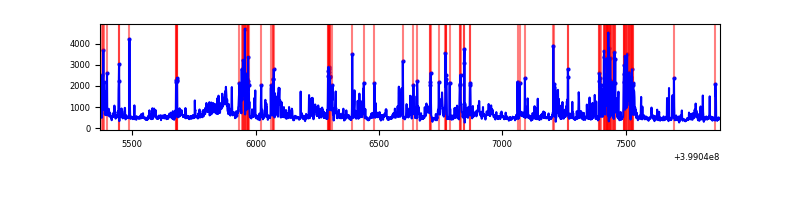 |
Top three noisy pixels from each quadrant. If the there are fewer than three noisy pixels in the level2.evt file, extra rows are filled as -1
| Pixel properties | Quadrant properties | ||||||
|---|---|---|---|---|---|---|---|
| Quadrant | DetID | PixID | Counts | Sigma | Mean | Median | Sigma |
| A | 10 | 83 | 92045 | 1668.49 | 265 | 260 | 55.0 |
| A | 9 | 143 | 30552 | 550.65 | 265 | 260 | 55.0 |
| A | 13 | 6 | 7836 | 137.72 | 265 | 260 | 55.0 |
| B | 0 | 190 | 44587 | 860.48 | 262 | 255 | 51.5 |
| B | 15 | 85 | 15893 | 303.53 | 262 | 255 | 51.5 |
| B | 5 | 172 | 12138 | 230.65 | 262 | 255 | 51.5 |
| C | 14 | 254 | 107830 | 1772.6 | 255 | 256 | 60.7 |
| C | 15 | 214 | 103207 | 1696.42 | 255 | 256 | 60.7 |
| C | 1 | 23 | 63387 | 1040.27 | 255 | 256 | 60.7 |
| D | 2 | 249 | 508144 | 8115.66 | 253 | 245 | 62.6 |
| D | 12 | 235 | 304347 | 4859.21 | 253 | 245 | 62.6 |
| D | 2 | 153 | 56755 | 902.97 | 253 | 245 | 62.6 |
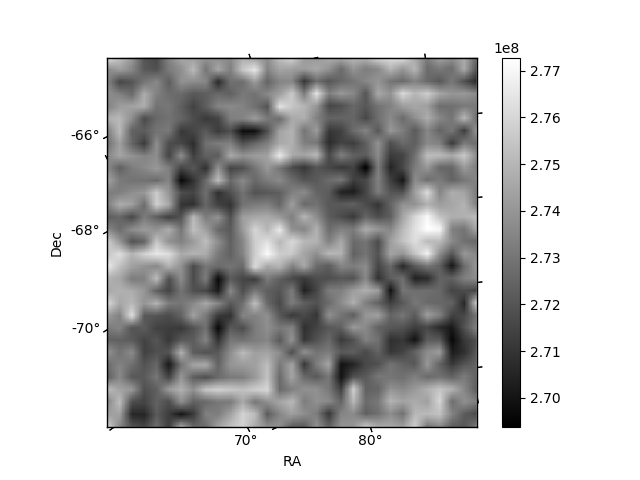
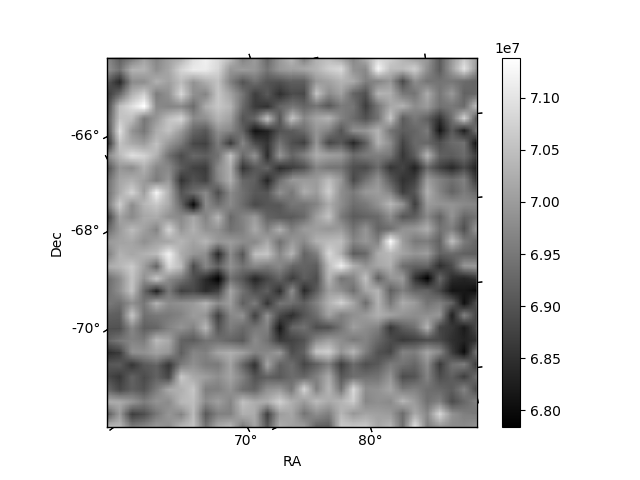
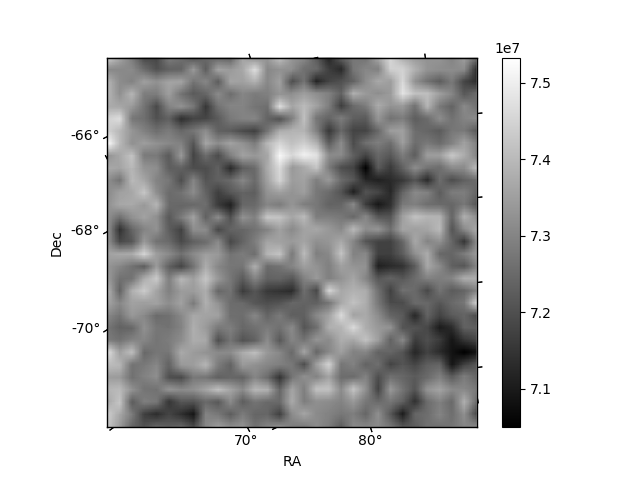
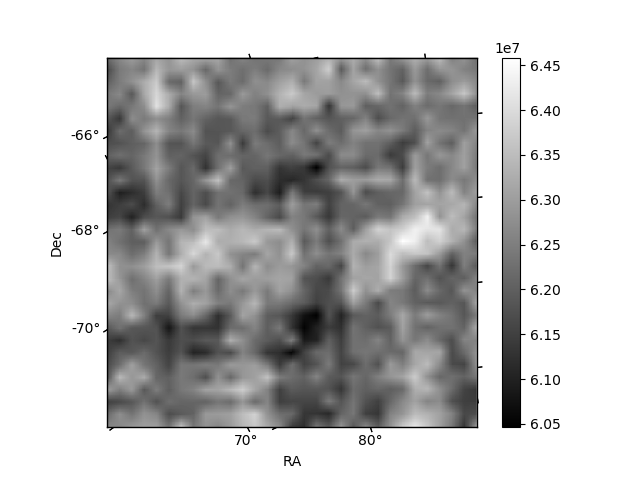
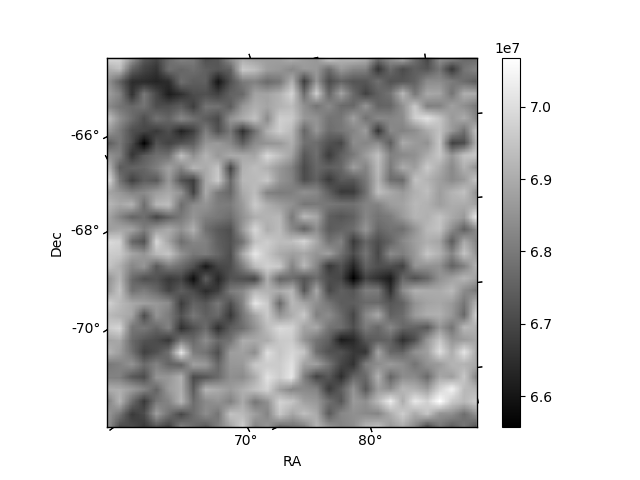
Histogram calculated using DETX and DETY for each event in the final _common_clean file
| Quadrant A | 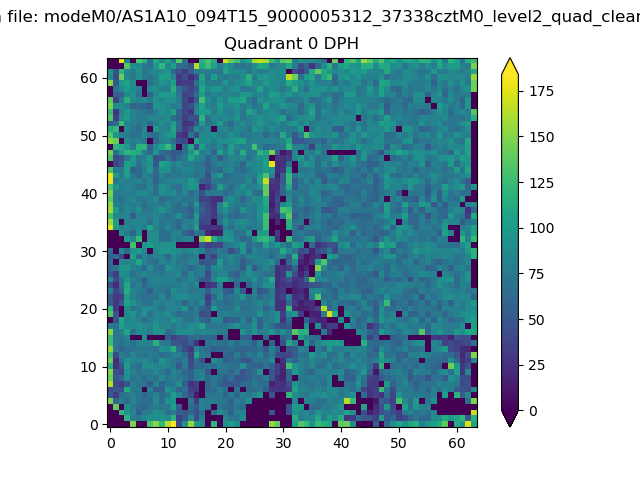 |
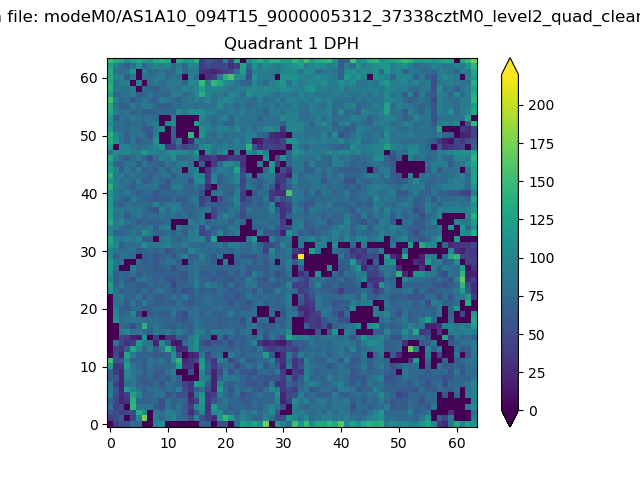 |
Quadrant B |
|---|---|---|---|
| Quadrant D | 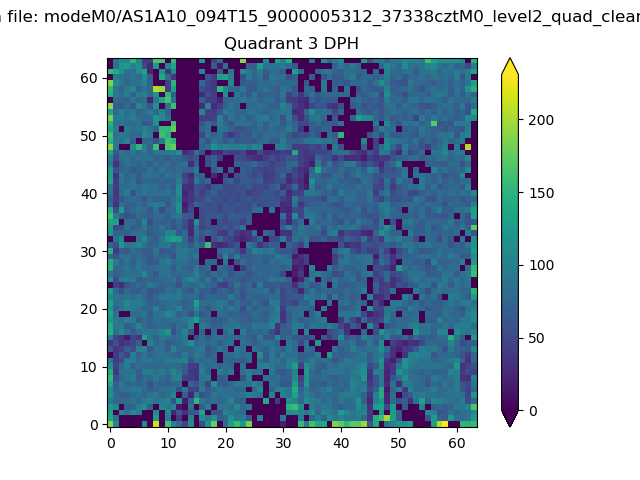 |
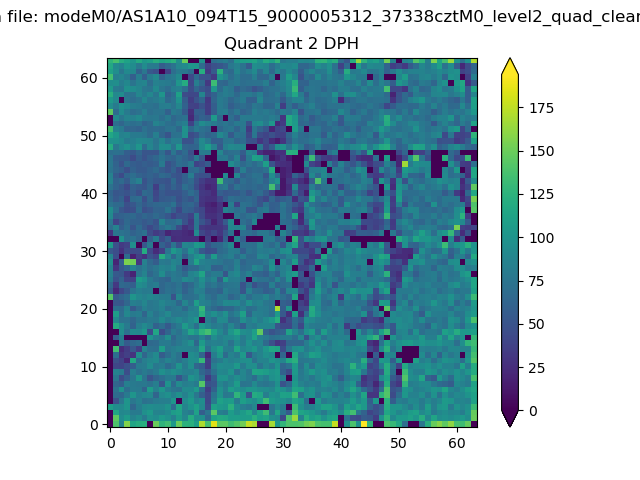 |
Quadrant C |
| Plot type | Count rate plots | Images |
|---|---|---|
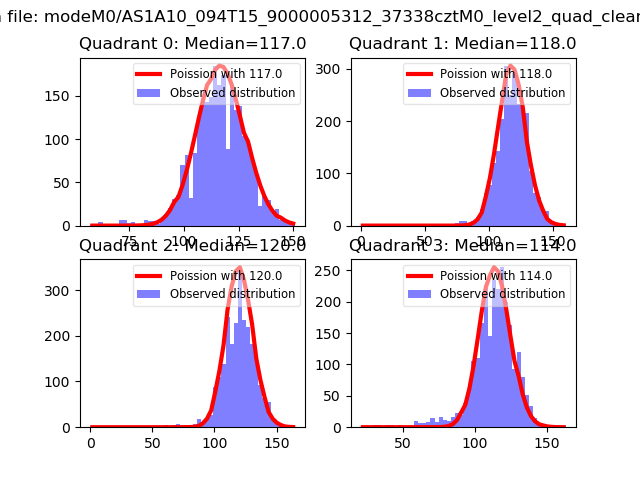
| Comparison with Poisson distribution Blue bars denote a histogram of data divided into 1 sec bins. Red curve is a Poisson curve with rate = median count rate of data. |
 |
 |
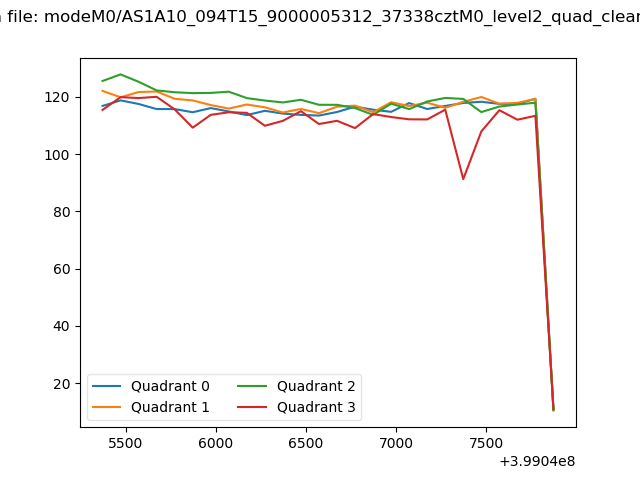
| Quadrant-wise count rates Data is divided into 100 sec bins |
 |
|
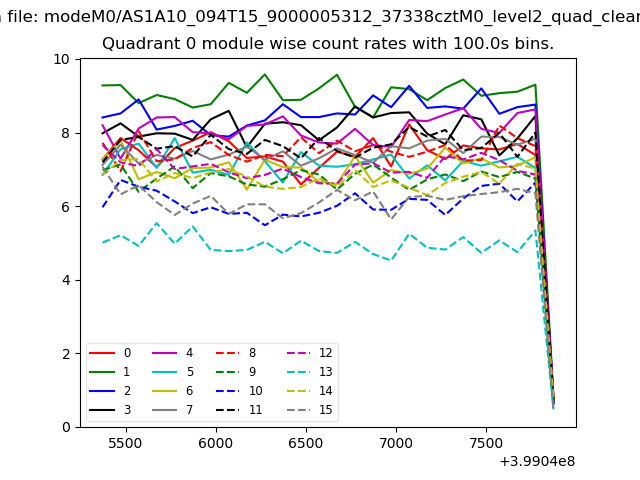
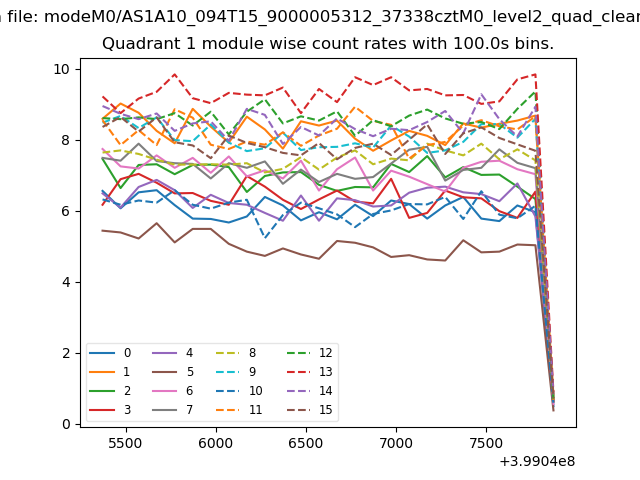
| Module-wise count rates for Quadrant A Data is divided into 100 sec bins |
 |
 |
| Module-wise count rates for Quadrant B Data is divided into 100 sec bins |
 |
 |
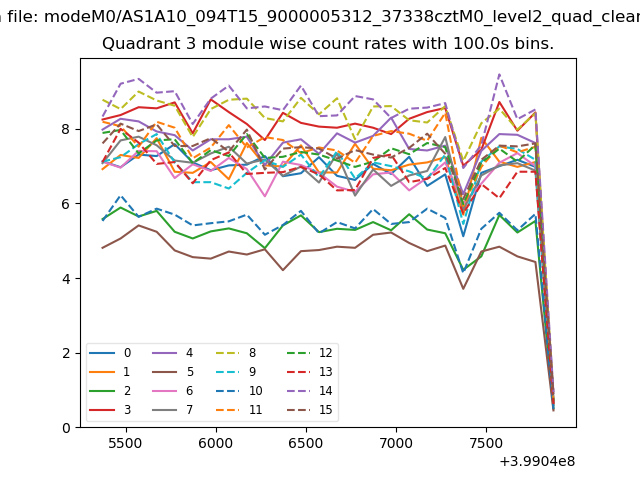
| Module-wise count rates for Quadrant C Data is divided into 100 sec bins |
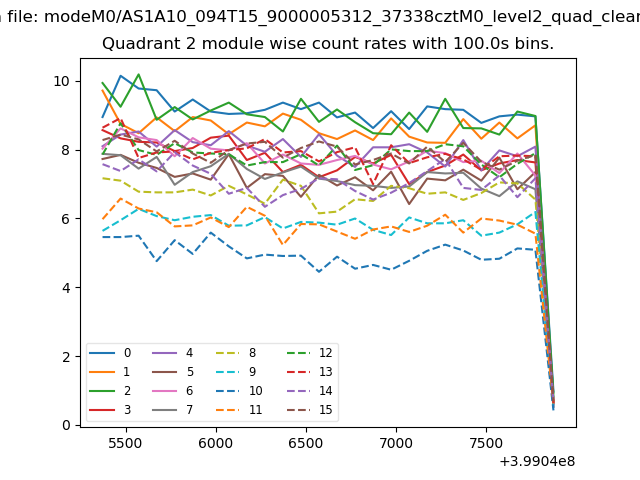 |
 |
| Module-wise count rates for Quadrant D Data is divided into 100 sec bins |
 |
 |
| Parameter | Plot |
|---|---|
| CZT HV Monitor | 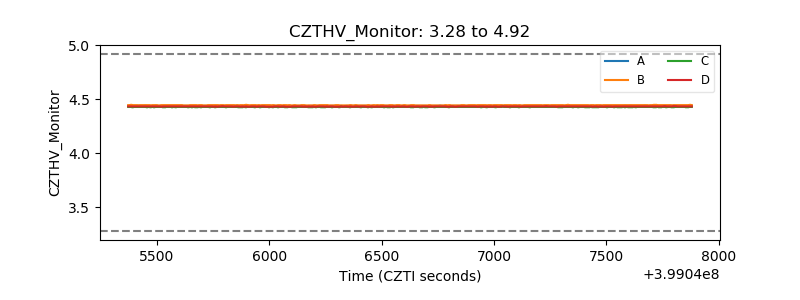 |
| D_VDD | 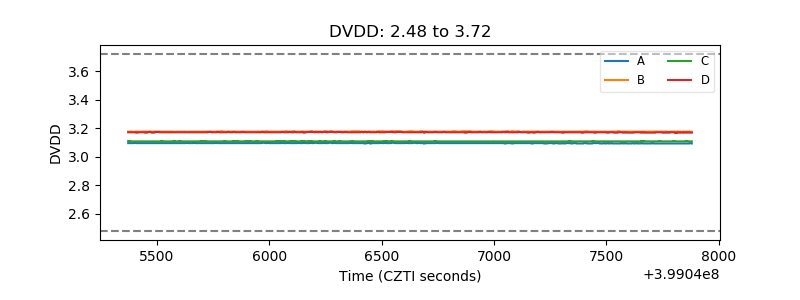 |
| Temperature 1 | 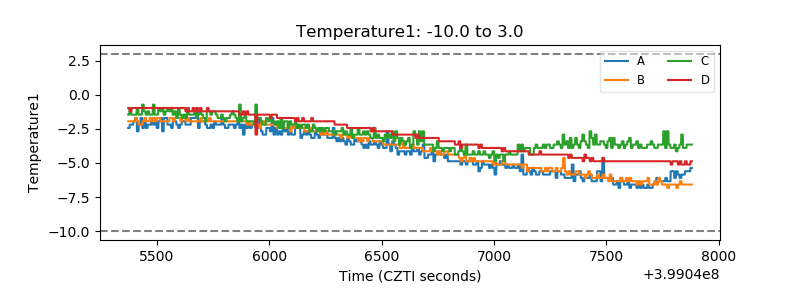 |
| Veto HV Monitor | 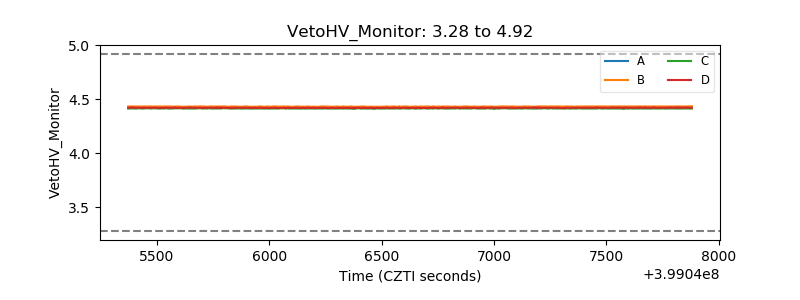 |
| Veto LLD | 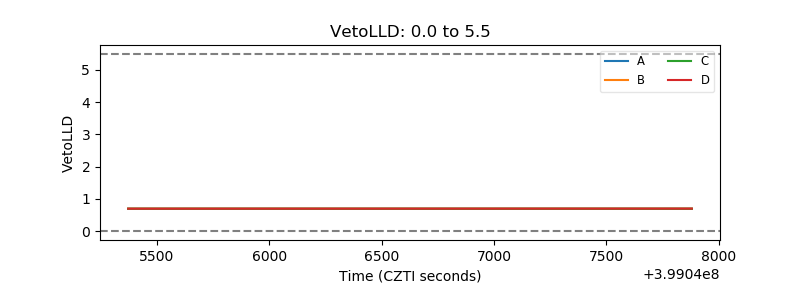 |
| Alpha Counter | 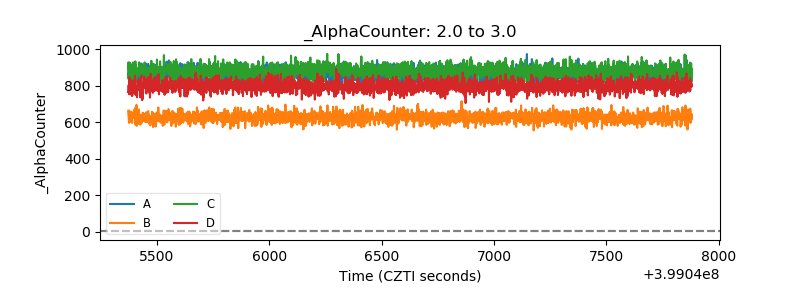 |
| _CPM_Rate | 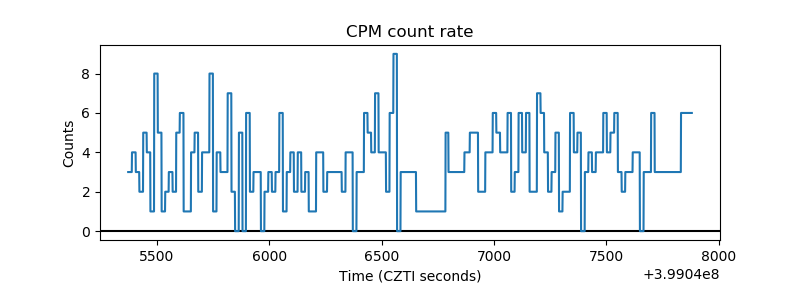 |
| CZT Counter | 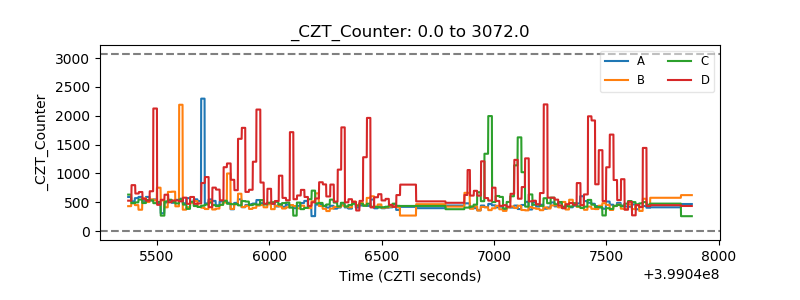 |
| +2.5 Volts monitor | 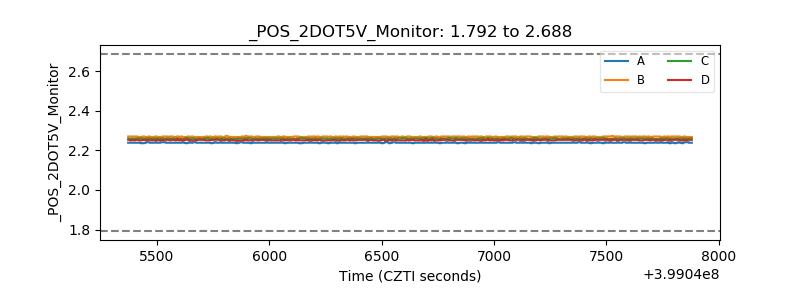 |
| +5 Volts monitor | 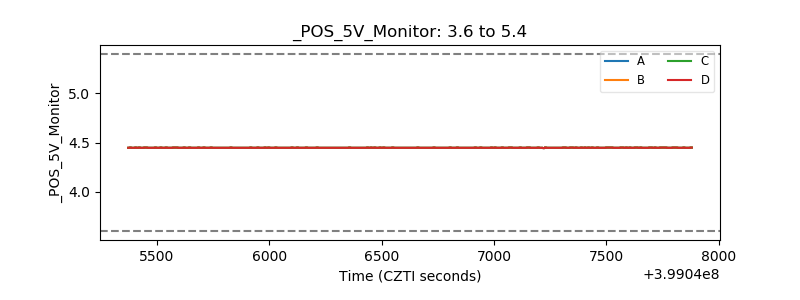 |
| _ROLL_ROT |  |
| _Roll_DEC | 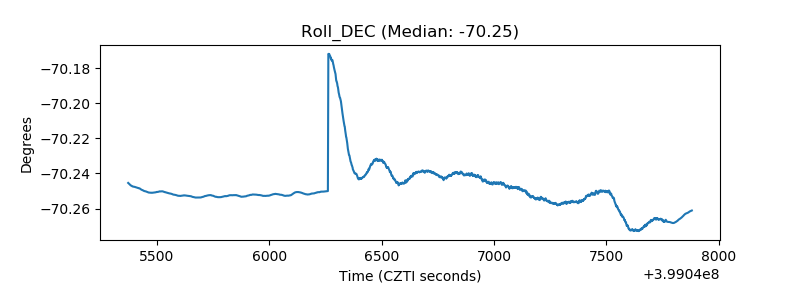 |
| _Roll_RA | 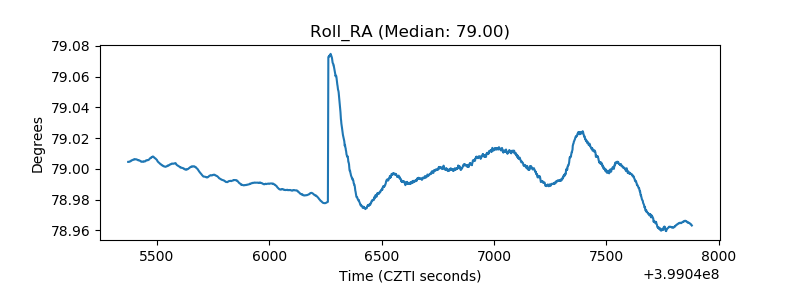 |
| Veto Counter | 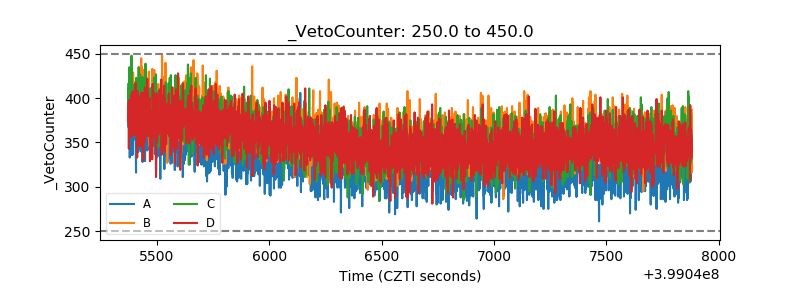 |