| Param | Original file | Final file |
|---|---|---|
| Filename | modeM0/AS1C07_014T01_9000005314_37338cztM0_level2.evt | modeM0/AS1C07_014T01_9000005314_37338cztM0_level2_quad_clean.evt |
| Size (bytes) | 194,627,520 | 28,797,120 |
| Size | 185.6 MB | 27.5 MB |
| Events in quadrant A | 1,168,567 | 180,296 |
| Events in quadrant B | 1,143,893 | 180,984 |
| Events in quadrant C | 1,343,044 | 177,909 |
| Events in quadrant D | 2,085,212 | 171,240 |
| Mode M0 | |||
|---|---|---|---|
| Quadrant | BADHDUFLAG | Total packets | Discarded packets |
| A | 0 | 4779 | 7 |
| B | 0 | 4767 | 12 |
| C | 0 | 5324 | 18 |
| D | 0 | 7724 | 38 |
| Mode M9 | |||
|---|---|---|---|
| Quadrant | BADHDUFLAG | Total packets | Discarded packets |
| A | 0 | 13 | 0 |
| B | 0 | 13 | 0 |
| C | 0 | 13 | 0 |
| D | 0 | 13 | 0 |
| Mode SS | |||
|---|---|---|---|
| Quadrant | BADHDUFLAG | Total packets | Discarded packets |
| A | 0 | 46 | 0 |
| B | 0 | 46 | 0 |
| C | 0 | 46 | 0 |
| D | 0 | 46 | 0 |
| Quadrant | Total seconds | Saturated seconds | Saturation percentage |
|---|---|---|---|
| A | 2236 | 6 | 0.268336% |
| B | 2231 | 10 | 0.448229% |
| C | 2229 | 27 | 1.211306% |
| D | 2231 | 244 | 10.936800% |
Noise dominated data is calculated using 1-second bins in cleaned event files. If a bin has >2000 counts, and if more than 50% of those come from <1% of pixels, then it is considered to be noise-dominated and hence unusable.
| Quadrant | # 1 sec bins | Bins with >0 counts | Bins with >2000 counts | High rate bins dominated by noise | Noise dominated (total time) | Noise dominated (detector-on time) | Marked lightcurve |
|---|---|---|---|---|---|---|---|
| A | 3522 | 2239 | 1 | 1 | 0.03% | 0.04% | 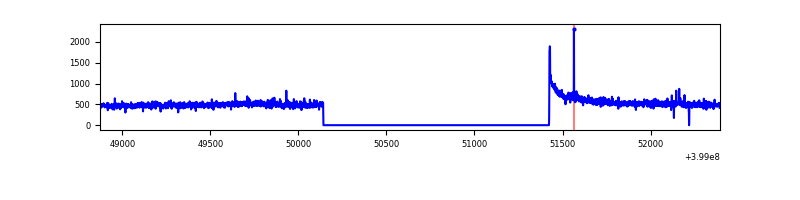 |
| B | 3522 | 2237 | 6 | 6 | 0.17% | 0.27% | 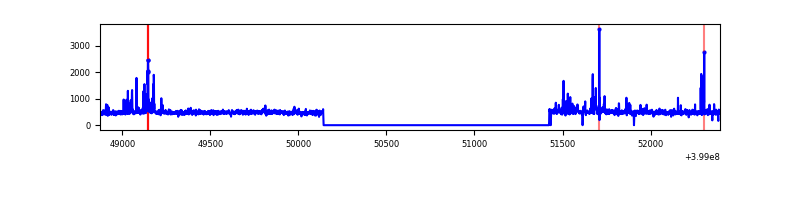 |
| C | 3522 | 2236 | 21 | 21 | 0.60% | 0.94% | 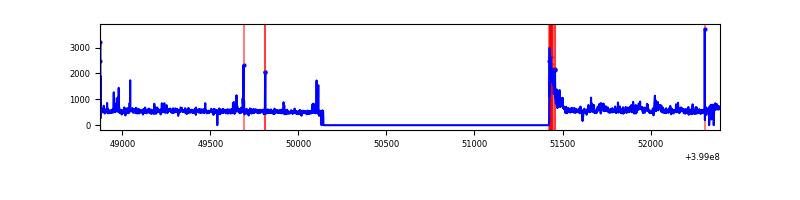 |
| D | 3522 | 2239 | 202 | 202 | 5.74% | 9.02% | 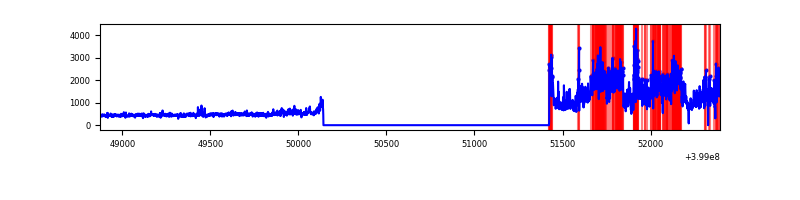 |
Top three noisy pixels from each quadrant. If the there are fewer than three noisy pixels in the level2.evt file, extra rows are filled as -1
| Pixel properties | Quadrant properties | ||||||
|---|---|---|---|---|---|---|---|
| Quadrant | DetID | PixID | Counts | Sigma | Mean | Median | Sigma |
| A | 10 | 83 | 128244 | 2298.7 | 266 | 262 | 55.7 |
| A | 13 | 248 | 5206 | 88.8 | 266 | 262 | 55.7 |
| A | 13 | 254 | 3984 | 66.85 | 266 | 262 | 55.7 |
| B | 4 | 171 | 37716 | 704.09 | 263 | 256 | 53.2 |
| B | 0 | 190 | 19644 | 364.41 | 263 | 256 | 53.2 |
| B | 15 | 85 | 13693 | 252.56 | 263 | 256 | 53.2 |
| C | 1 | 23 | 121886 | 2010.53 | 253 | 256 | 60.5 |
| C | 15 | 214 | 96268 | 1587.07 | 253 | 256 | 60.5 |
| C | 0 | 10 | 62582 | 1030.24 | 253 | 256 | 60.5 |
| D | 12 | 235 | 978570 | 15720.39 | 248 | 241 | 62.2 |
| D | 2 | 249 | 55125 | 881.91 | 248 | 241 | 62.2 |
| D | 2 | 153 | 51077 | 816.86 | 248 | 241 | 62.2 |
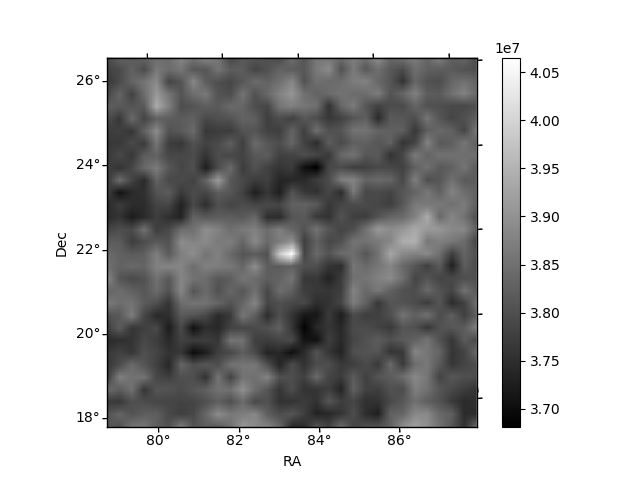
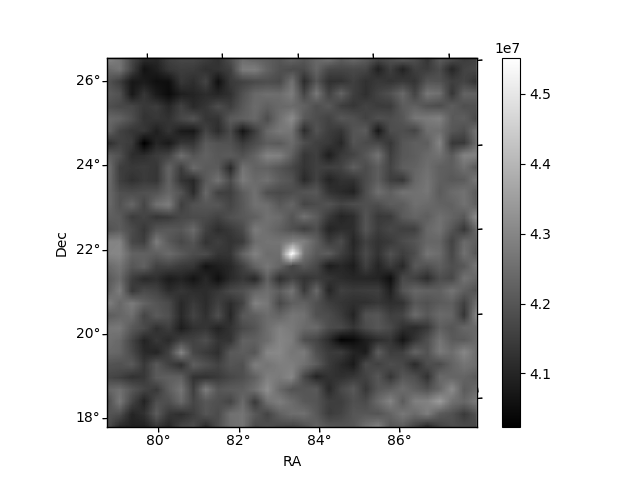
Histogram calculated using DETX and DETY for each event in the final _common_clean file
| Quadrant A | 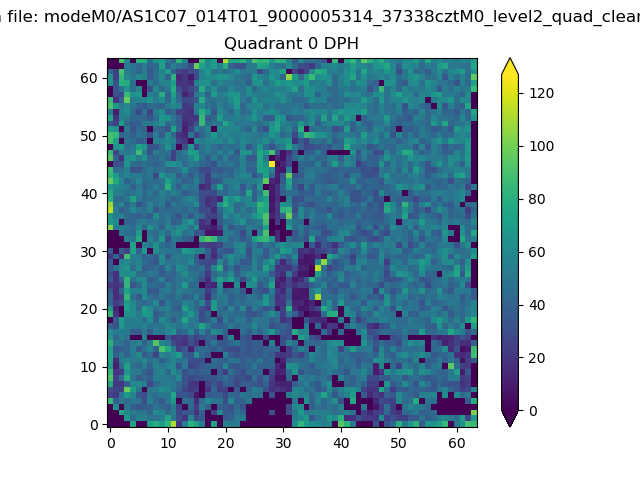 |
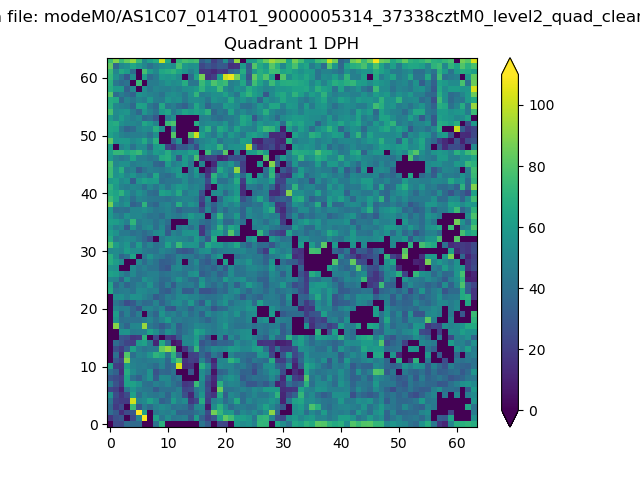 |
Quadrant B |
|---|---|---|---|
| Quadrant D | 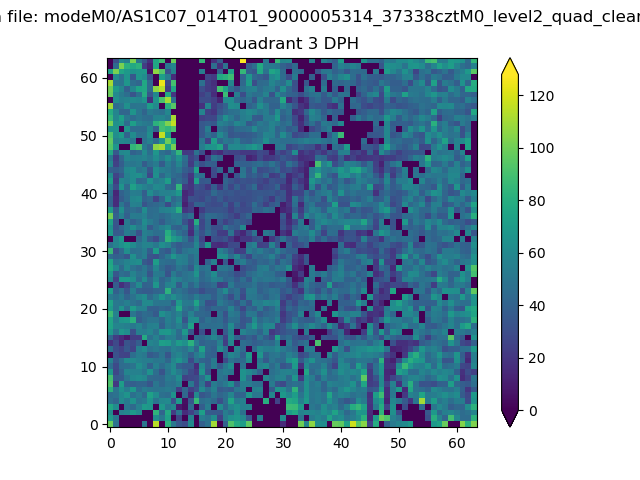 |
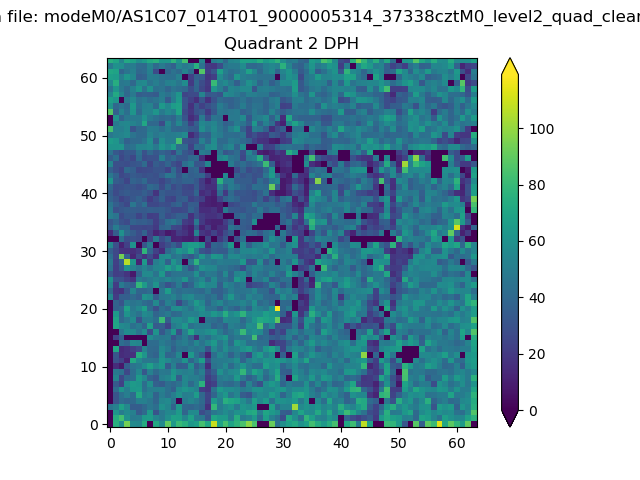 |
Quadrant C |
| Plot type | Count rate plots | Images |
|---|---|---|
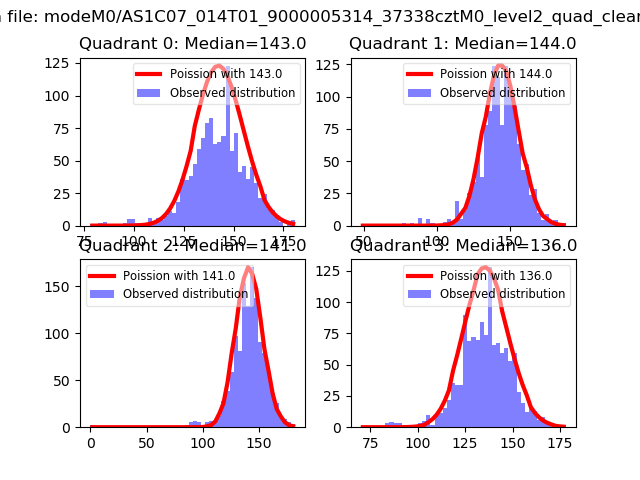
| Comparison with Poisson distribution Blue bars denote a histogram of data divided into 1 sec bins. Red curve is a Poisson curve with rate = median count rate of data. |
 |
 |
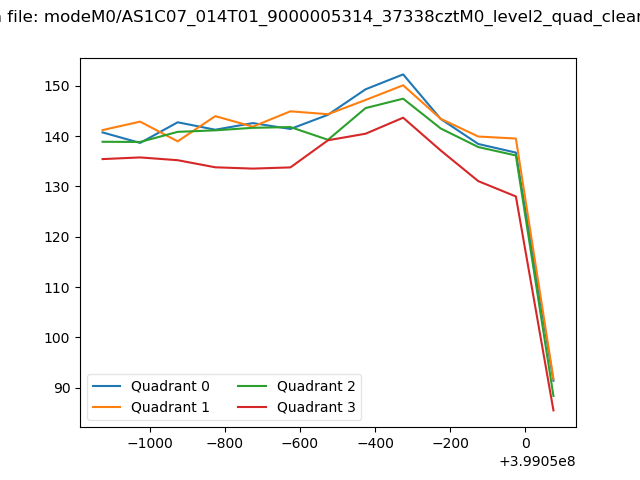
| Quadrant-wise count rates Data is divided into 100 sec bins |
 |
|
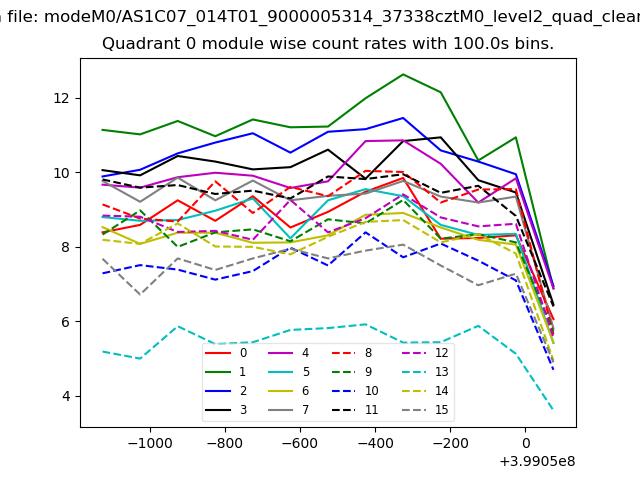
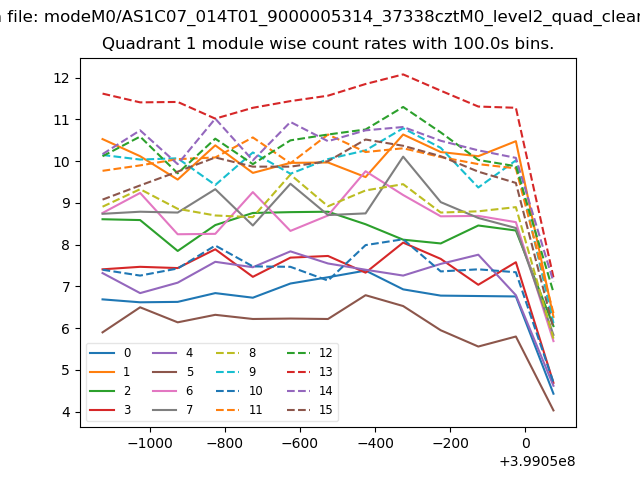
| Module-wise count rates for Quadrant A Data is divided into 100 sec bins |
 |
 |
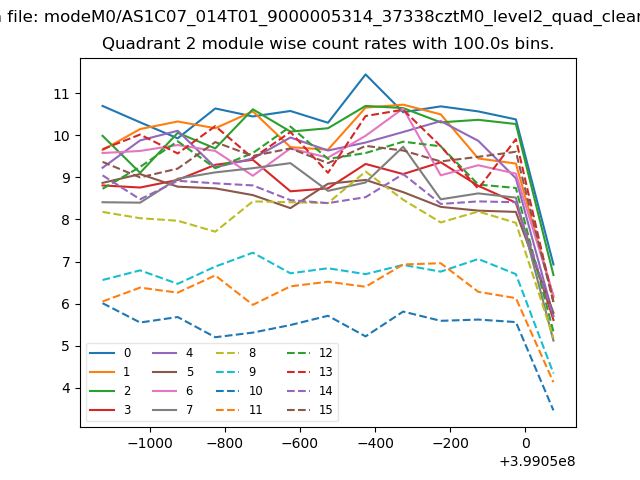
| Module-wise count rates for Quadrant B Data is divided into 100 sec bins |
 |
 |
| Module-wise count rates for Quadrant C Data is divided into 100 sec bins |
 |
 |
| Module-wise count rates for Quadrant D Data is divided into 100 sec bins |
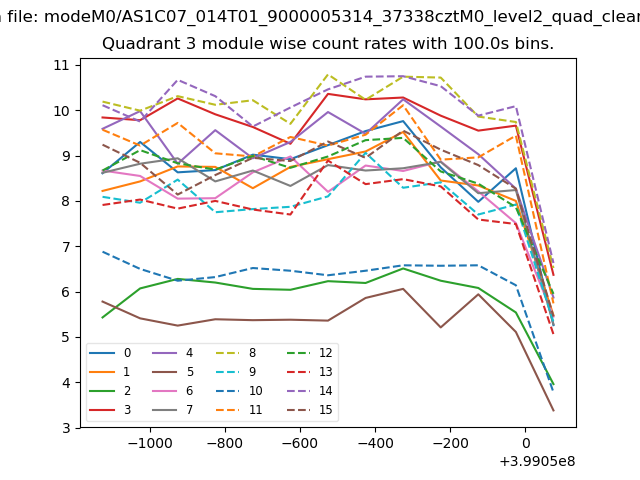 |
 |
| Parameter | Plot |
|---|---|
| CZT HV Monitor | 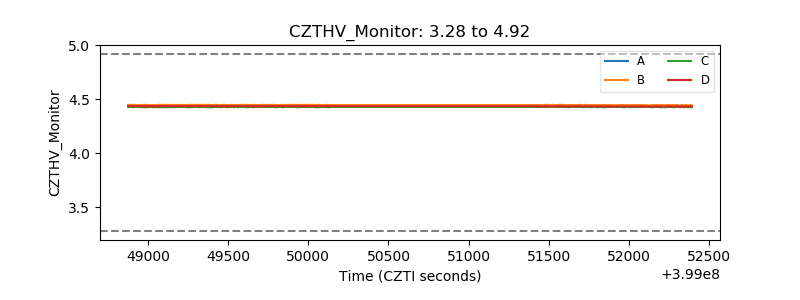 |
| D_VDD | 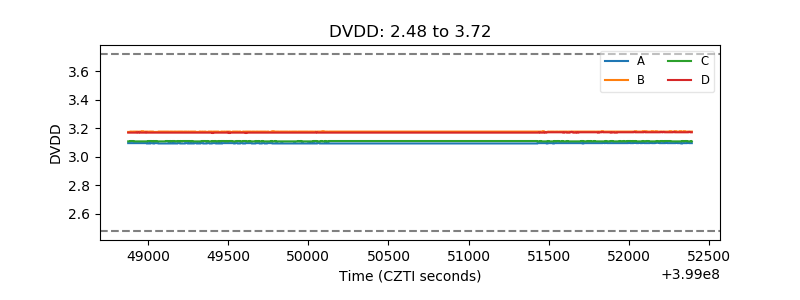 |
| Temperature 1 | 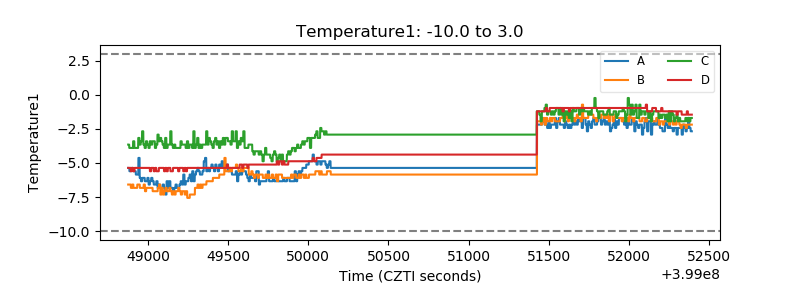 |
| Veto HV Monitor | 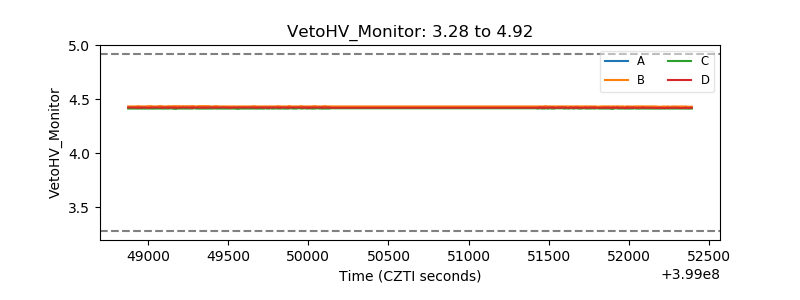 |
| Veto LLD | 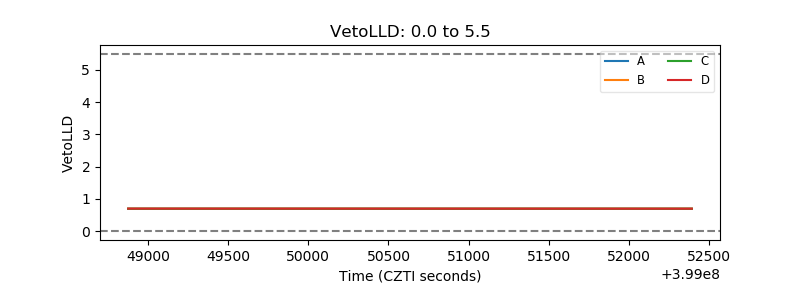 |
| Alpha Counter | 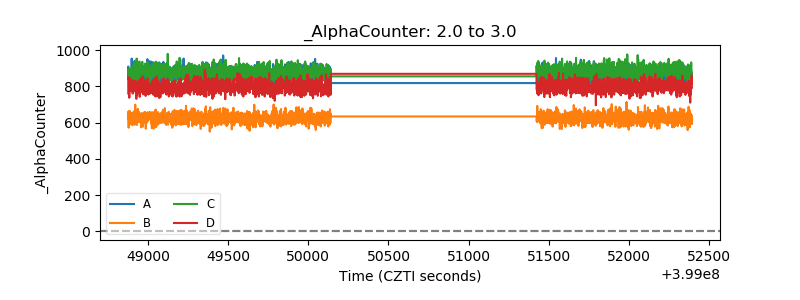 |
| _CPM_Rate | 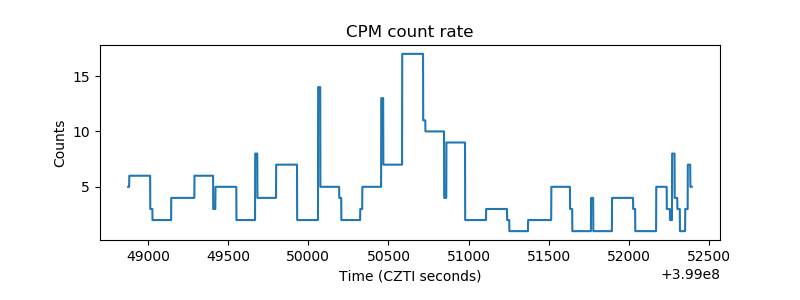 |
| CZT Counter | 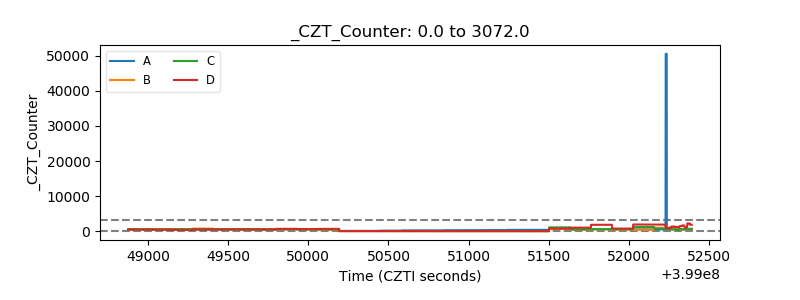 |
| +2.5 Volts monitor | 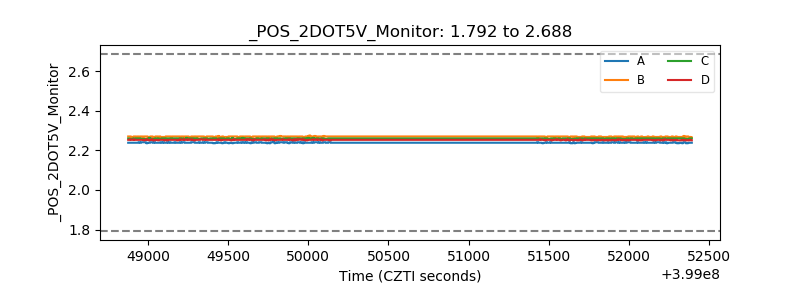 |
| +5 Volts monitor | 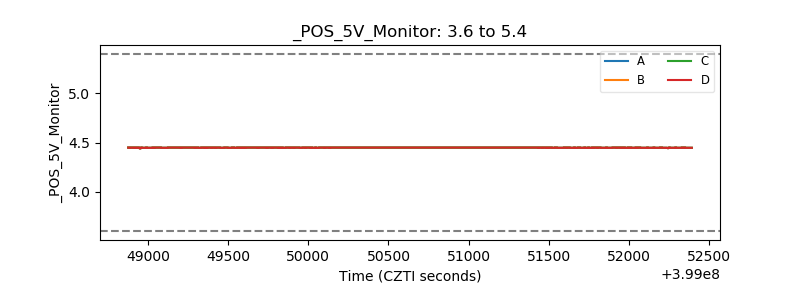 |
| _ROLL_ROT | 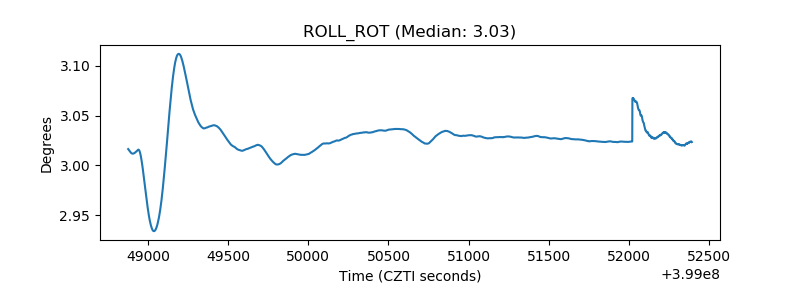 |
| _Roll_DEC | 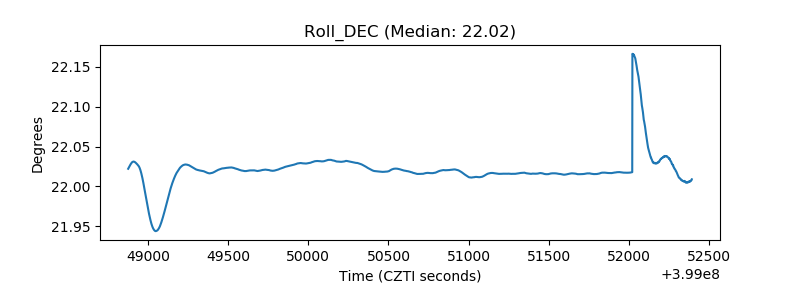 |
| _Roll_RA | 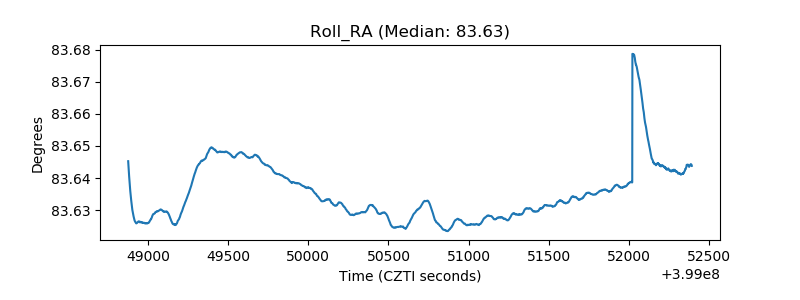 |
| Veto Counter | 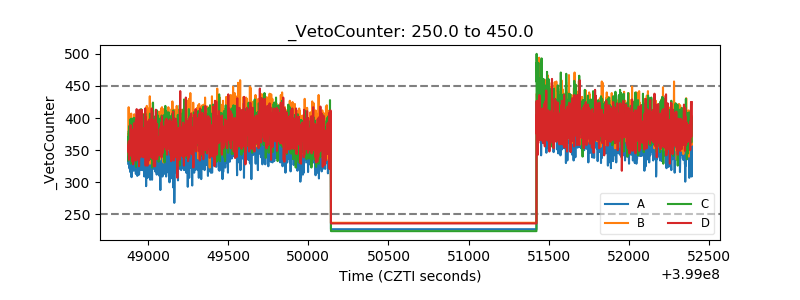 |