| Param | Original file | Final file |
|---|---|---|
| Filename | modeM0/AS1C07_014T01_9000005314_37340cztM0_level2.evt | modeM0/AS1C07_014T01_9000005314_37340cztM0_level2_quad_clean.evt |
| Size (bytes) | 749,111,040 | 109,105,920 |
| Size | 714.4 MB | 104.1 MB |
| Events in quadrant A | 4,330,971 | 696,207 |
| Events in quadrant B | 4,396,310 | 697,683 |
| Events in quadrant C | 5,979,340 | 672,393 |
| Events in quadrant D | 7,414,138 | 655,474 |
| Mode M0 | |||
|---|---|---|---|
| Quadrant | BADHDUFLAG | Total packets | Discarded packets |
| A | 0 | 18011 | 3 |
| B | 0 | 18427 | 2 |
| C | 0 | 22971 | 2 |
| D | 0 | 27776 | 2 |
| Mode M9 | |||
|---|---|---|---|
| Quadrant | BADHDUFLAG | Total packets | Discarded packets |
| A | 0 | 13 | 0 |
| B | 0 | 13 | 0 |
| C | 0 | 13 | 0 |
| D | 0 | 14 | 0 |
| Mode SS | |||
|---|---|---|---|
| Quadrant | BADHDUFLAG | Total packets | Discarded packets |
| A | 0 | 170 | 0 |
| B | 0 | 170 | 0 |
| C | 0 | 170 | 0 |
| D | 0 | 170 | 0 |
| Quadrant | Total seconds | Saturated seconds | Saturation percentage |
|---|---|---|---|
| A | 8383 | 34 | 0.405583% |
| B | 8383 | 75 | 0.894668% |
| C | 8383 | 277 | 3.304306% |
| D | 8383 | 392 | 4.676130% |
Noise dominated data is calculated using 1-second bins in cleaned event files. If a bin has >2000 counts, and if more than 50% of those come from <1% of pixels, then it is considered to be noise-dominated and hence unusable.
| Quadrant | # 1 sec bins | Bins with >0 counts | Bins with >2000 counts | High rate bins dominated by noise | Noise dominated (total time) | Noise dominated (detector-on time) | Marked lightcurve |
|---|---|---|---|---|---|---|---|
| A | 9696 | 8384 | 20 | 20 | 0.21% | 0.24% | 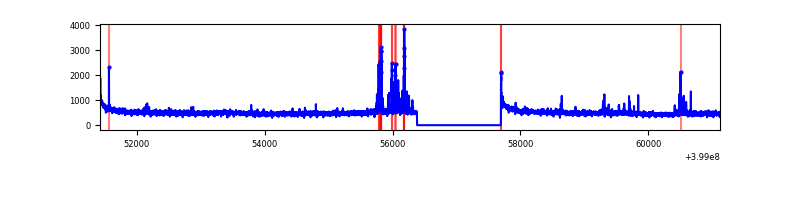 |
| B | 9696 | 8384 | 38 | 38 | 0.39% | 0.45% | 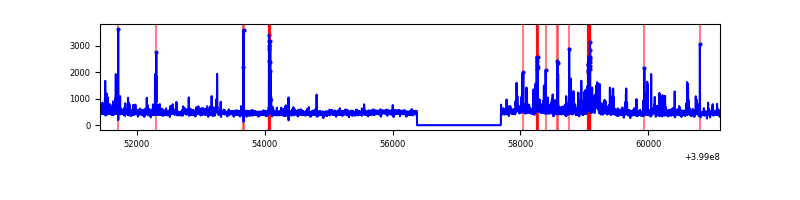 |
| C | 9696 | 8384 | 254 | 254 | 2.62% | 3.03% | 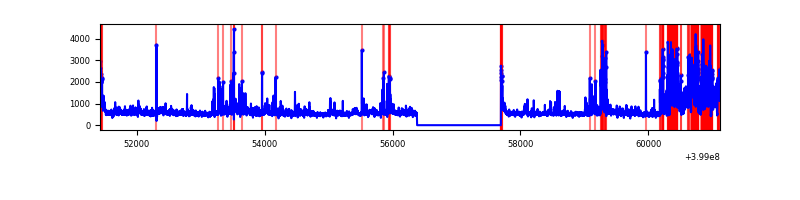 |
| D | 9696 | 8384 | 322 | 322 | 3.32% | 3.84% |  |
Top three noisy pixels from each quadrant. If the there are fewer than three noisy pixels in the level2.evt file, extra rows are filled as -1
| Pixel properties | Quadrant properties | ||||||
|---|---|---|---|---|---|---|---|
| Quadrant | DetID | PixID | Counts | Sigma | Mean | Median | Sigma |
| A | 10 | 83 | 379721 | 1927.22 | 965 | 948 | 196.5 |
| A | 13 | 248 | 167363 | 846.73 | 965 | 948 | 196.5 |
| A | 13 | 254 | 15521 | 74.15 | 965 | 948 | 196.5 |
| B | 5 | 172 | 133144 | 712.12 | 961 | 938 | 185.7 |
| B | 4 | 171 | 94438 | 503.63 | 961 | 938 | 185.7 |
| B | 0 | 229 | 64347 | 341.55 | 961 | 938 | 185.7 |
| C | 1 | 23 | 1512336 | 6928.17 | 935 | 942 | 218.2 |
| C | 15 | 214 | 346364 | 1583.4 | 935 | 942 | 218.2 |
| C | 14 | 254 | 171805 | 783.23 | 935 | 942 | 218.2 |
| D | 12 | 235 | 3148115 | 13709.88 | 927 | 901 | 229.6 |
| D | 2 | 249 | 248371 | 1078.03 | 927 | 901 | 229.6 |
| D | 13 | 249 | 117572 | 508.24 | 927 | 901 | 229.6 |
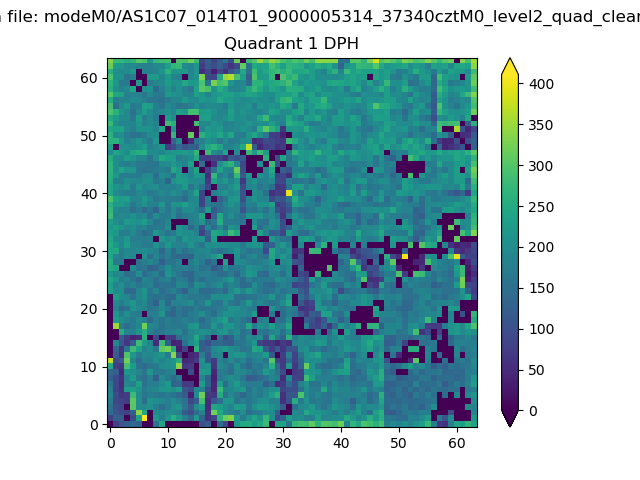
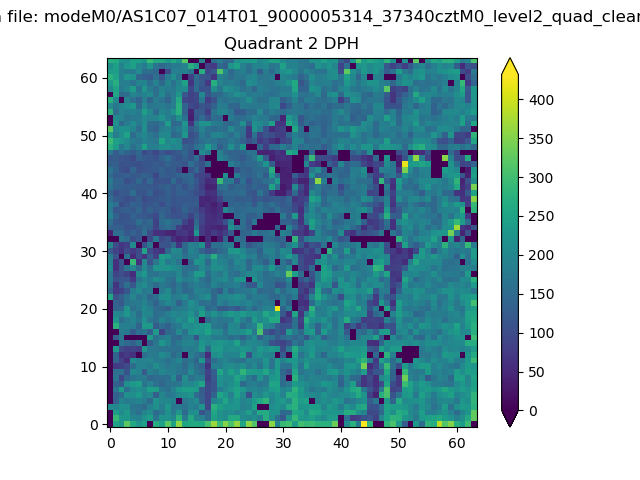
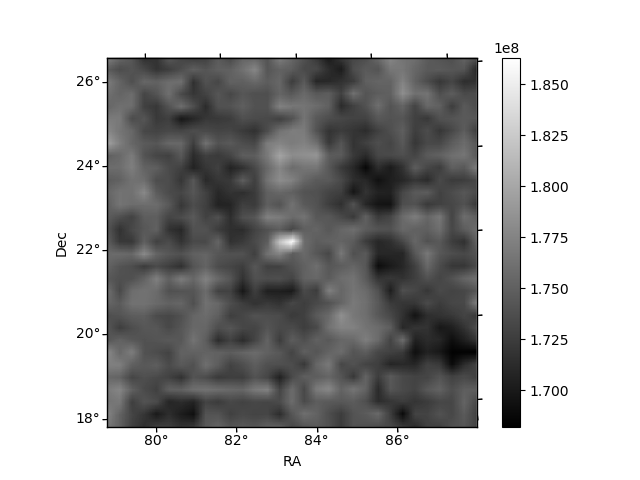
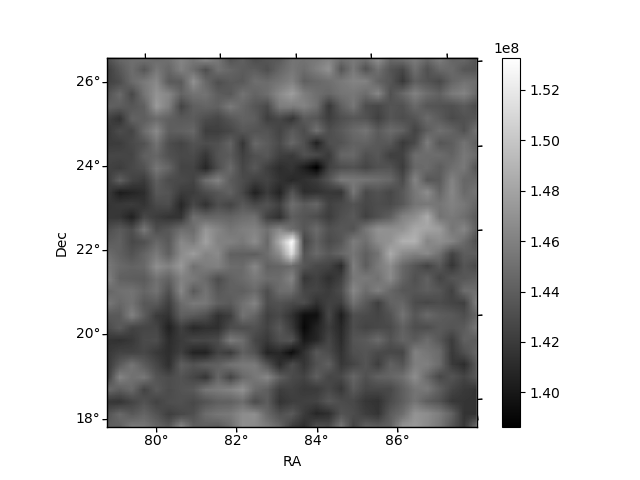
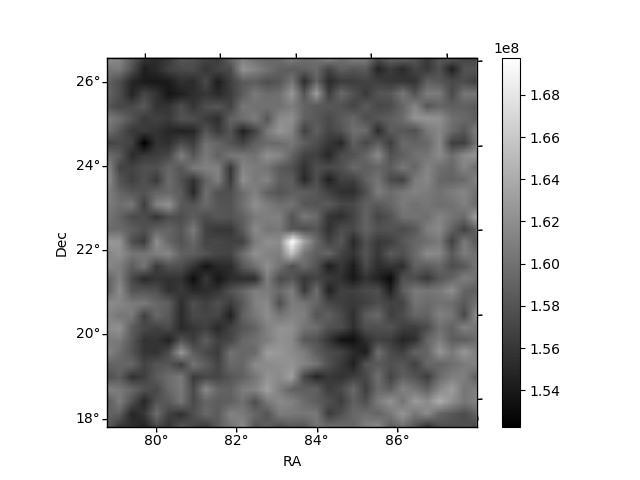
Histogram calculated using DETX and DETY for each event in the final _common_clean file
| Quadrant A | 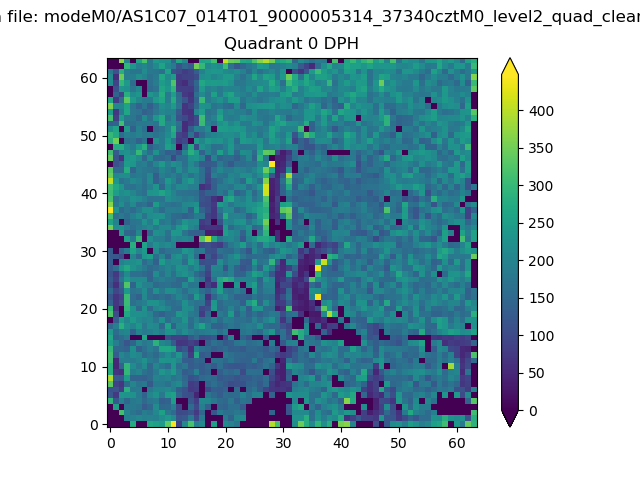 |
 |
Quadrant B |
|---|---|---|---|
| Quadrant D | 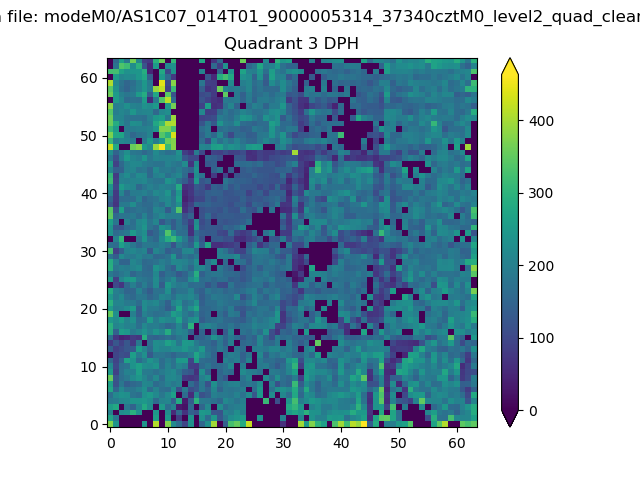 |
 |
Quadrant C |
| Plot type | Count rate plots | Images |
|---|---|---|
| Comparison with Poisson distribution Blue bars denote a histogram of data divided into 1 sec bins. Red curve is a Poisson curve with rate = median count rate of data. |
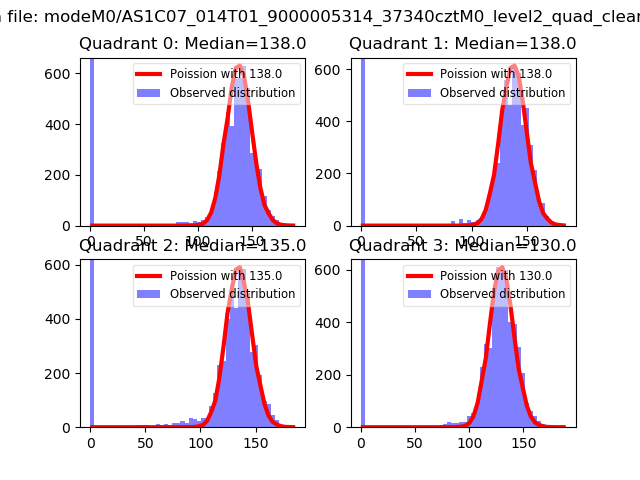 |
 |
| Quadrant-wise count rates Data is divided into 100 sec bins |
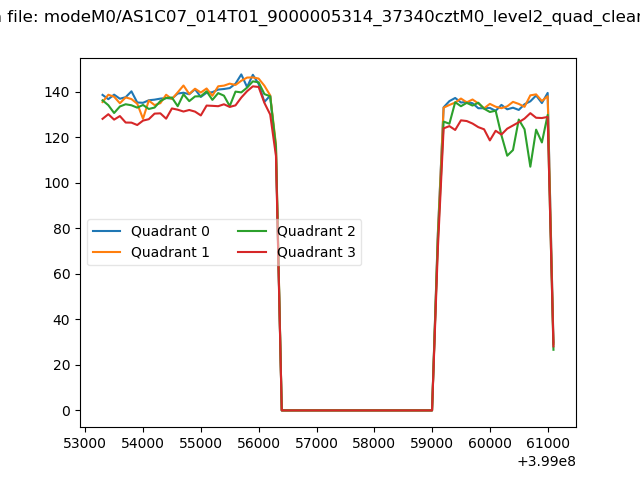 |
|
| Module-wise count rates for Quadrant A Data is divided into 100 sec bins |
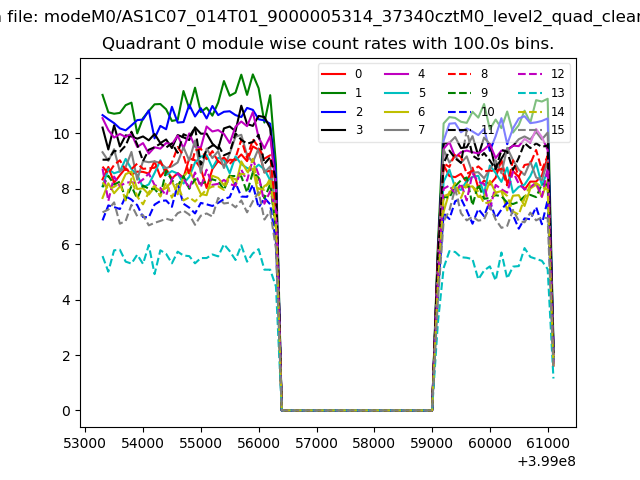 |
 |
| Module-wise count rates for Quadrant B Data is divided into 100 sec bins |
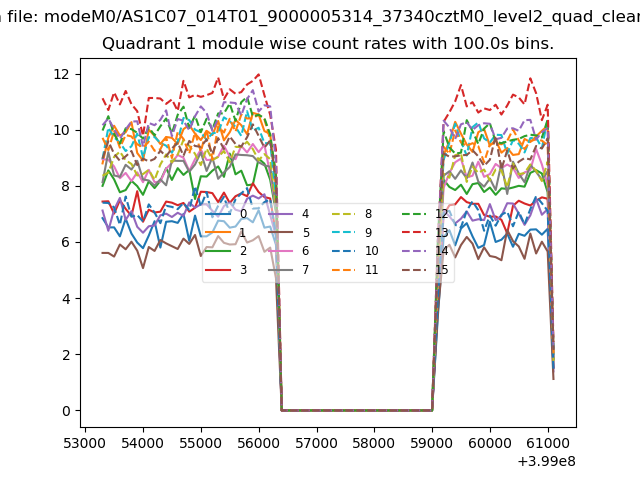 |
 |
| Module-wise count rates for Quadrant C Data is divided into 100 sec bins |
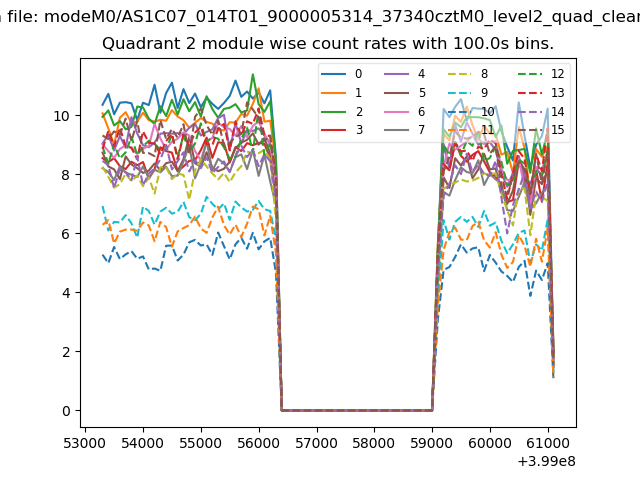 |
 |
| Module-wise count rates for Quadrant D Data is divided into 100 sec bins |
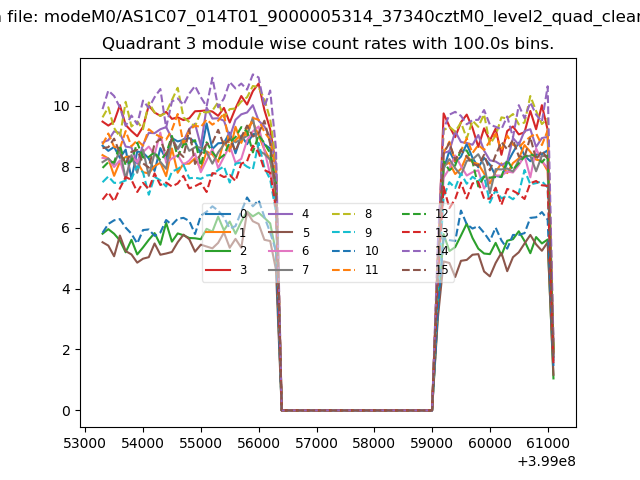 |
 |
| Parameter | Plot |
|---|---|
| CZT HV Monitor |  |
| D_VDD | 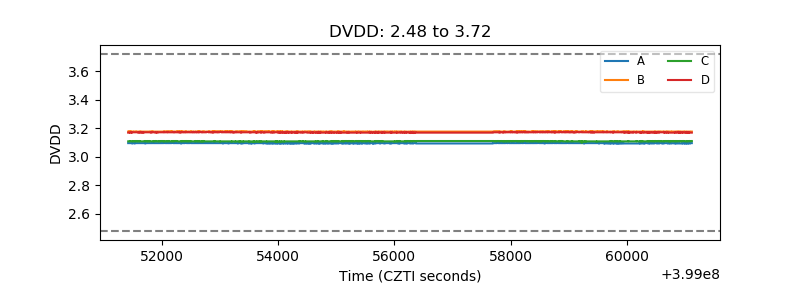 |
| Temperature 1 | 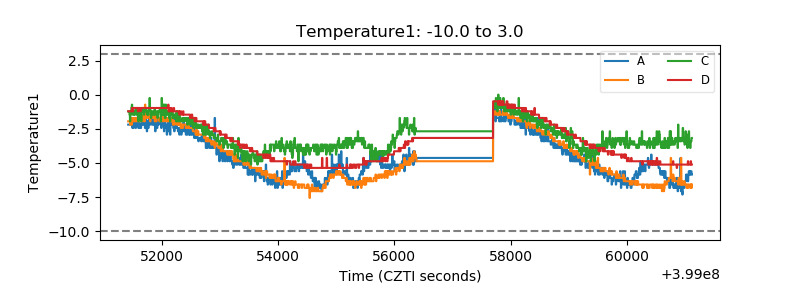 |
| Veto HV Monitor | 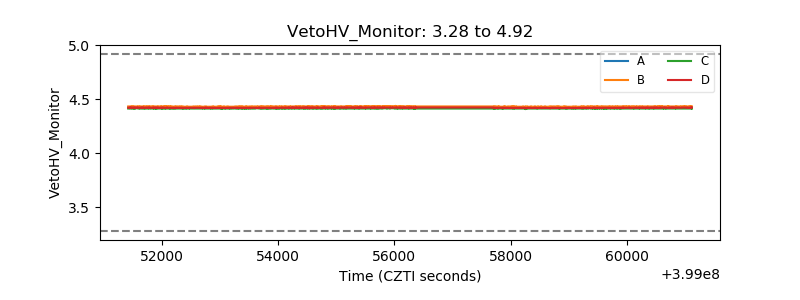 |
| Veto LLD | 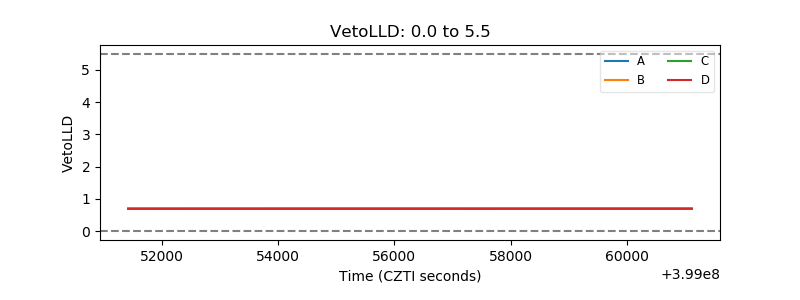 |
| Alpha Counter | 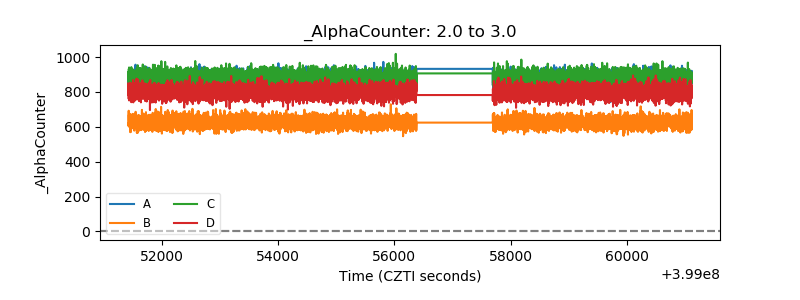 |
| _CPM_Rate | 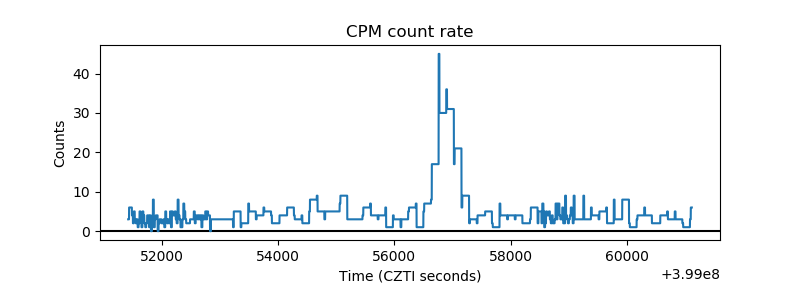 |
| CZT Counter | 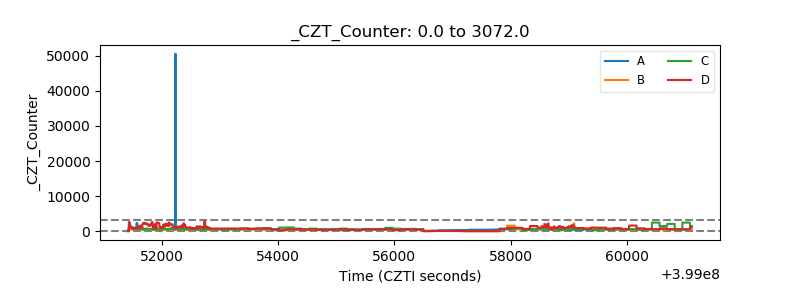 |
| +2.5 Volts monitor | 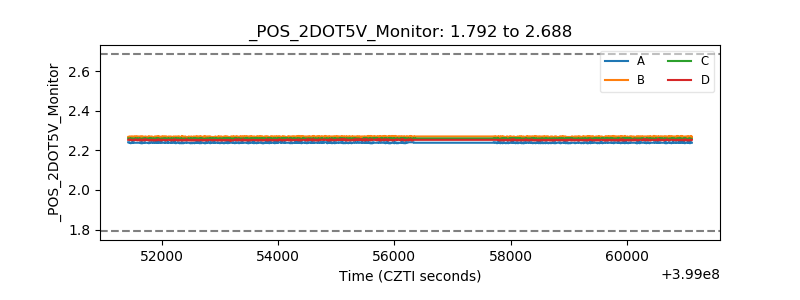 |
| +5 Volts monitor | 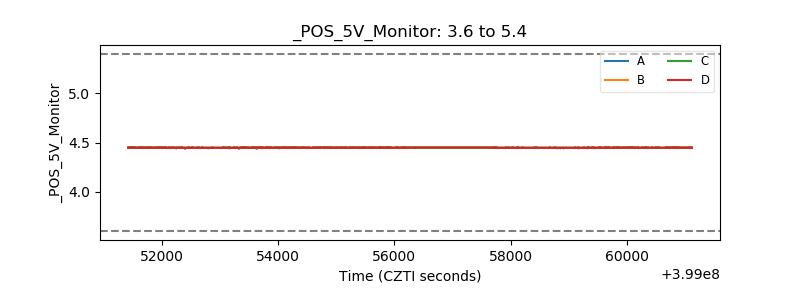 |
| _ROLL_ROT | 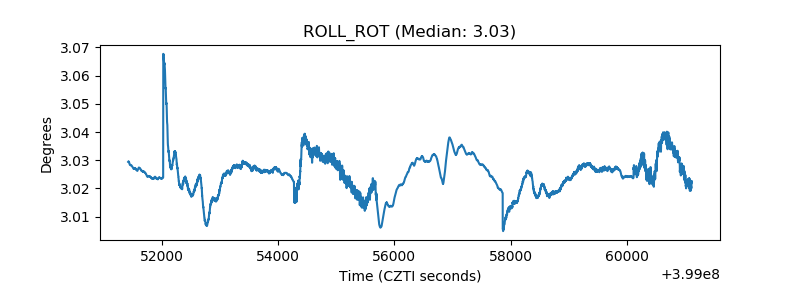 |
| _Roll_DEC | 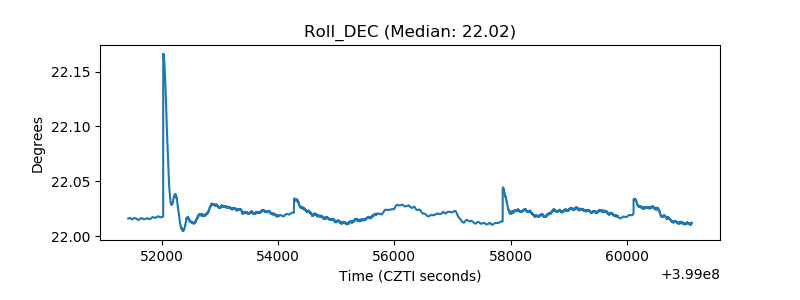 |
| _Roll_RA | 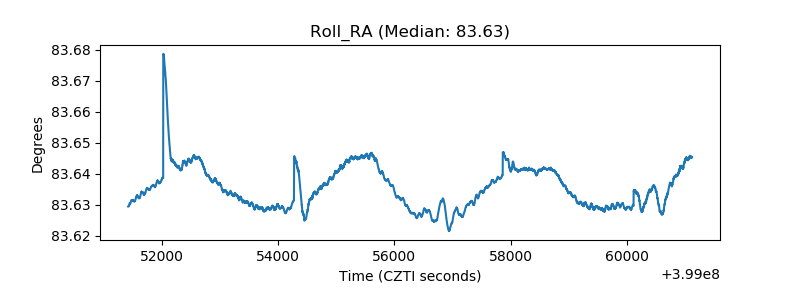 |
| Veto Counter | 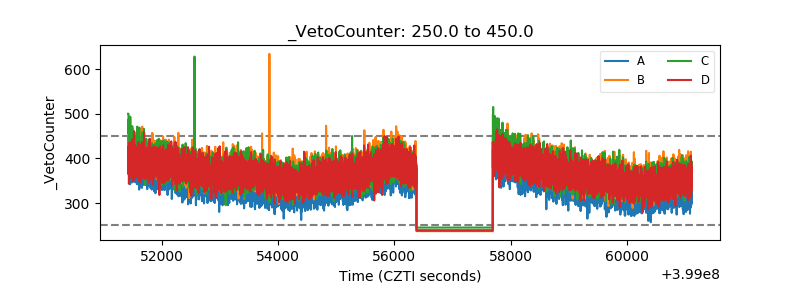 |