| Param | Original file | Final file |
|---|---|---|
| Filename | modeM0/AS1C07_014T01_9000005314_37341cztM0_level2.evt | modeM0/AS1C07_014T01_9000005314_37341cztM0_level2_quad_clean.evt |
| Size (bytes) | 762,491,520 | 113,123,520 |
| Size | 727.2 MB | 107.9 MB |
| Events in quadrant A | 4,040,672 | 777,621 |
| Events in quadrant B | 4,078,119 | 779,899 |
| Events in quadrant C | 8,580,983 | 623,597 |
| Events in quadrant D | 5,896,116 | 732,920 |
| Mode M0 | |||
|---|---|---|---|
| Quadrant | BADHDUFLAG | Total packets | Discarded packets |
| A | 0 | 16472 | 3 |
| B | 0 | 16749 | 2 |
| C | 0 | 30320 | 2 |
| D | 0 | 22408 | 2 |
| Mode M9 | |||
|---|---|---|---|
| Quadrant | BADHDUFLAG | Total packets | Discarded packets |
| A | 0 | 30 | 0 |
| B | 0 | 30 | 0 |
| C | 0 | 30 | 0 |
| D | 0 | 30 | 0 |
| Mode SS | |||
|---|---|---|---|
| Quadrant | BADHDUFLAG | Total packets | Discarded packets |
| A | 0 | 150 | 0 |
| B | 0 | 150 | 0 |
| C | 0 | 150 | 0 |
| D | 0 | 150 | 0 |
| Quadrant | Total seconds | Saturated seconds | Saturation percentage |
|---|---|---|---|
| A | 7348 | 46 | 0.626021% |
| B | 7348 | 157 | 2.136636% |
| C | 7348 | 1727 | 23.502994% |
| D | 7348 | 583 | 7.934132% |
Noise dominated data is calculated using 1-second bins in cleaned event files. If a bin has >2000 counts, and if more than 50% of those come from <1% of pixels, then it is considered to be noise-dominated and hence unusable.
| Quadrant | # 1 sec bins | Bins with >0 counts | Bins with >2000 counts | High rate bins dominated by noise | Noise dominated (total time) | Noise dominated (detector-on time) | Marked lightcurve |
|---|---|---|---|---|---|---|---|
| A | 10275 | 7350 | 28 | 28 | 0.27% | 0.38% | 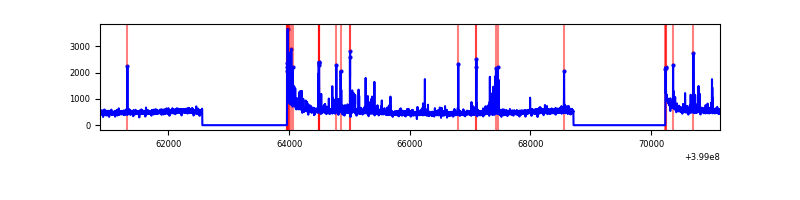 |
| B | 10275 | 7350 | 85 | 85 | 0.83% | 1.16% | 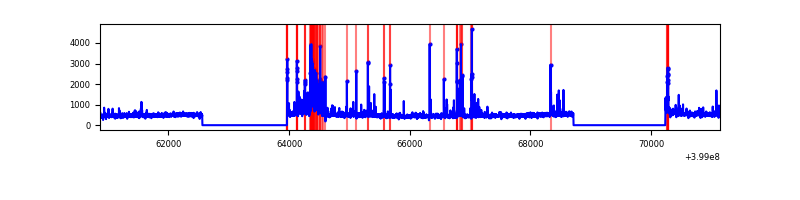 |
| C | 10275 | 7350 | 1169 | 1169 | 11.38% | 15.90% | 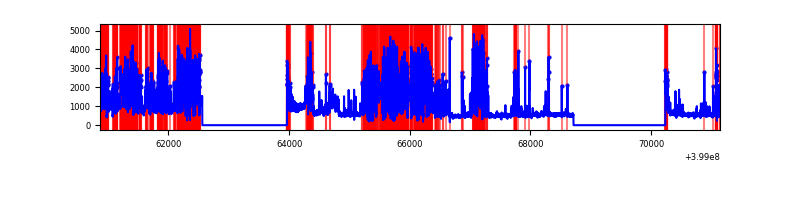 |
| D | 10275 | 7350 | 486 | 486 | 4.73% | 6.61% | 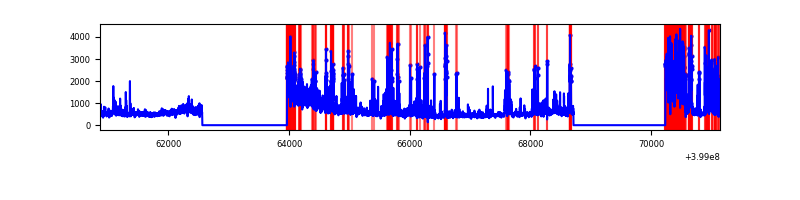 |
Top three noisy pixels from each quadrant. If the there are fewer than three noisy pixels in the level2.evt file, extra rows are filled as -1
| Pixel properties | Quadrant properties | ||||||
|---|---|---|---|---|---|---|---|
| Quadrant | DetID | PixID | Counts | Sigma | Mean | Median | Sigma |
| A | 10 | 83 | 342762 | 1926.24 | 871 | 857 | 177.5 |
| A | 7 | 16 | 130641 | 731.18 | 871 | 857 | 177.5 |
| A | 13 | 248 | 115083 | 643.53 | 871 | 857 | 177.5 |
| B | 5 | 172 | 305877 | 1832.1 | 862 | 841 | 166.5 |
| B | 5 | 255 | 218253 | 1305.82 | 862 | 841 | 166.5 |
| B | 0 | 213 | 49839 | 294.29 | 862 | 841 | 166.5 |
| C | 1 | 23 | 4205093 | 24211.46 | 741 | 750 | 173.7 |
| C | 14 | 254 | 841985 | 4844.4 | 741 | 750 | 173.7 |
| C | 15 | 214 | 271001 | 1556.29 | 741 | 750 | 173.7 |
| D | 12 | 235 | 842798 | 4153.0 | 819 | 797 | 202.7 |
| D | 12 | 227 | 806467 | 3973.81 | 819 | 797 | 202.7 |
| D | 2 | 249 | 714681 | 3521.09 | 819 | 797 | 202.7 |
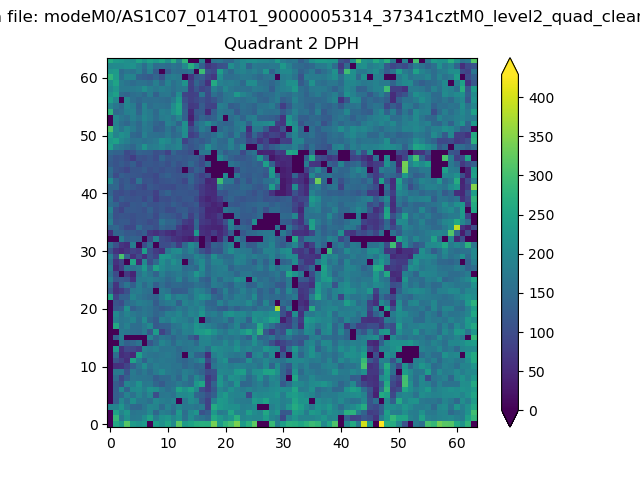
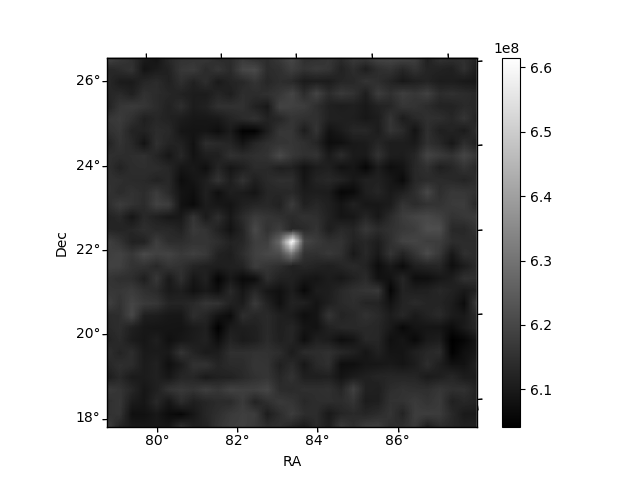
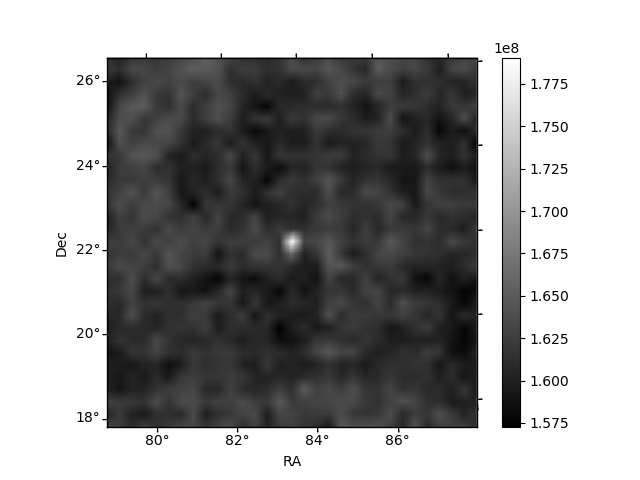
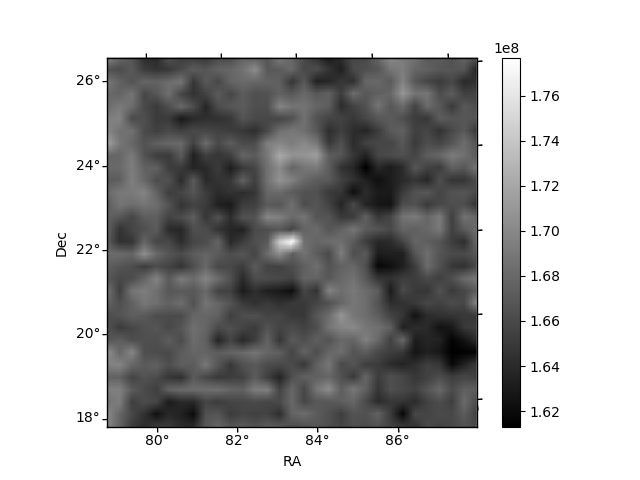
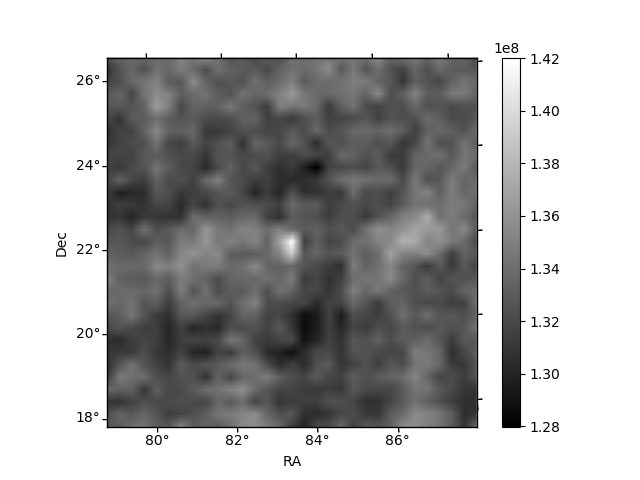
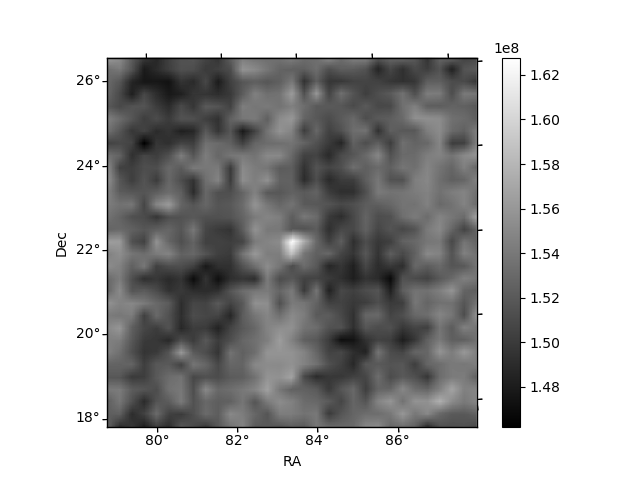
Histogram calculated using DETX and DETY for each event in the final _common_clean file
| Quadrant A | 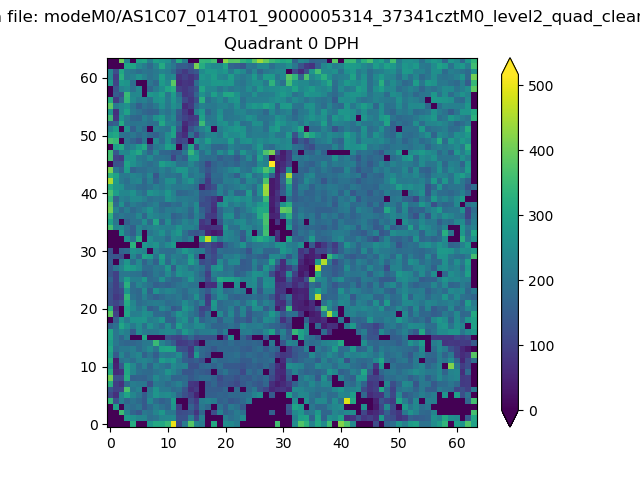 |
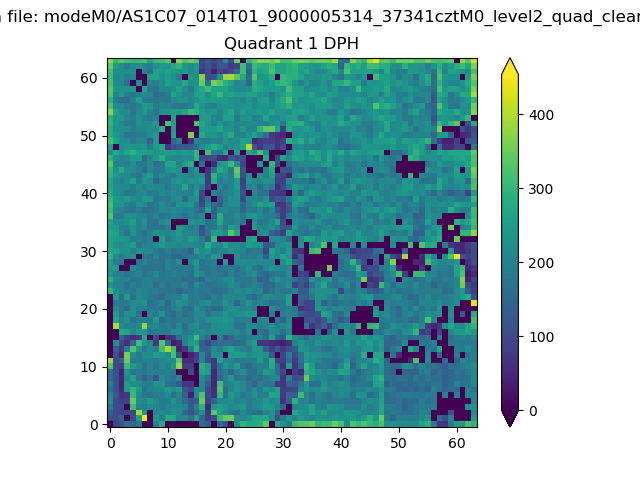 |
Quadrant B |
|---|---|---|---|
| Quadrant D | 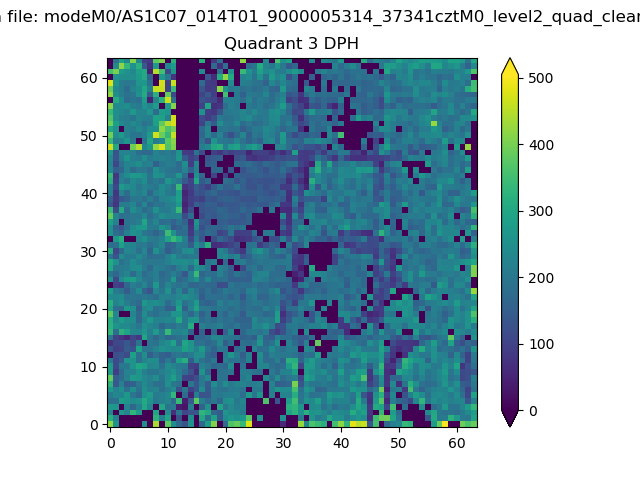 |
 |
Quadrant C |
| Plot type | Count rate plots | Images |
|---|---|---|
| Comparison with Poisson distribution Blue bars denote a histogram of data divided into 1 sec bins. Red curve is a Poisson curve with rate = median count rate of data. |
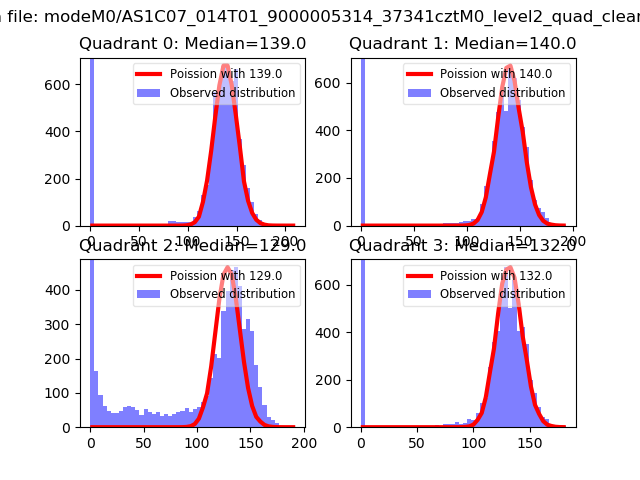 |
 |
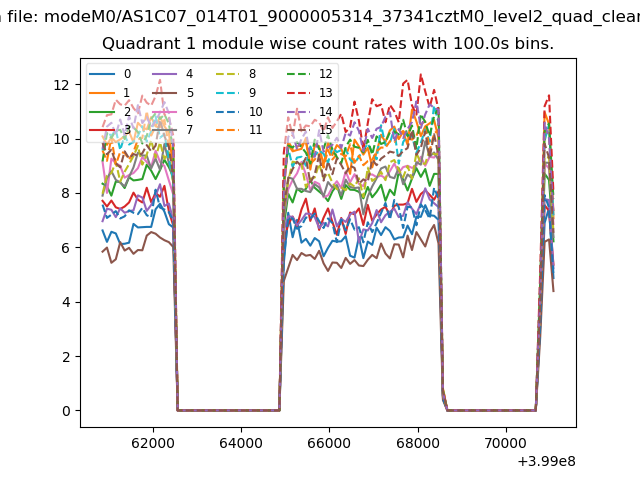
| Quadrant-wise count rates Data is divided into 100 sec bins |
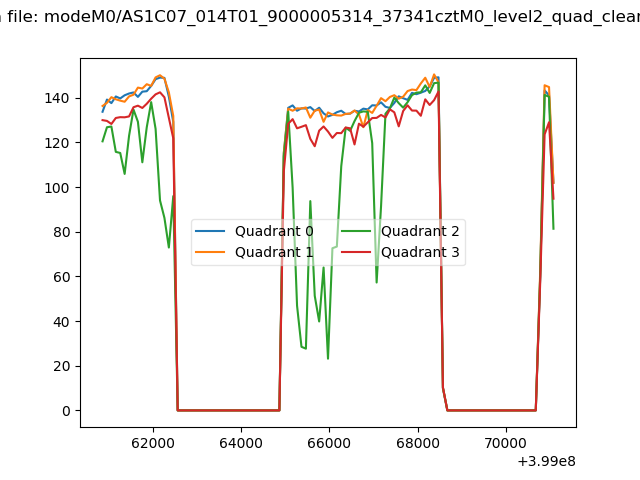 |
|
| Module-wise count rates for Quadrant A Data is divided into 100 sec bins |
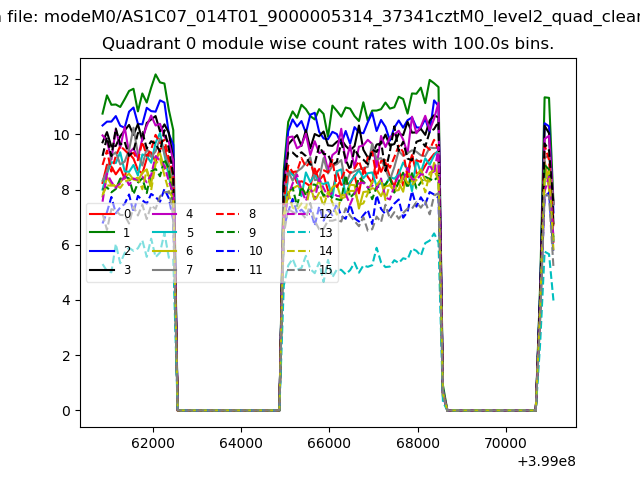 |
 |
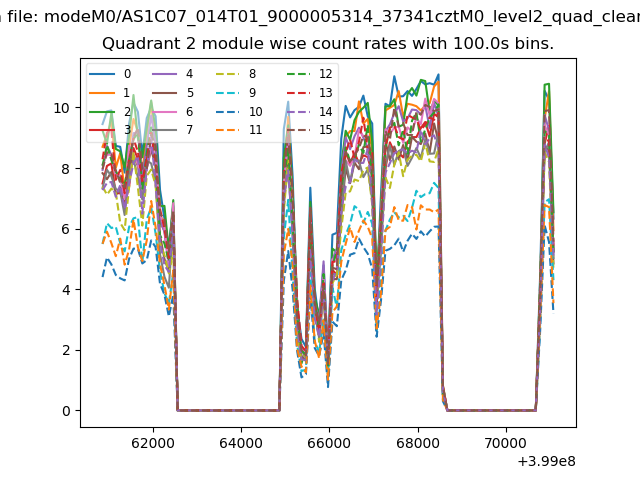
| Module-wise count rates for Quadrant B Data is divided into 100 sec bins |
 |
 |
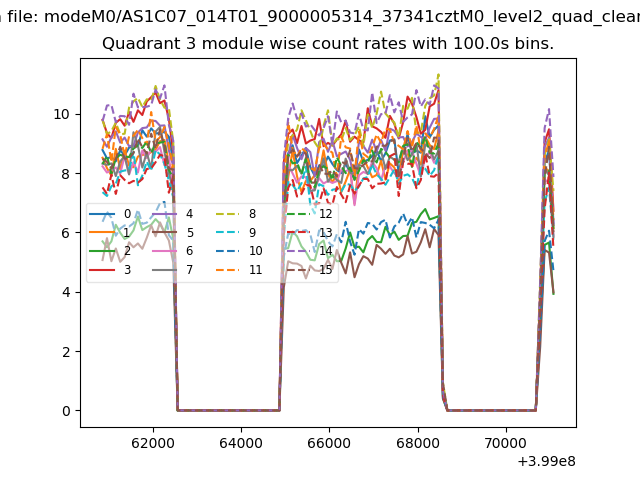
| Module-wise count rates for Quadrant C Data is divided into 100 sec bins |
 |
 |
| Module-wise count rates for Quadrant D Data is divided into 100 sec bins |
 |
 |
| Parameter | Plot |
|---|---|
| CZT HV Monitor | 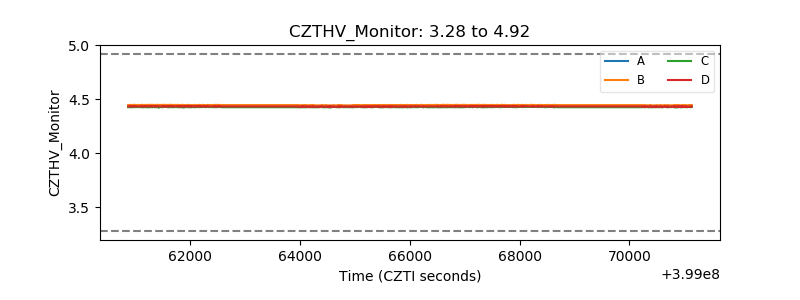 |
| D_VDD | 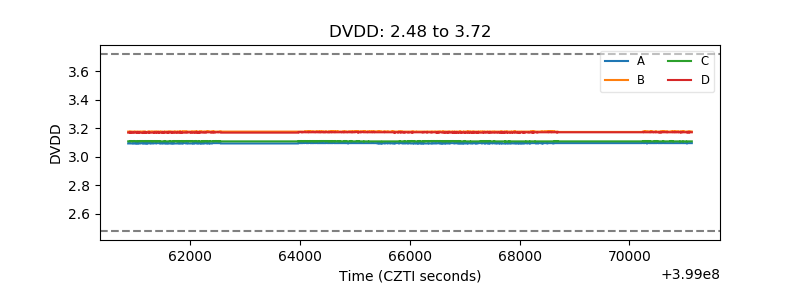 |
| Temperature 1 | 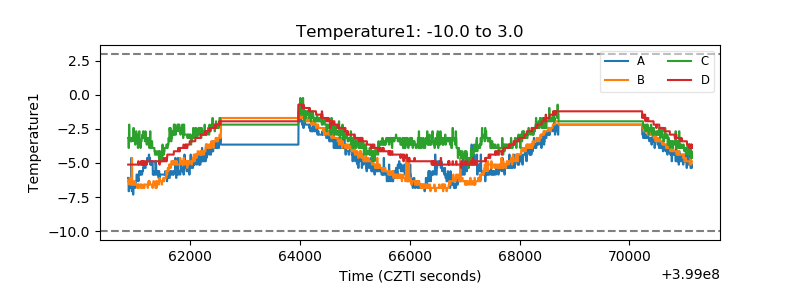 |
| Veto HV Monitor |  |
| Veto LLD | 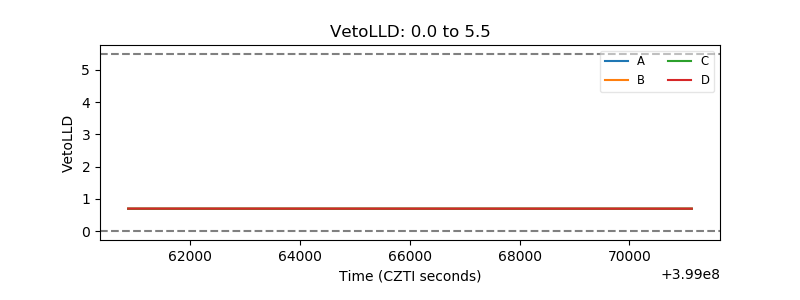 |
| Alpha Counter | 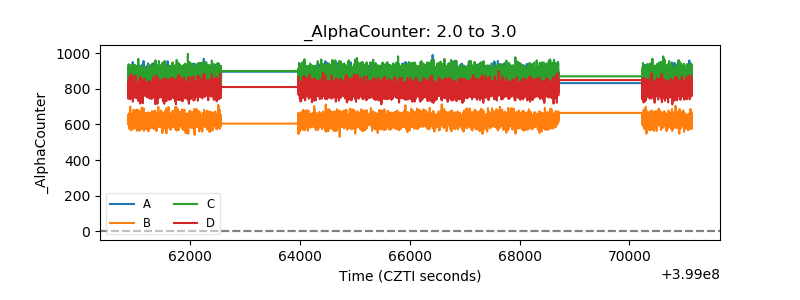 |
| _CPM_Rate | 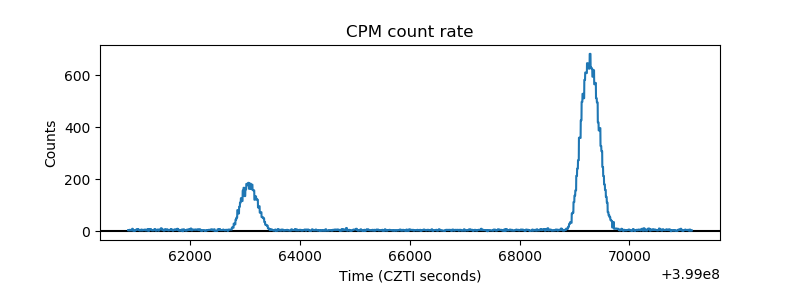 |
| CZT Counter | 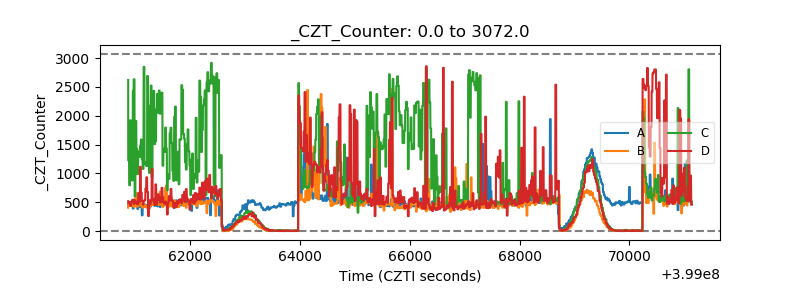 |
| +2.5 Volts monitor | 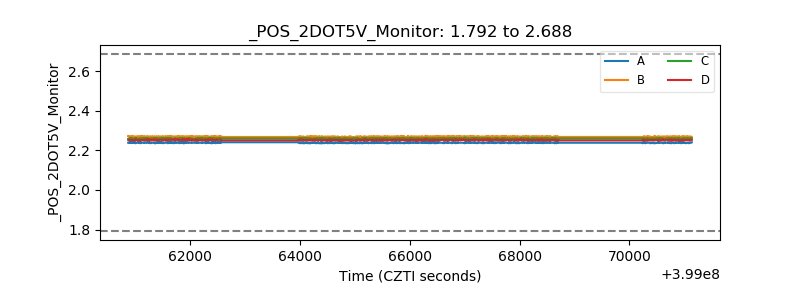 |
| +5 Volts monitor | 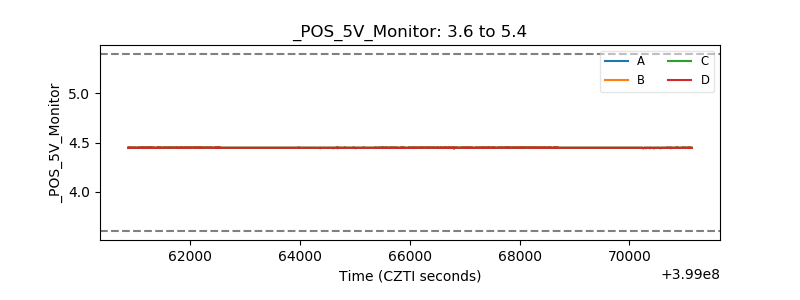 |
| _ROLL_ROT | 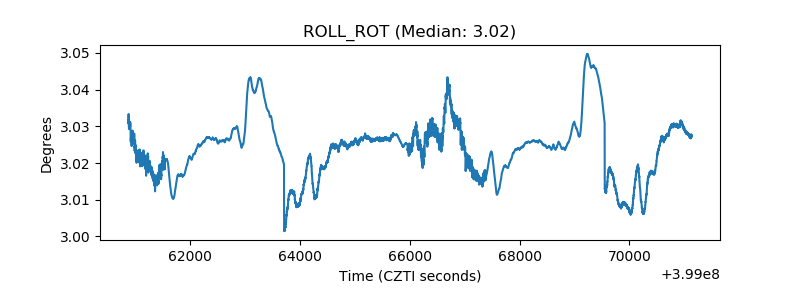 |
| _Roll_DEC | 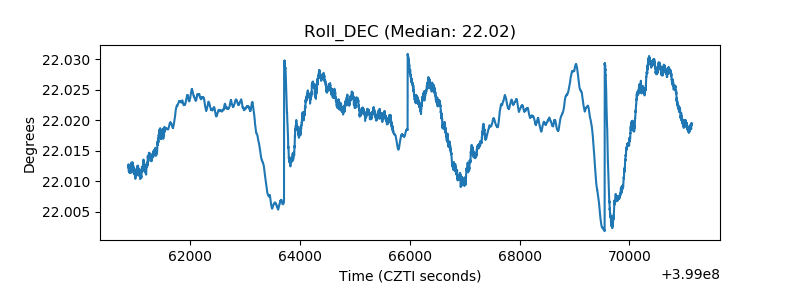 |
| _Roll_RA | 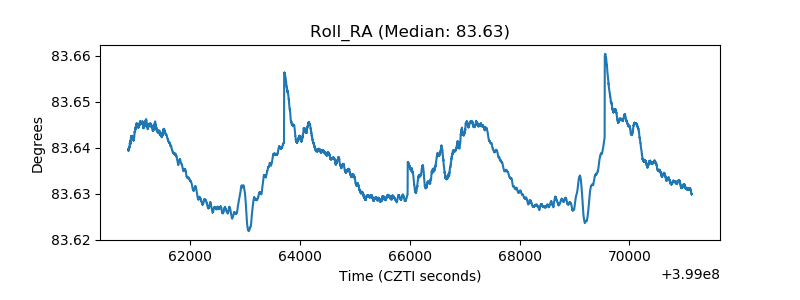 |
| Veto Counter | 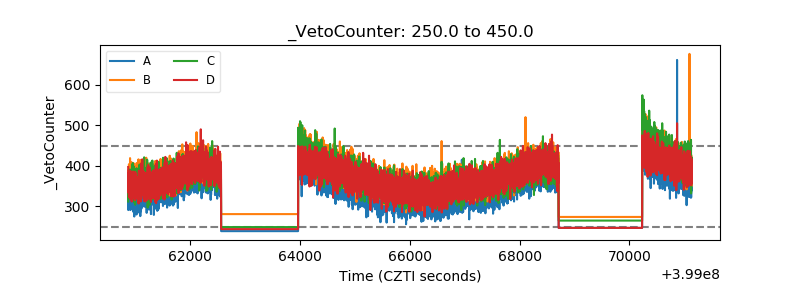 |