| Param | Original file | Final file |
|---|---|---|
| Filename | modeM0/AS1C07_014T01_9000005314_37342cztM0_level2.evt | modeM0/AS1C07_014T01_9000005314_37342cztM0_level2_quad_clean.evt |
| Size (bytes) | 479,615,040 | 89,712,000 |
| Size | 457.4 MB | 85.6 MB |
| Events in quadrant A | 2,992,240 | 599,404 |
| Events in quadrant B | 3,171,722 | 601,707 |
| Events in quadrant C | 3,511,443 | 567,136 |
| Events in quadrant D | 4,476,680 | 563,790 |
| Mode M0 | |||
|---|---|---|---|
| Quadrant | BADHDUFLAG | Total packets | Discarded packets |
| A | 0 | 12406 | 3 |
| B | 0 | 12891 | 2 |
| C | 0 | 13737 | 2 |
| D | 0 | 16980 | 2 |
| Mode M9 | |||
|---|---|---|---|
| Quadrant | BADHDUFLAG | Total packets | Discarded packets |
| A | 0 | 23 | 0 |
| B | 0 | 23 | 0 |
| C | 0 | 23 | 0 |
| D | 0 | 24 | 0 |
| Mode SS | |||
|---|---|---|---|
| Quadrant | BADHDUFLAG | Total packets | Discarded packets |
| A | 0 | 112 | 0 |
| B | 0 | 112 | 0 |
| C | 0 | 112 | 0 |
| D | 0 | 112 | 0 |
| Quadrant | Total seconds | Saturated seconds | Saturation percentage |
|---|---|---|---|
| A | 5497 | 40 | 0.727670% |
| B | 5497 | 120 | 2.183009% |
| C | 5497 | 286 | 5.202838% |
| D | 5497 | 490 | 8.913953% |
Noise dominated data is calculated using 1-second bins in cleaned event files. If a bin has >2000 counts, and if more than 50% of those come from <1% of pixels, then it is considered to be noise-dominated and hence unusable.
| Quadrant | # 1 sec bins | Bins with >0 counts | Bins with >2000 counts | High rate bins dominated by noise | Noise dominated (total time) | Noise dominated (detector-on time) | Marked lightcurve |
|---|---|---|---|---|---|---|---|
| A | 7140 | 5498 | 19 | 19 | 0.27% | 0.35% | 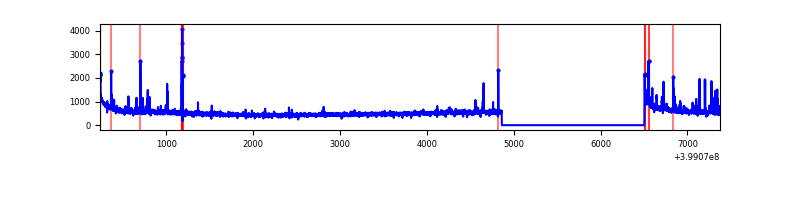 |
| B | 7140 | 5498 | 76 | 76 | 1.06% | 1.38% | 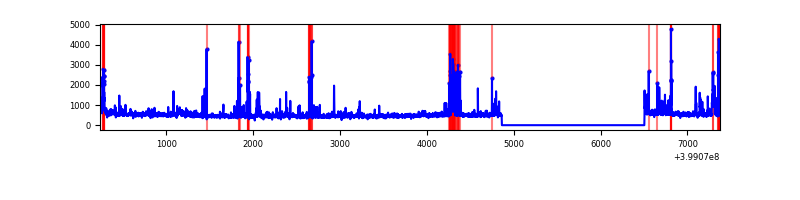 |
| C | 7140 | 5498 | 127 | 127 | 1.78% | 2.31% | 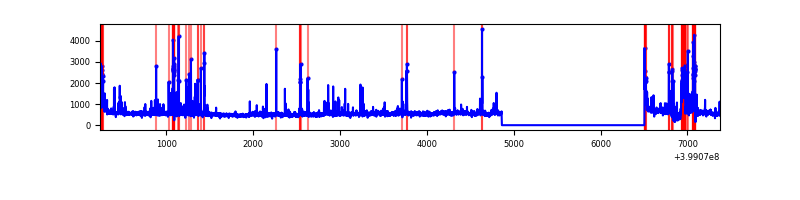 |
| D | 7140 | 5498 | 404 | 404 | 5.66% | 7.35% | 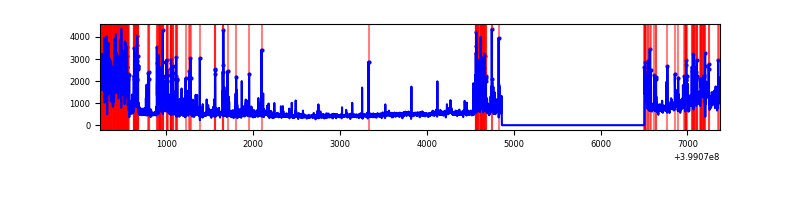 |
Top three noisy pixels from each quadrant. If the there are fewer than three noisy pixels in the level2.evt file, extra rows are filled as -1
| Pixel properties | Quadrant properties | ||||||
|---|---|---|---|---|---|---|---|
| Quadrant | DetID | PixID | Counts | Sigma | Mean | Median | Sigma |
| A | 10 | 83 | 289082 | 2173.53 | 651 | 642 | 132.7 |
| A | 13 | 248 | 79449 | 593.85 | 651 | 642 | 132.7 |
| A | 15 | 237 | 62652 | 467.27 | 651 | 642 | 132.7 |
| B | 5 | 172 | 244656 | 1918.26 | 649 | 632 | 127.2 |
| B | 4 | 171 | 127803 | 999.68 | 649 | 632 | 127.2 |
| B | 5 | 255 | 70627 | 550.23 | 649 | 632 | 127.2 |
| C | 14 | 254 | 523056 | 3604.89 | 613 | 620 | 144.9 |
| C | 15 | 214 | 223923 | 1540.83 | 613 | 620 | 144.9 |
| C | 3 | 233 | 173874 | 1195.48 | 613 | 620 | 144.9 |
| D | 12 | 227 | 720712 | 4732.49 | 610 | 592 | 152.2 |
| D | 12 | 235 | 598489 | 3929.27 | 610 | 592 | 152.2 |
| D | 2 | 249 | 465753 | 3056.95 | 610 | 592 | 152.2 |
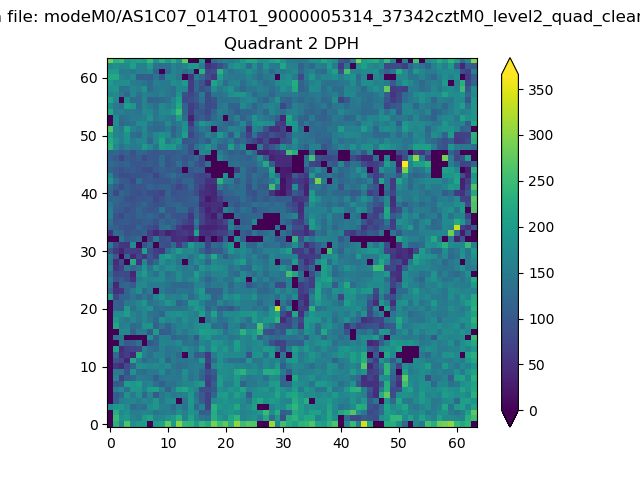
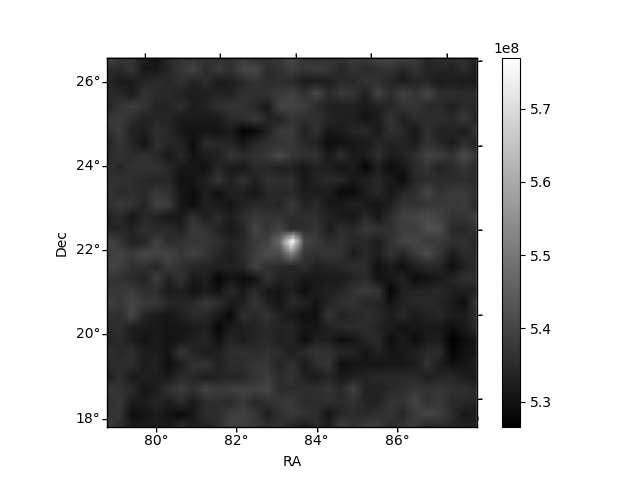
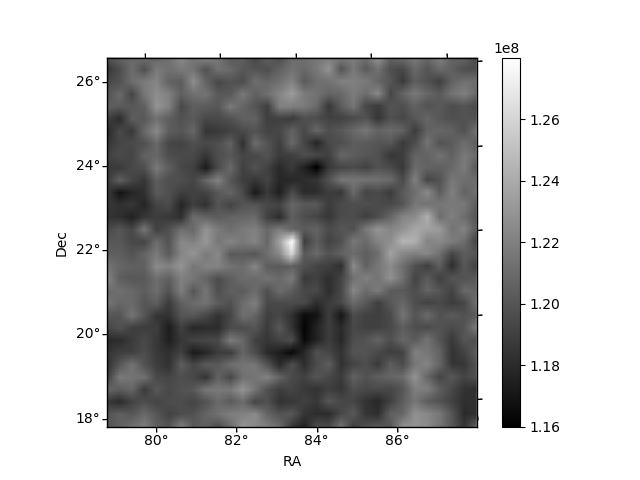
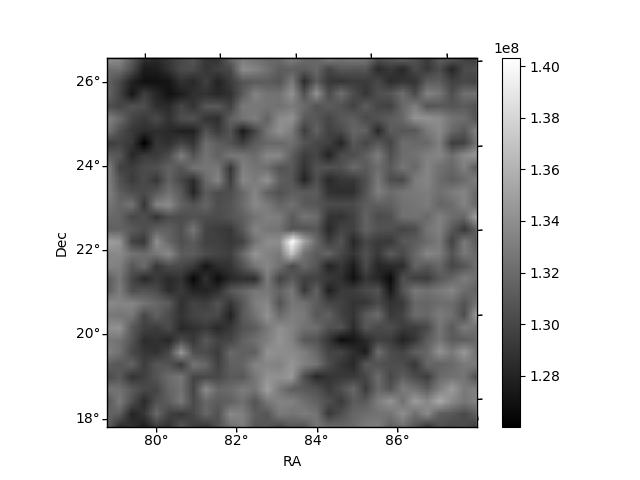
Histogram calculated using DETX and DETY for each event in the final _common_clean file
| Quadrant A | 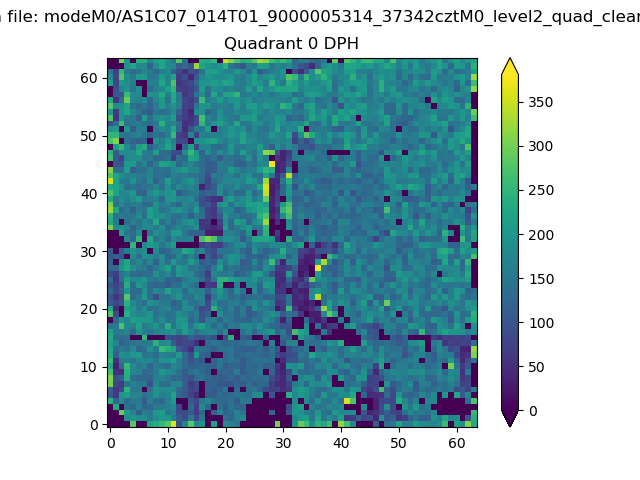 |
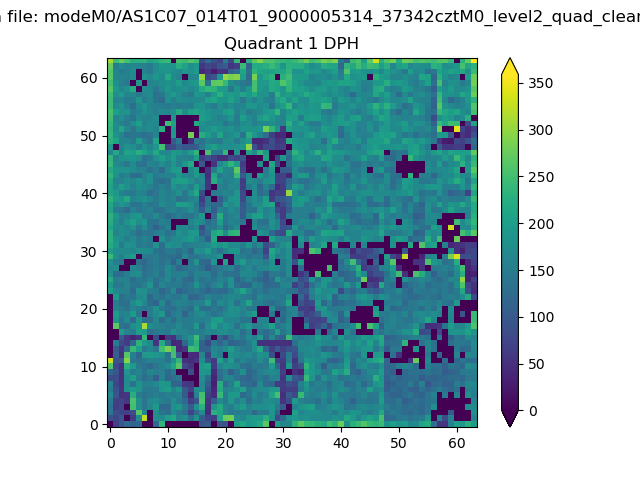 |
Quadrant B |
|---|---|---|---|
| Quadrant D | 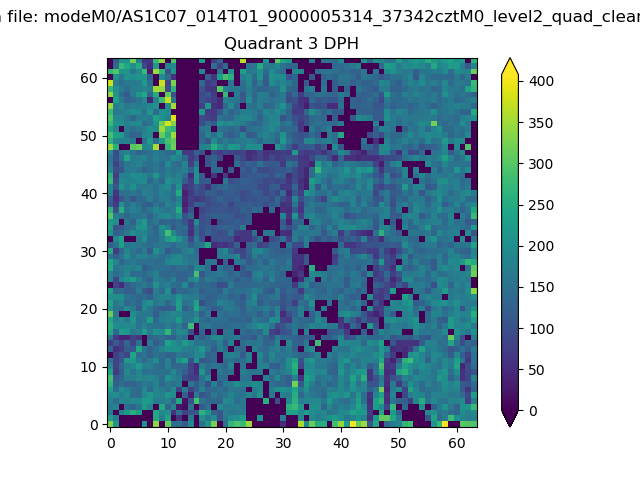 |
 |
Quadrant C |
| Plot type | Count rate plots | Images |
|---|---|---|
| Comparison with Poisson distribution Blue bars denote a histogram of data divided into 1 sec bins. Red curve is a Poisson curve with rate = median count rate of data. |
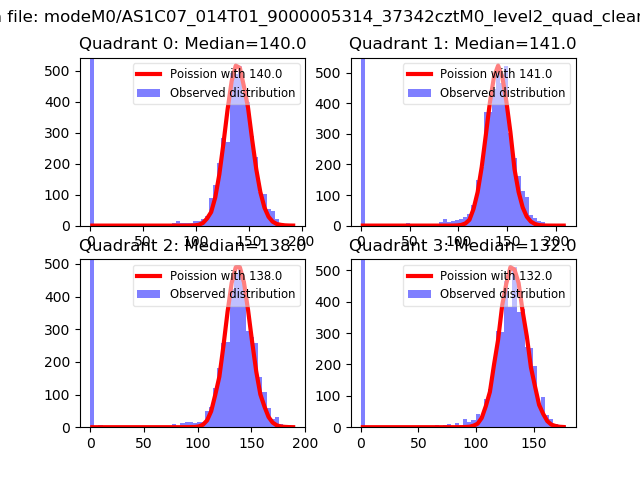 |
 |
| Quadrant-wise count rates Data is divided into 100 sec bins |
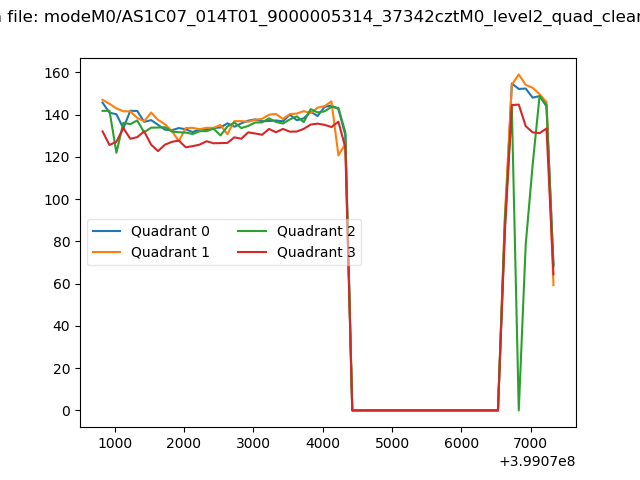 |
|
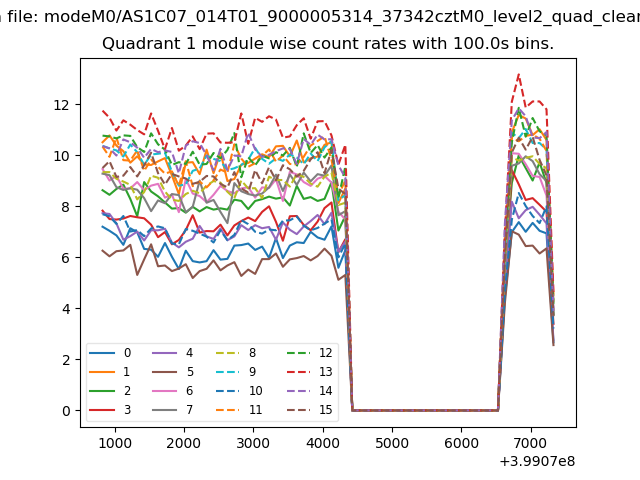
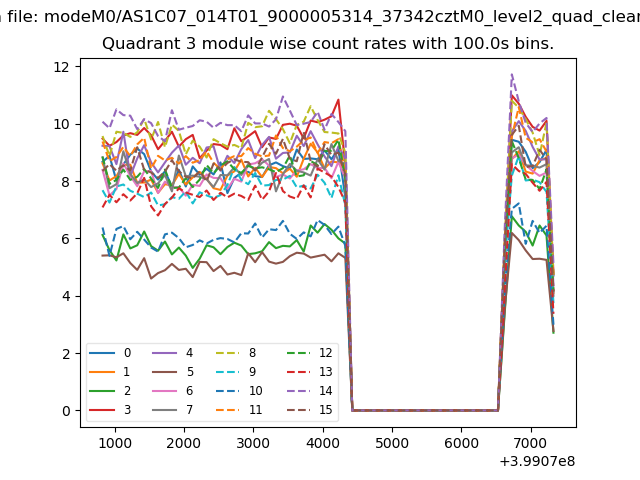
| Module-wise count rates for Quadrant A Data is divided into 100 sec bins |
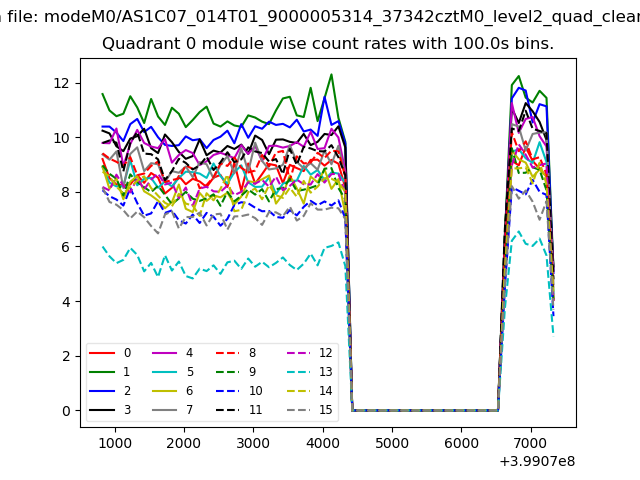 |
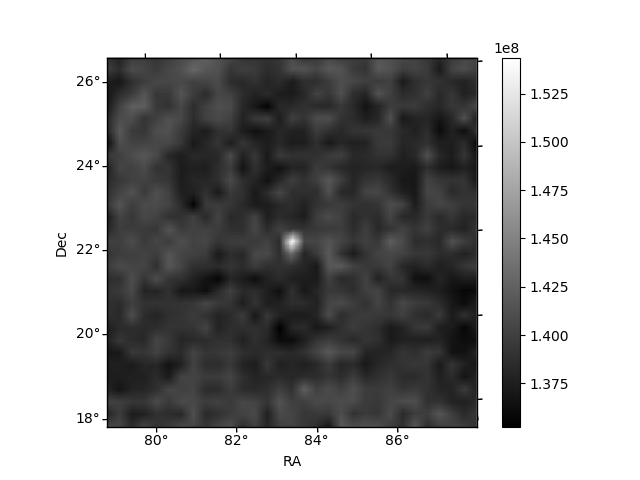 |
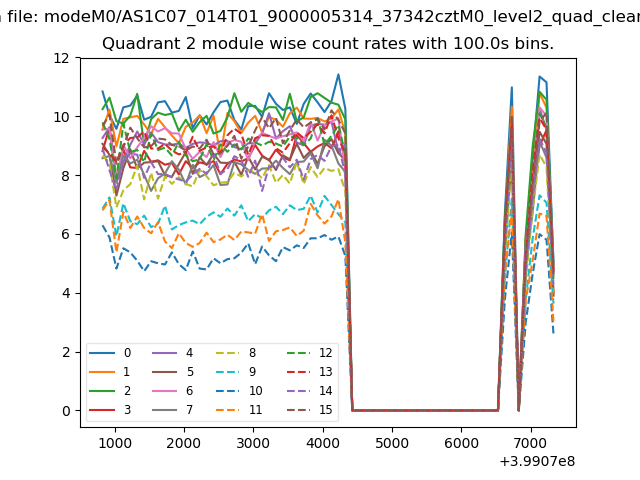
| Module-wise count rates for Quadrant B Data is divided into 100 sec bins |
 |
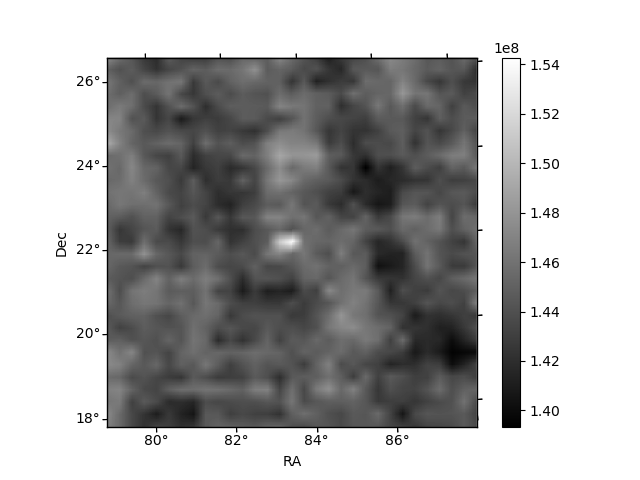 |
| Module-wise count rates for Quadrant C Data is divided into 100 sec bins |
 |
 |
| Module-wise count rates for Quadrant D Data is divided into 100 sec bins |
 |
 |
| Parameter | Plot |
|---|---|
| CZT HV Monitor | 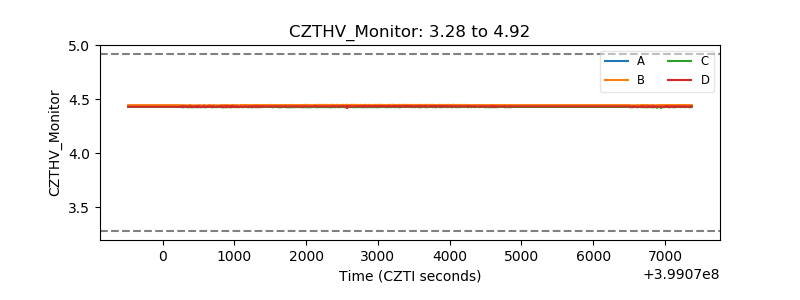 |
| D_VDD |  |
| Temperature 1 | 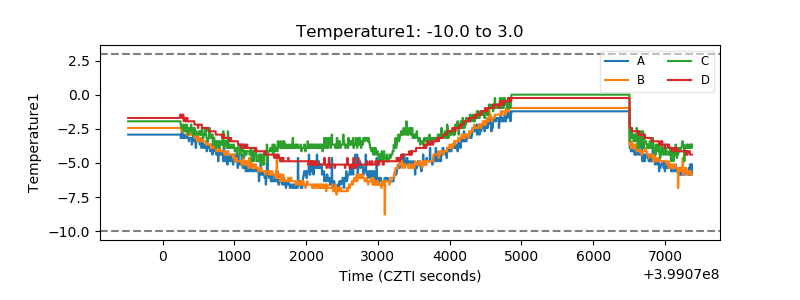 |
| Veto HV Monitor |  |
| Veto LLD | 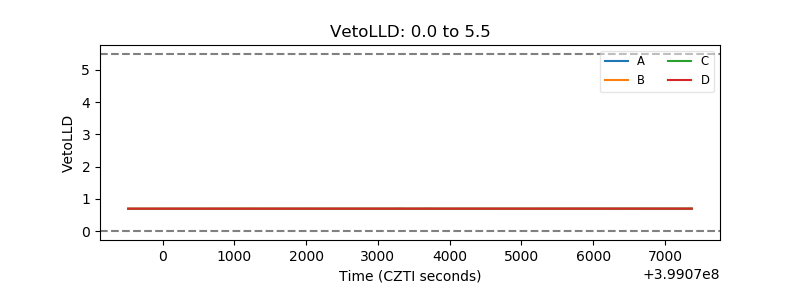 |
| Alpha Counter | 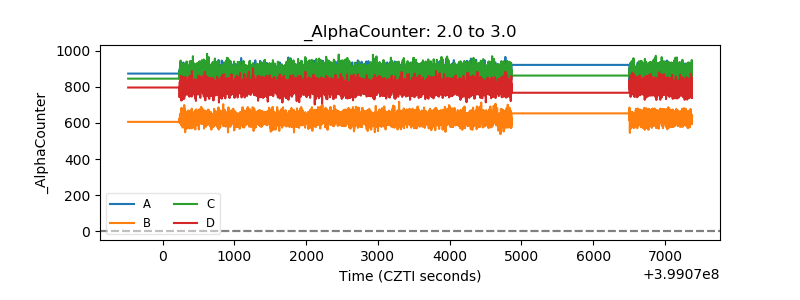 |
| _CPM_Rate | 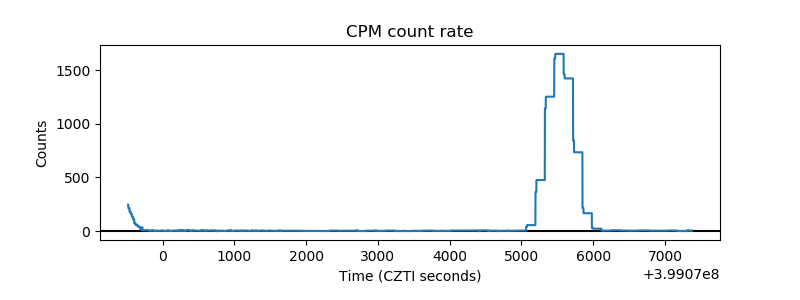 |
| CZT Counter | 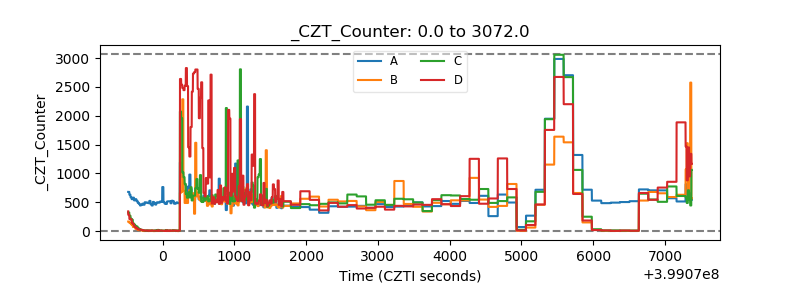 |
| +2.5 Volts monitor | 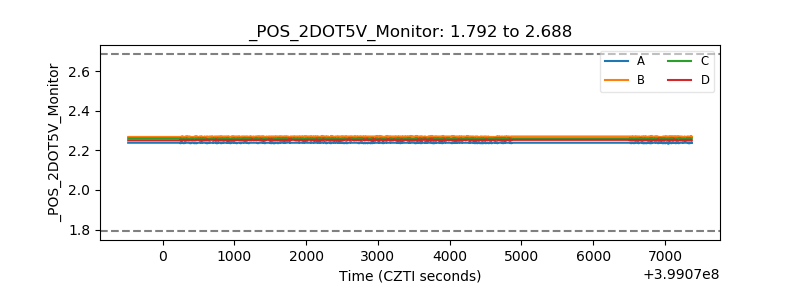 |
| +5 Volts monitor | 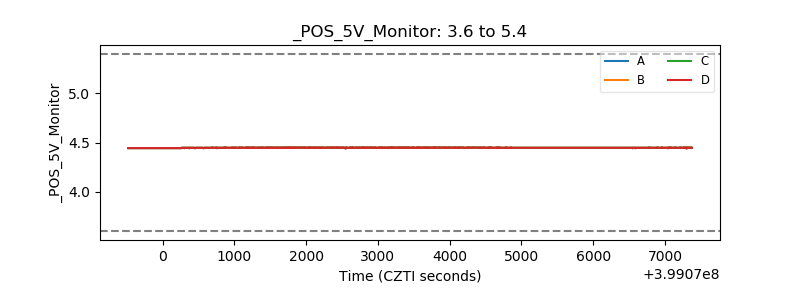 |
| _ROLL_ROT | 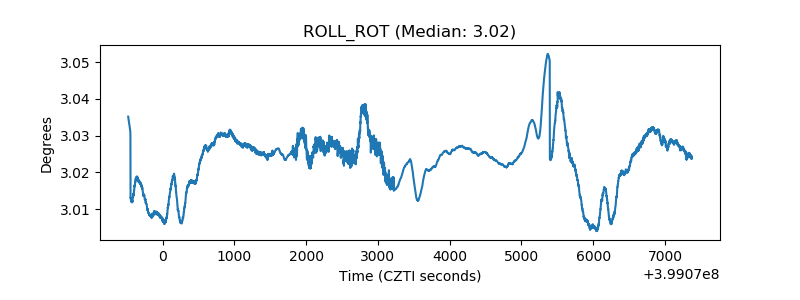 |
| _Roll_DEC | 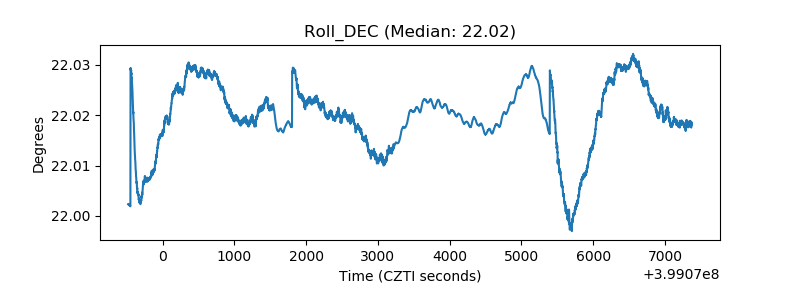 |
| _Roll_RA | 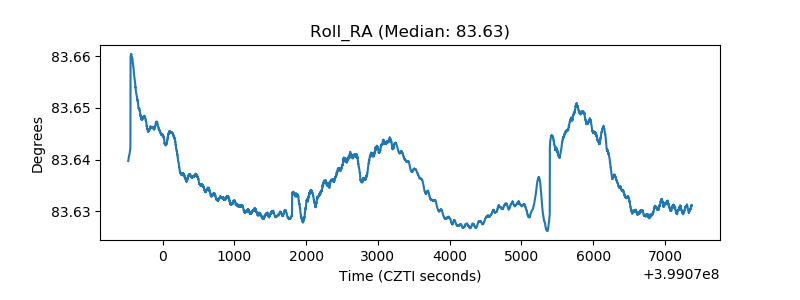 |
| Veto Counter | 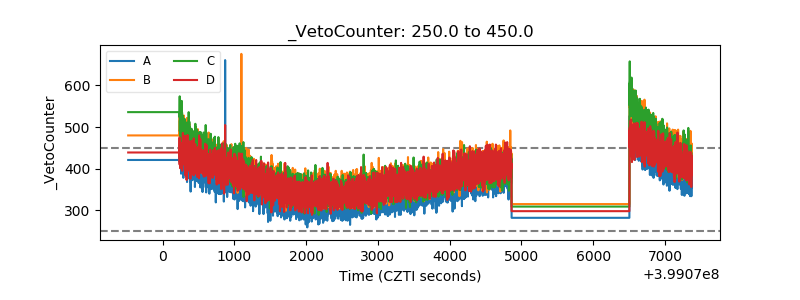 |