| Param | Original file | Final file |
|---|---|---|
| Filename | modeM0/AS1C07_014T01_9000005314_37344cztM0_level2.evt | modeM0/AS1C07_014T01_9000005314_37344cztM0_level2_quad_clean.evt |
| Size (bytes) | 520,251,840 | 95,820,480 |
| Size | 496.2 MB | 91.4 MB |
| Events in quadrant A | 3,089,678 | 647,357 |
| Events in quadrant B | 3,414,188 | 654,033 |
| Events in quadrant C | 3,513,189 | 619,934 |
| Events in quadrant D | 5,363,571 | 592,631 |
| Mode M0 | |||
|---|---|---|---|
| Quadrant | BADHDUFLAG | Total packets | Discarded packets |
| A | 0 | 12689 | 3 |
| B | 0 | 13645 | 2 |
| C | 0 | 13835 | 2 |
| D | 0 | 19839 | 2 |
| Mode M9 | |||
|---|---|---|---|
| Quadrant | BADHDUFLAG | Total packets | Discarded packets |
| A | 0 | 34 | 0 |
| B | 0 | 34 | 0 |
| C | 0 | 34 | 0 |
| D | 0 | 34 | 0 |
| Mode SS | |||
|---|---|---|---|
| Quadrant | BADHDUFLAG | Total packets | Discarded packets |
| A | 0 | 116 | 0 |
| B | 0 | 116 | 0 |
| C | 0 | 116 | 0 |
| D | 0 | 116 | 0 |
| Quadrant | Total seconds | Saturated seconds | Saturation percentage |
|---|---|---|---|
| A | 5537 | 51 | 0.921076% |
| B | 5537 | 170 | 3.070255% |
| C | 5537 | 274 | 4.948528% |
| D | 5537 | 300 | 5.418096% |
Noise dominated data is calculated using 1-second bins in cleaned event files. If a bin has >2000 counts, and if more than 50% of those come from <1% of pixels, then it is considered to be noise-dominated and hence unusable.
| Quadrant | # 1 sec bins | Bins with >0 counts | Bins with >2000 counts | High rate bins dominated by noise | Noise dominated (total time) | Noise dominated (detector-on time) | Marked lightcurve |
|---|---|---|---|---|---|---|---|
| A | 8973 | 5539 | 27 | 27 | 0.30% | 0.49% | 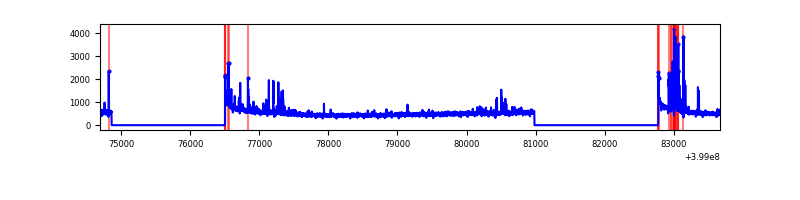 |
| B | 8973 | 5539 | 113 | 113 | 1.26% | 2.04% | 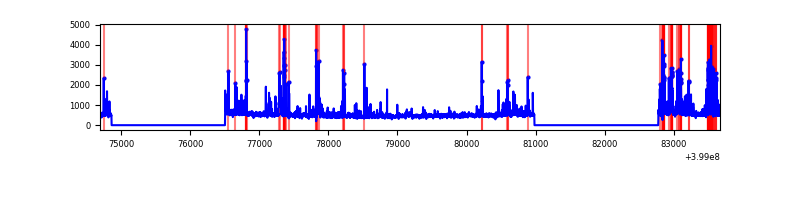 |
| C | 8973 | 5539 | 115 | 115 | 1.28% | 2.08% | 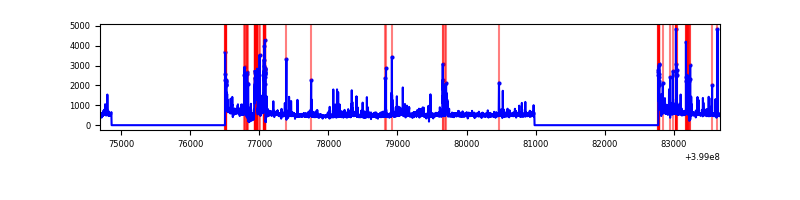 |
| D | 8973 | 5539 | 237 | 237 | 2.64% | 4.28% | 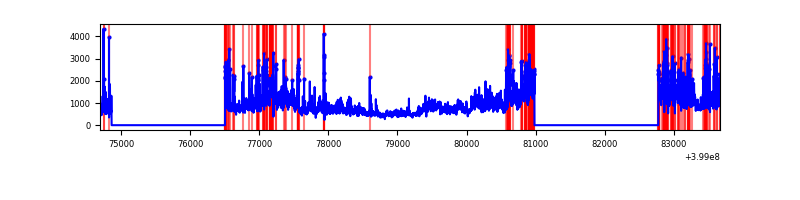 |
Top three noisy pixels from each quadrant. If the there are fewer than three noisy pixels in the level2.evt file, extra rows are filled as -1
| Pixel properties | Quadrant properties | ||||||
|---|---|---|---|---|---|---|---|
| Quadrant | DetID | PixID | Counts | Sigma | Mean | Median | Sigma |
| A | 10 | 83 | 283965 | 2114.36 | 662 | 652 | 134.0 |
| A | 15 | 237 | 147333 | 1094.68 | 662 | 652 | 134.0 |
| A | 13 | 248 | 64060 | 473.21 | 662 | 652 | 134.0 |
| B | 4 | 171 | 425163 | 3331.95 | 660 | 647 | 127.4 |
| B | 5 | 172 | 152238 | 1189.81 | 660 | 647 | 127.4 |
| B | 5 | 255 | 98740 | 769.91 | 660 | 647 | 127.4 |
| C | 14 | 254 | 569529 | 3850.2 | 628 | 635 | 147.8 |
| C | 15 | 214 | 224209 | 1513.12 | 628 | 635 | 147.8 |
| C | 1 | 23 | 150841 | 1016.58 | 628 | 635 | 147.8 |
| D | 12 | 235 | 2069913 | 13120.06 | 635 | 618 | 157.7 |
| D | 2 | 249 | 368301 | 2331.24 | 635 | 618 | 157.7 |
| D | 13 | 249 | 137701 | 869.15 | 635 | 618 | 157.7 |
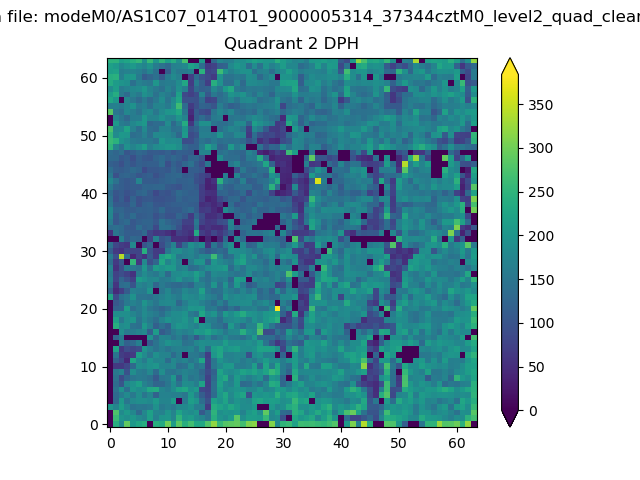
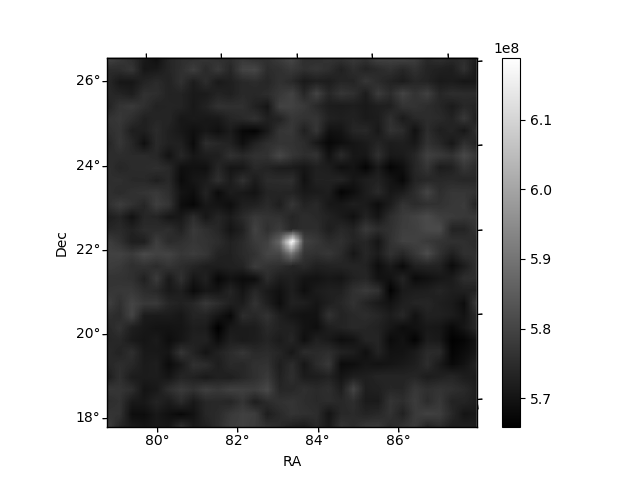
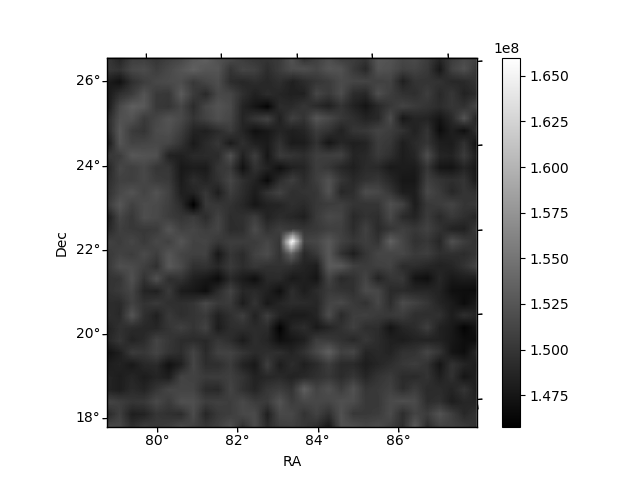
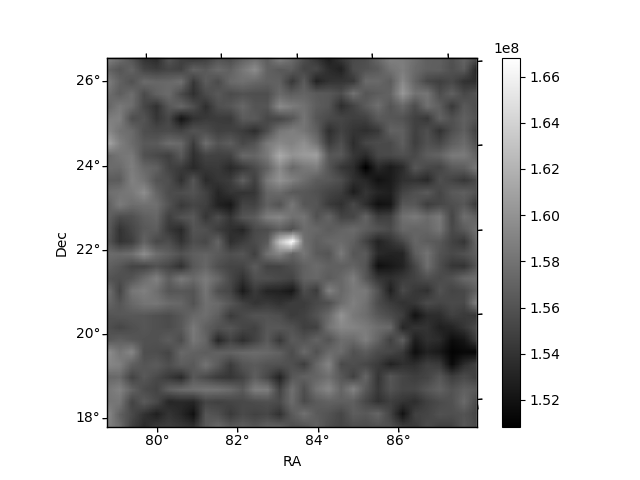
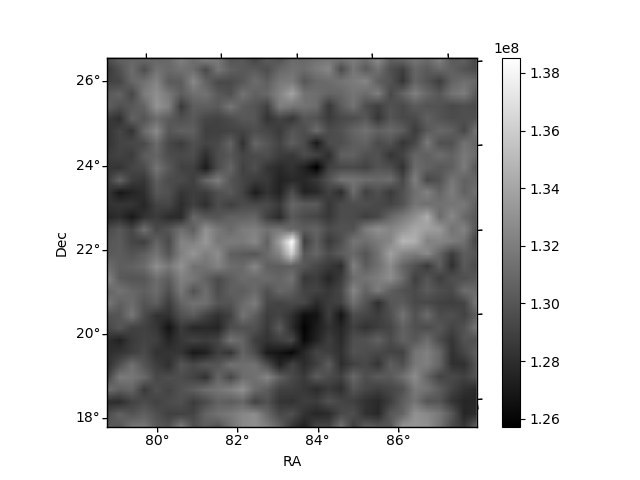
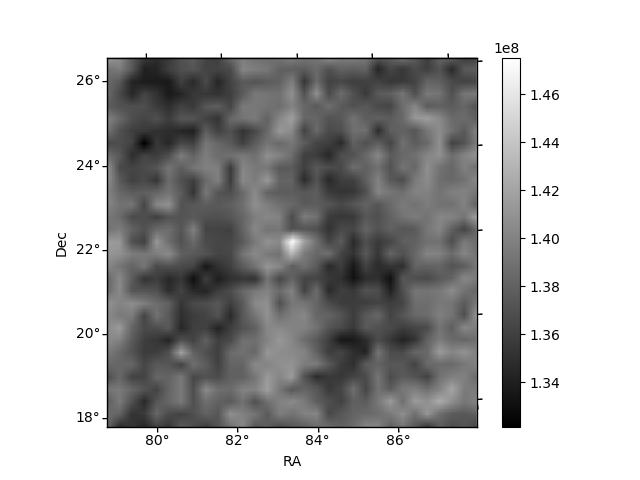
Histogram calculated using DETX and DETY for each event in the final _common_clean file
| Quadrant A | 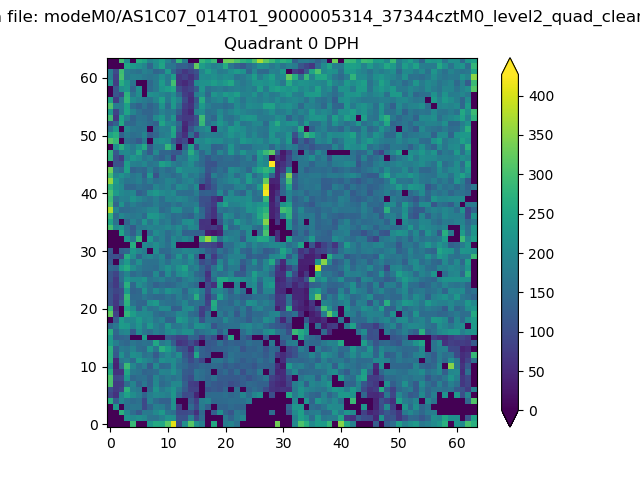 |
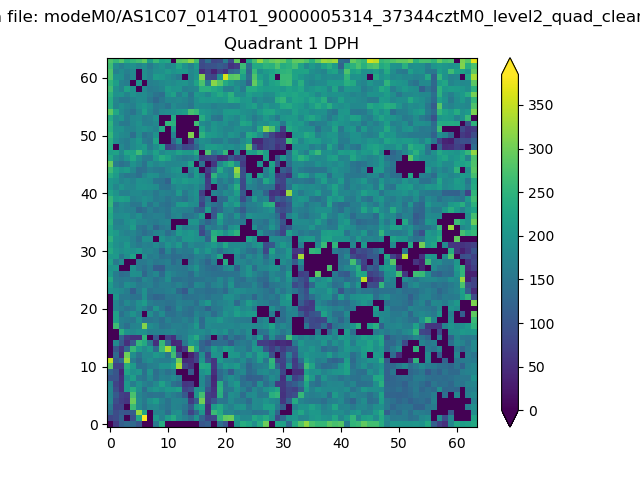 |
Quadrant B |
|---|---|---|---|
| Quadrant D | 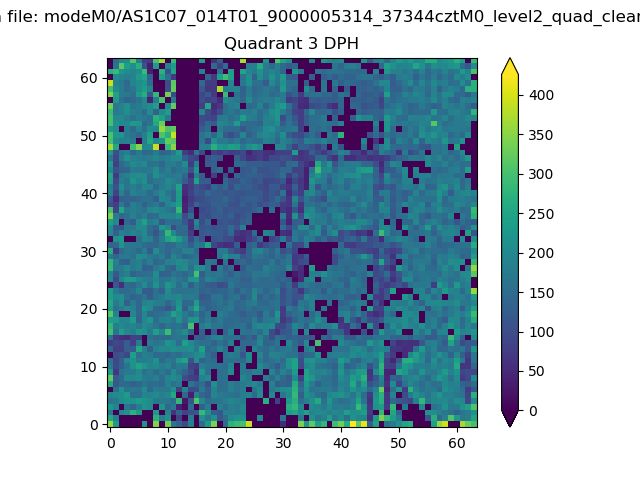 |
 |
Quadrant C |
| Plot type | Count rate plots | Images |
|---|---|---|
| Comparison with Poisson distribution Blue bars denote a histogram of data divided into 1 sec bins. Red curve is a Poisson curve with rate = median count rate of data. |
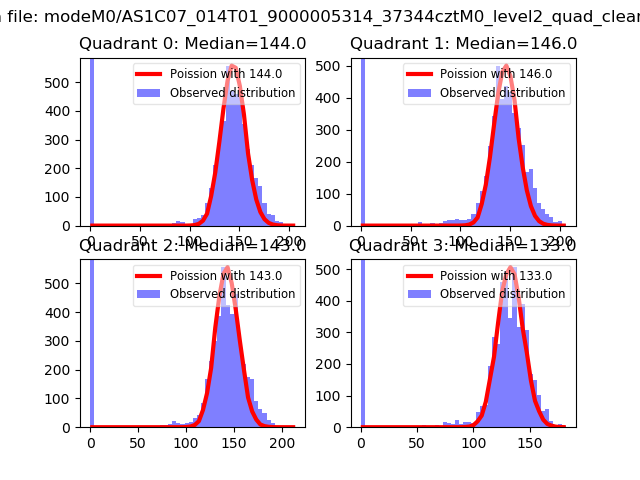 |
 |
| Quadrant-wise count rates Data is divided into 100 sec bins |
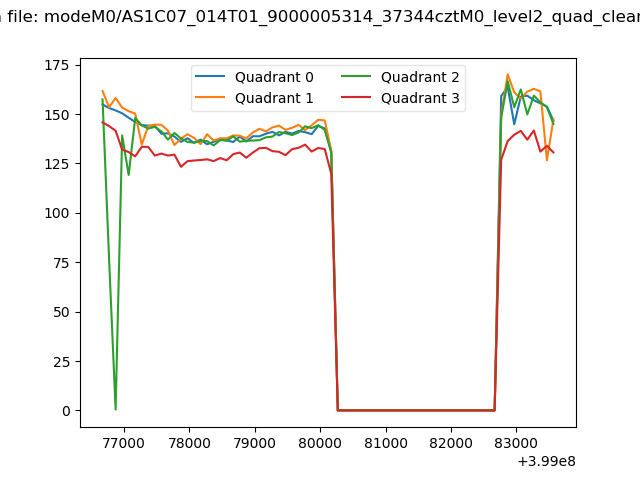 |
|
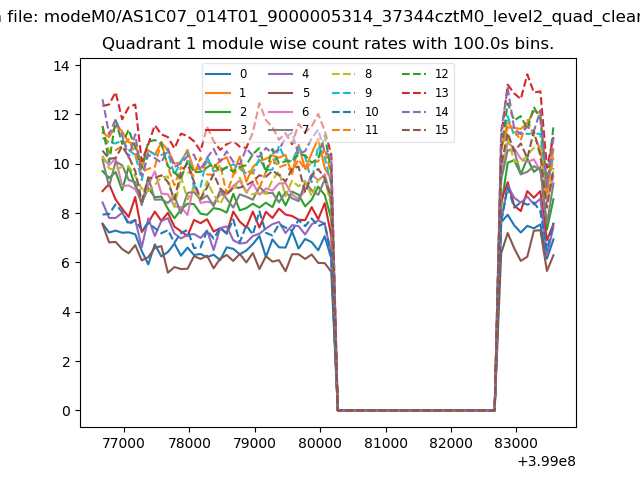
| Module-wise count rates for Quadrant A Data is divided into 100 sec bins |
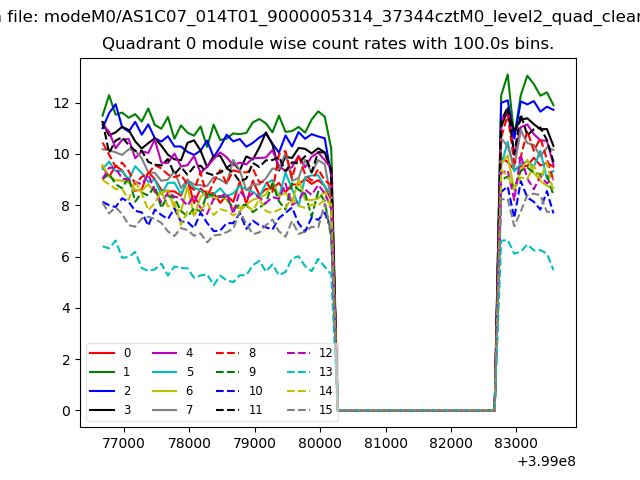 |
 |
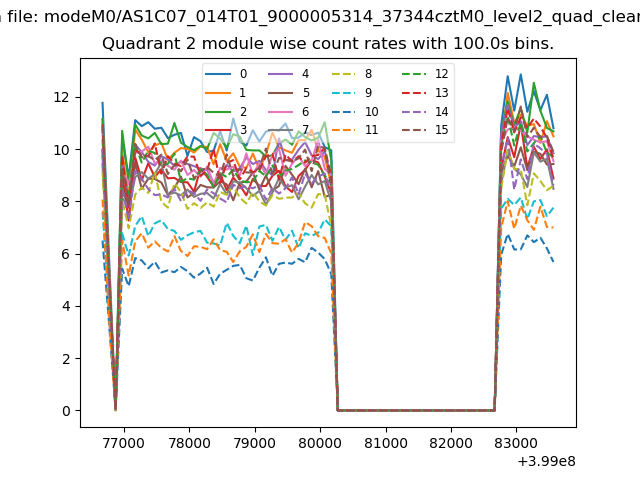
| Module-wise count rates for Quadrant B Data is divided into 100 sec bins |
 |
 |
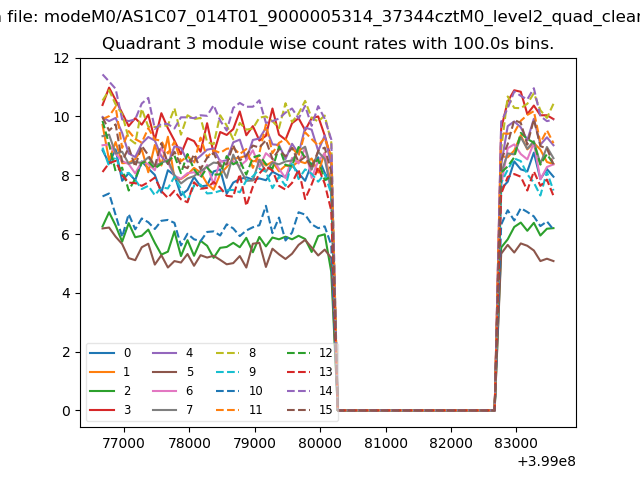
| Module-wise count rates for Quadrant C Data is divided into 100 sec bins |
 |
 |
| Module-wise count rates for Quadrant D Data is divided into 100 sec bins |
 |
 |
| Parameter | Plot |
|---|---|
| CZT HV Monitor | 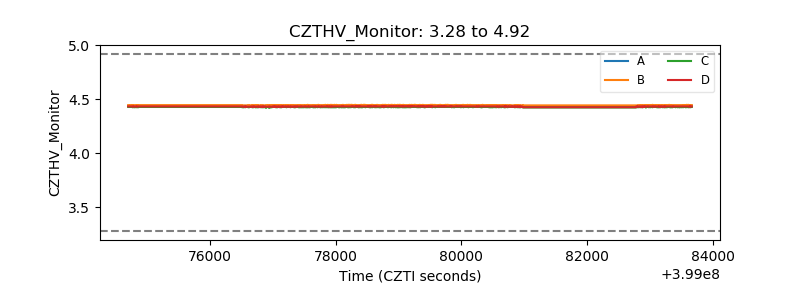 |
| D_VDD | 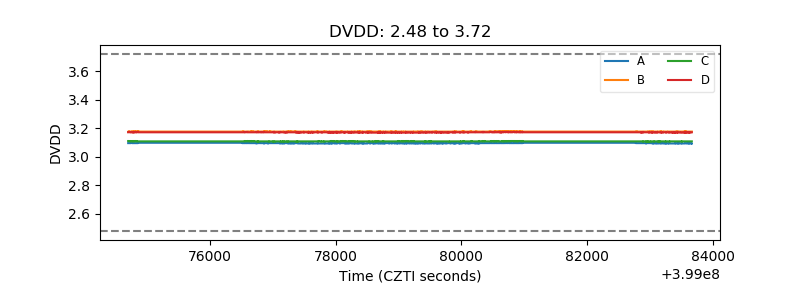 |
| Temperature 1 | 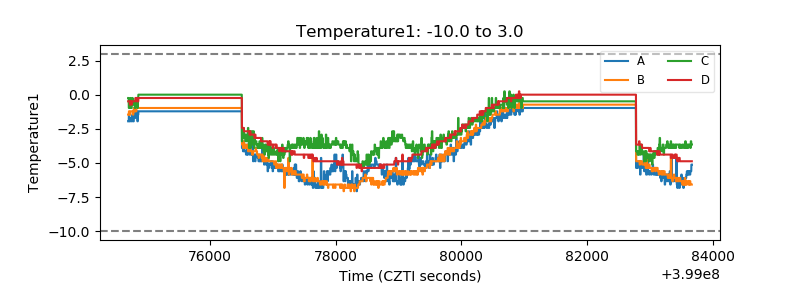 |
| Veto HV Monitor | 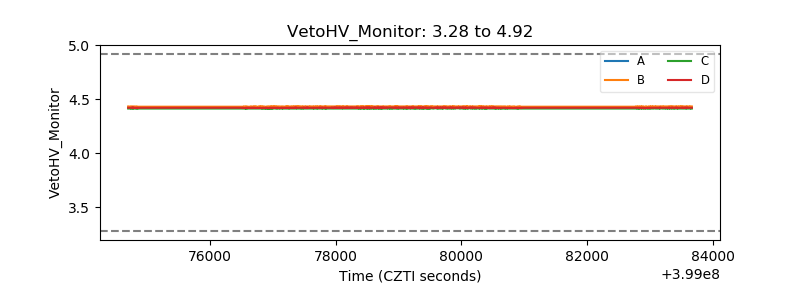 |
| Veto LLD | 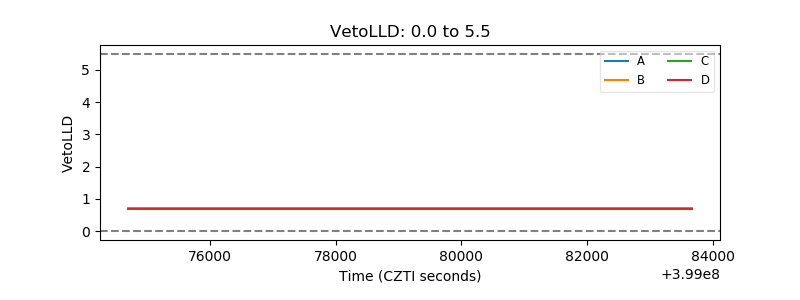 |
| Alpha Counter | 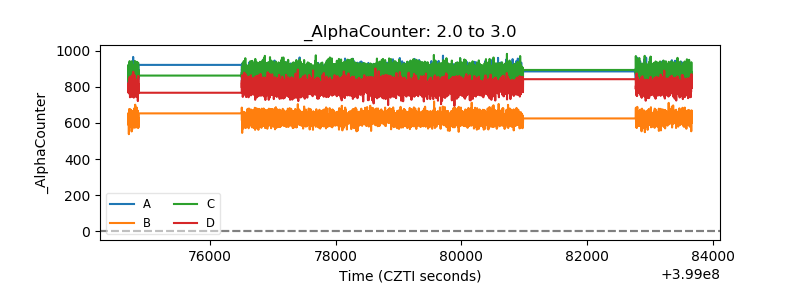 |
| _CPM_Rate | 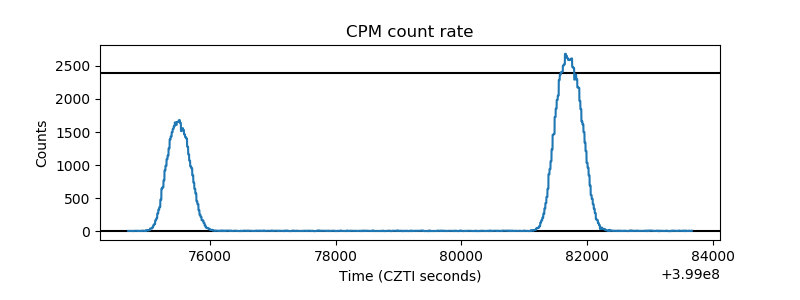 |
| CZT Counter | 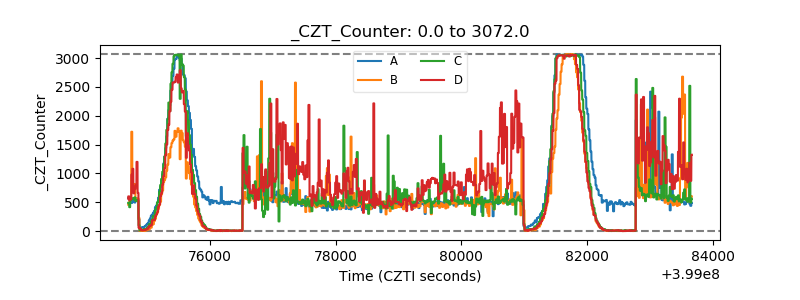 |
| +2.5 Volts monitor | 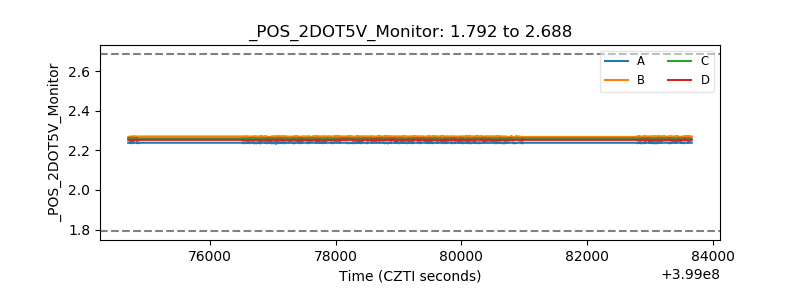 |
| +5 Volts monitor | 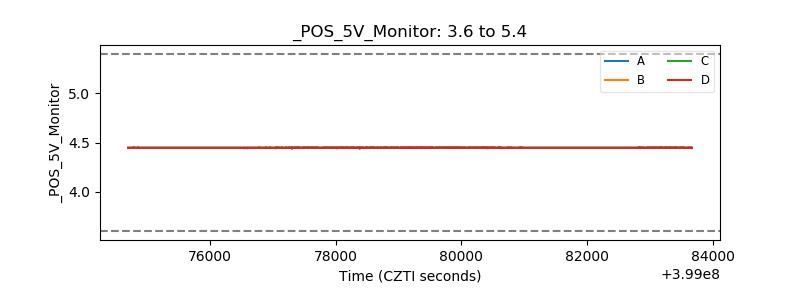 |
| _ROLL_ROT | 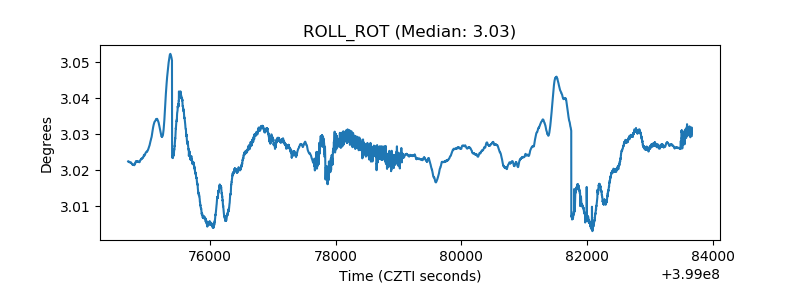 |
| _Roll_DEC | 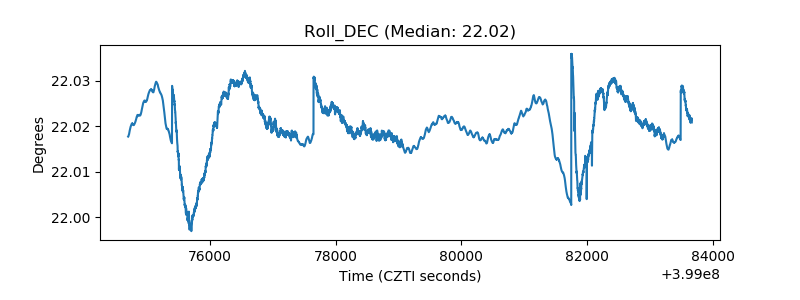 |
| _Roll_RA | 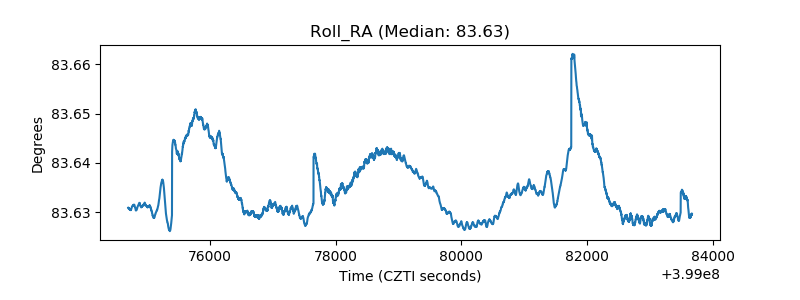 |
| Veto Counter | 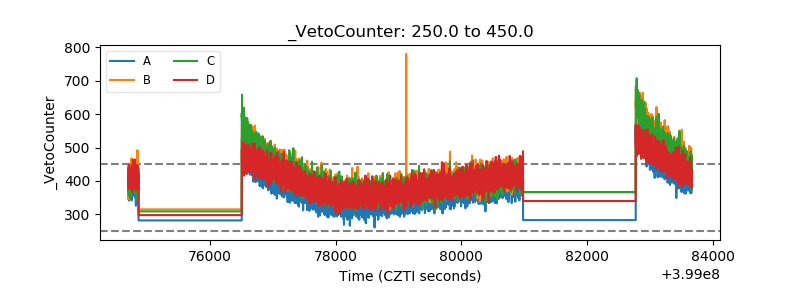 |