| Param | Original file | Final file |
|---|---|---|
| Filename | modeM0/AS1C07_014T01_9000005314_37345cztM0_level2.evt | modeM0/AS1C07_014T01_9000005314_37345cztM0_level2_quad_clean.evt |
| Size (bytes) | 577,275,840 | 91,267,200 |
| Size | 550.5 MB | 87.0 MB |
| Events in quadrant A | 2,885,564 | 620,678 |
| Events in quadrant B | 3,416,557 | 628,252 |
| Events in quadrant C | 3,255,937 | 618,081 |
| Events in quadrant D | 7,577,079 | 536,200 |
| Mode M0 | |||
|---|---|---|---|
| Quadrant | BADHDUFLAG | Total packets | Discarded packets |
| A | 0 | 11632 | 3 |
| B | 0 | 13373 | 2 |
| C | 0 | 12781 | 2 |
| D | 0 | 26118 | 2 |
| Mode M9 | |||
|---|---|---|---|
| Quadrant | BADHDUFLAG | Total packets | Discarded packets |
| A | 0 | 19 | 0 |
| B | 0 | 19 | 0 |
| C | 0 | 19 | 0 |
| D | 0 | 19 | 0 |
| Mode SS | |||
|---|---|---|---|
| Quadrant | BADHDUFLAG | Total packets | Discarded packets |
| A | 0 | 106 | 0 |
| B | 0 | 106 | 0 |
| C | 0 | 106 | 0 |
| D | 0 | 106 | 0 |
| Quadrant | Total seconds | Saturated seconds | Saturation percentage |
|---|---|---|---|
| A | 5141 | 38 | 0.739156% |
| B | 5141 | 267 | 5.193542% |
| C | 5141 | 112 | 2.178564% |
| D | 5141 | 1132 | 22.019062% |
Noise dominated data is calculated using 1-second bins in cleaned event files. If a bin has >2000 counts, and if more than 50% of those come from <1% of pixels, then it is considered to be noise-dominated and hence unusable.
| Quadrant | # 1 sec bins | Bins with >0 counts | Bins with >2000 counts | High rate bins dominated by noise | Noise dominated (total time) | Noise dominated (detector-on time) | Marked lightcurve |
|---|---|---|---|---|---|---|---|
| A | 7055 | 5142 | 28 | 28 | 0.40% | 0.54% | 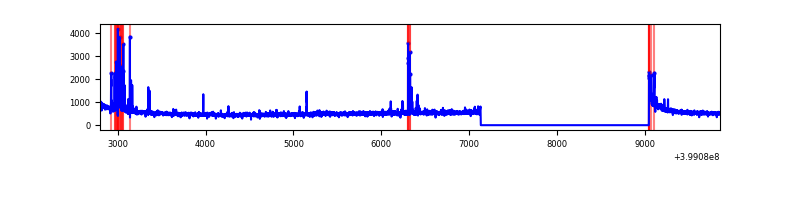 |
| B | 7055 | 5142 | 192 | 192 | 2.72% | 3.73% | 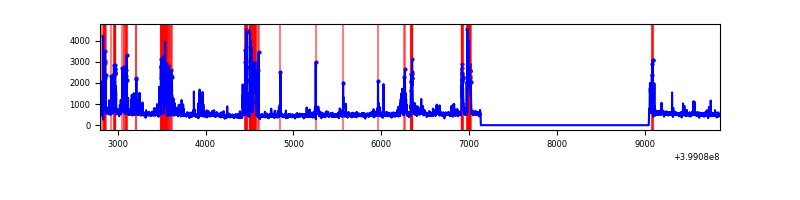 |
| C | 7055 | 5142 | 82 | 82 | 1.16% | 1.59% | 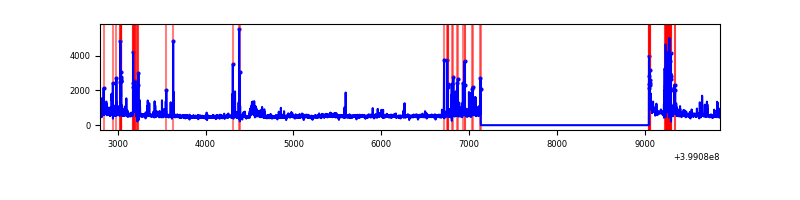 |
| D | 7055 | 5142 | 1104 | 1104 | 15.65% | 21.47% | 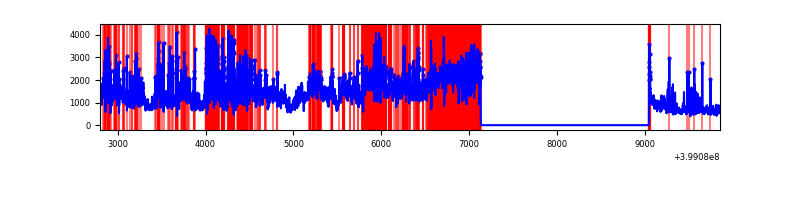 |
Top three noisy pixels from each quadrant. If the there are fewer than three noisy pixels in the level2.evt file, extra rows are filled as -1
| Pixel properties | Quadrant properties | ||||||
|---|---|---|---|---|---|---|---|
| Quadrant | DetID | PixID | Counts | Sigma | Mean | Median | Sigma |
| A | 10 | 83 | 256630 | 2019.01 | 624 | 615 | 126.8 |
| A | 15 | 237 | 159804 | 1255.41 | 624 | 615 | 126.8 |
| A | 13 | 248 | 22292 | 170.95 | 624 | 615 | 126.8 |
| B | 4 | 171 | 358740 | 3040.12 | 620 | 609 | 117.8 |
| B | 5 | 172 | 265666 | 2250.03 | 620 | 609 | 117.8 |
| B | 0 | 190 | 199299 | 1686.65 | 620 | 609 | 117.8 |
| C | 1 | 23 | 304299 | 2139.03 | 609 | 617 | 142.0 |
| C | 14 | 254 | 289512 | 2034.88 | 609 | 617 | 142.0 |
| C | 15 | 214 | 215850 | 1516.03 | 609 | 617 | 142.0 |
| D | 12 | 235 | 3942644 | 28257.14 | 558 | 545 | 139.5 |
| D | 2 | 249 | 1024953 | 7343.0 | 558 | 545 | 139.5 |
| D | 13 | 249 | 228133 | 1631.36 | 558 | 545 | 139.5 |
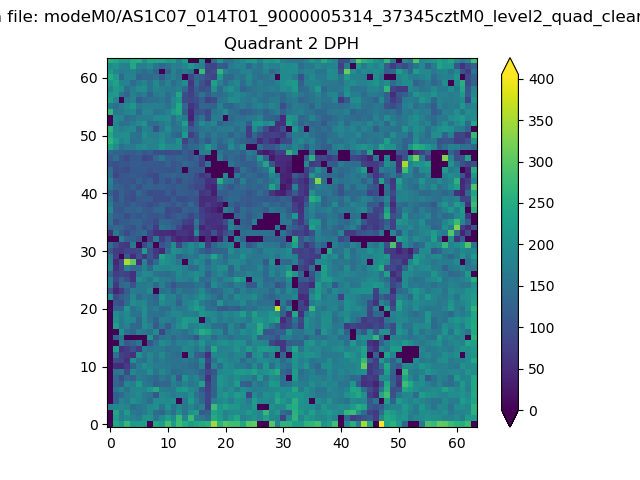
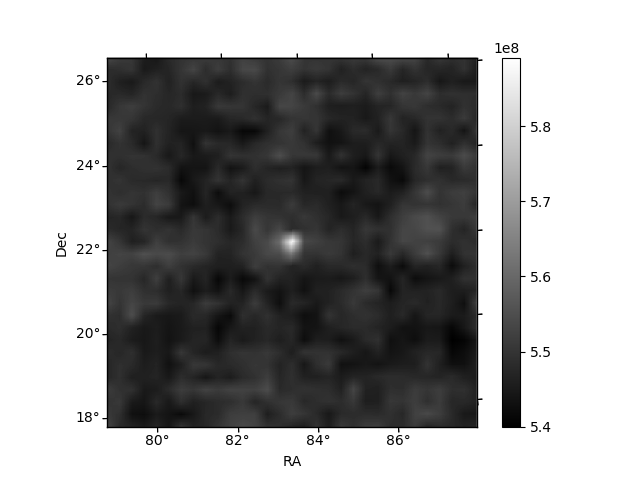
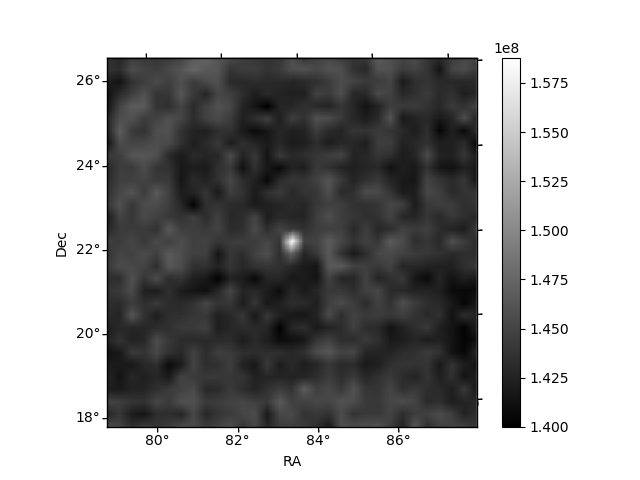
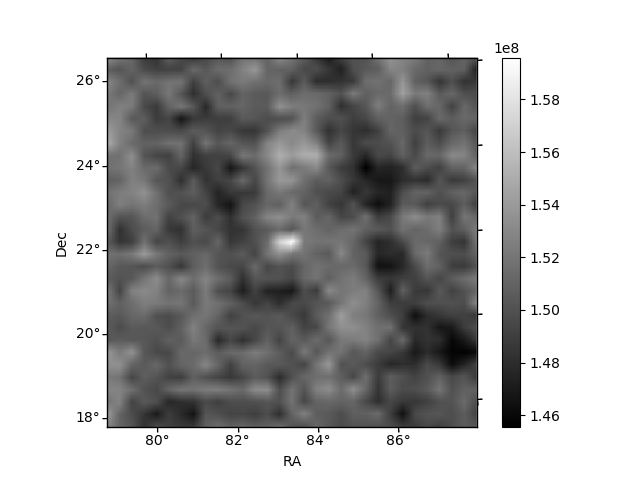
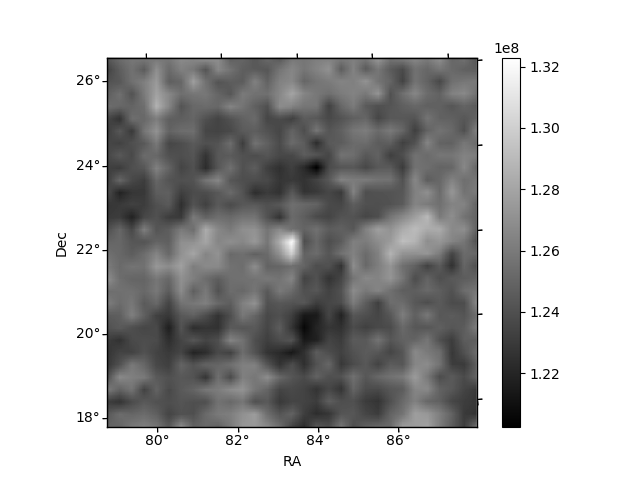
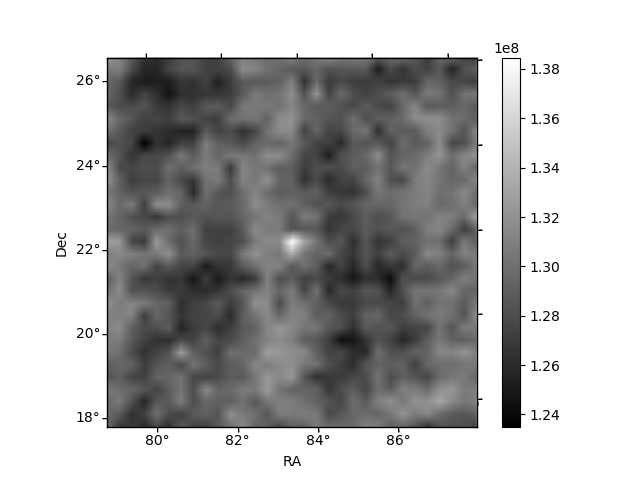
Histogram calculated using DETX and DETY for each event in the final _common_clean file
| Quadrant A | 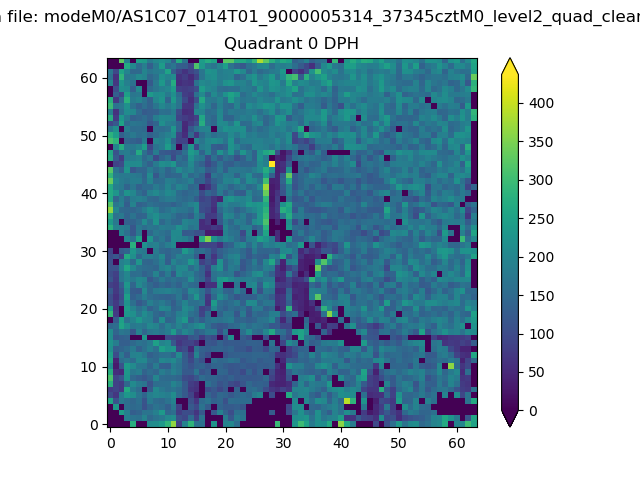 |
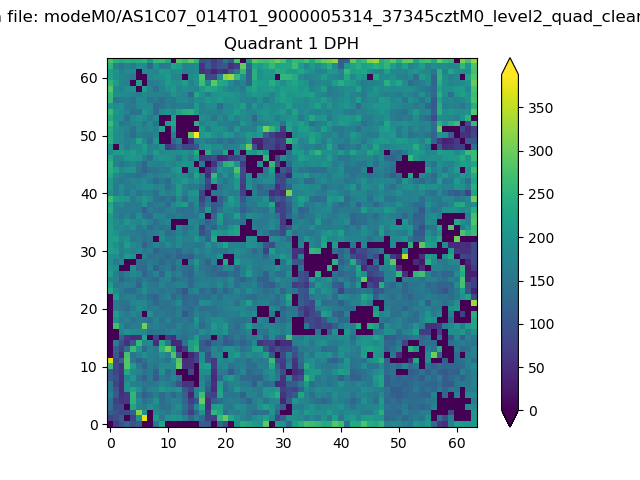 |
Quadrant B |
|---|---|---|---|
| Quadrant D | 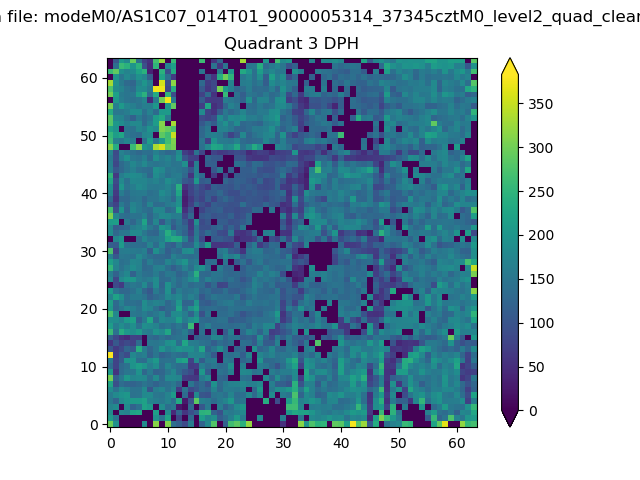 |
 |
Quadrant C |
| Plot type | Count rate plots | Images |
|---|---|---|
| Comparison with Poisson distribution Blue bars denote a histogram of data divided into 1 sec bins. Red curve is a Poisson curve with rate = median count rate of data. |
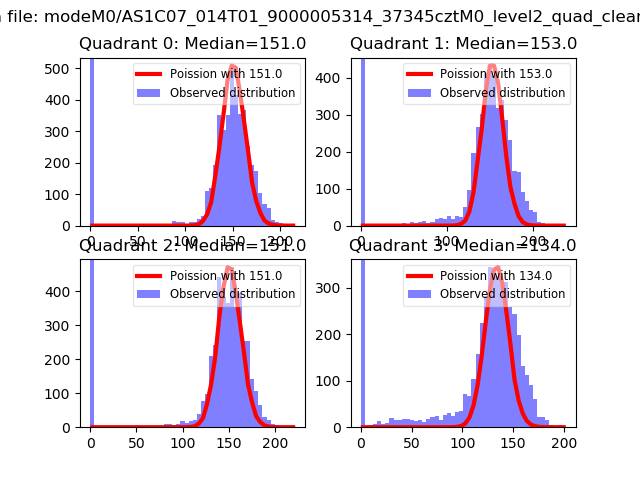 |
 |
| Quadrant-wise count rates Data is divided into 100 sec bins |
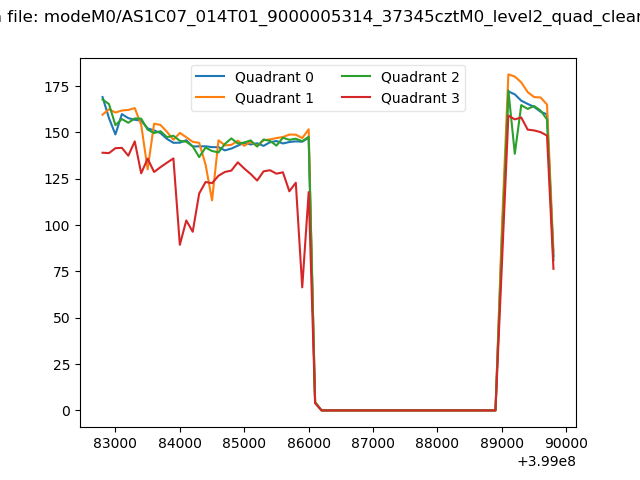 |
|
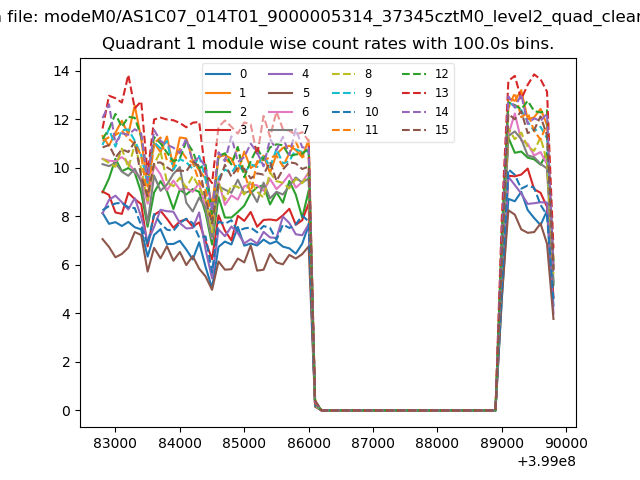
| Module-wise count rates for Quadrant A Data is divided into 100 sec bins |
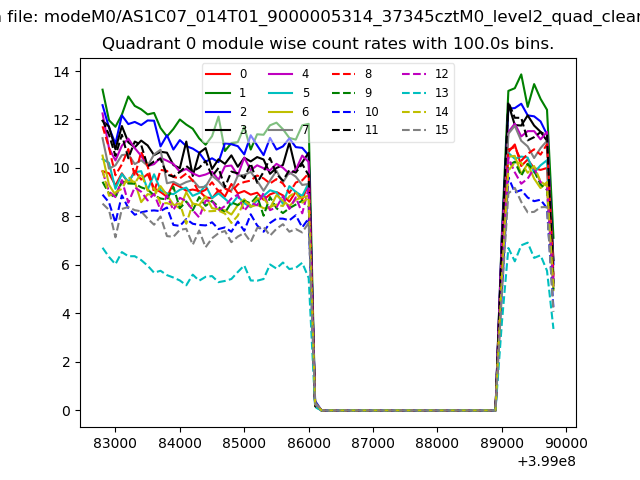 |
 |
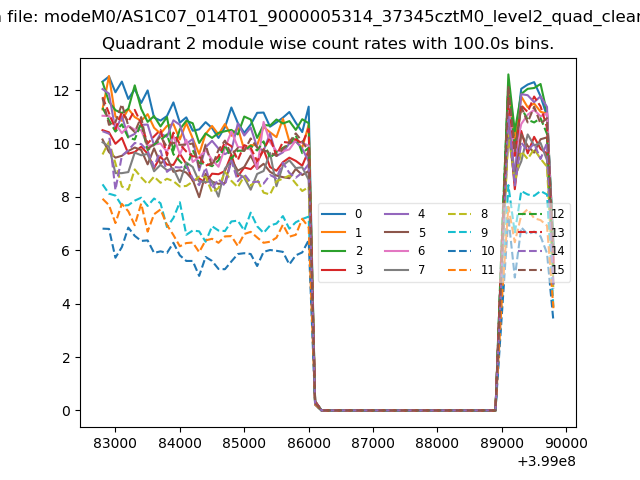
| Module-wise count rates for Quadrant B Data is divided into 100 sec bins |
 |
 |
| Module-wise count rates for Quadrant C Data is divided into 100 sec bins |
 |
 |
| Module-wise count rates for Quadrant D Data is divided into 100 sec bins |
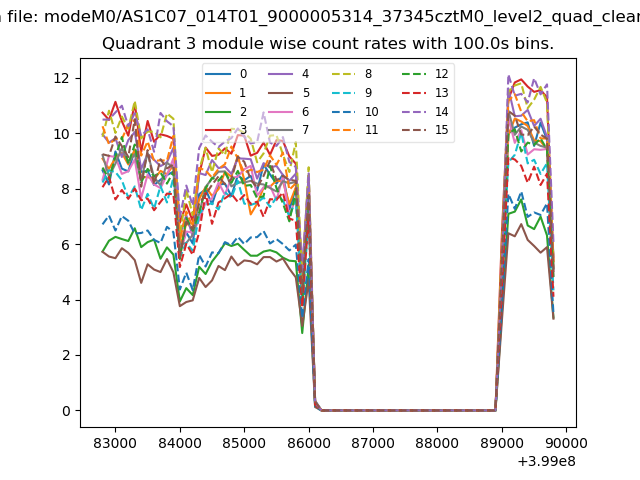 |
 |
| Parameter | Plot |
|---|---|
| CZT HV Monitor | 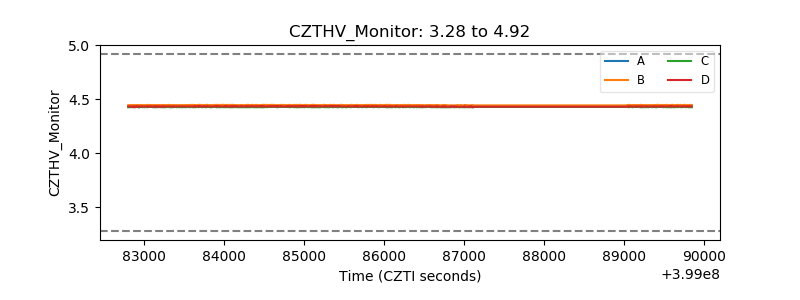 |
| D_VDD | 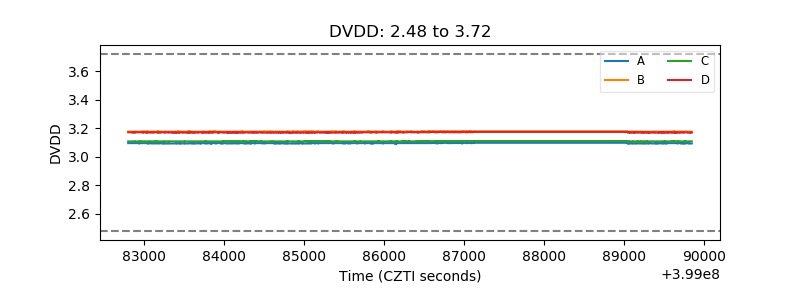 |
| Temperature 1 | 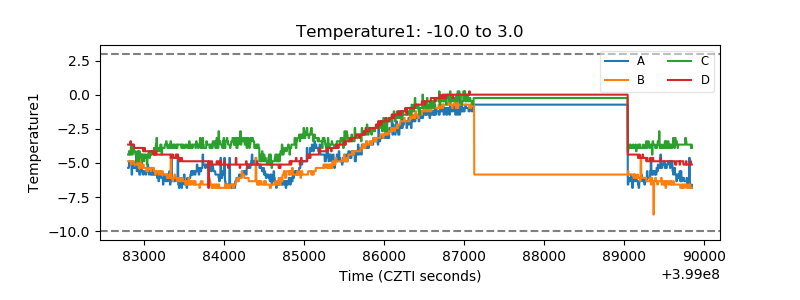 |
| Veto HV Monitor | 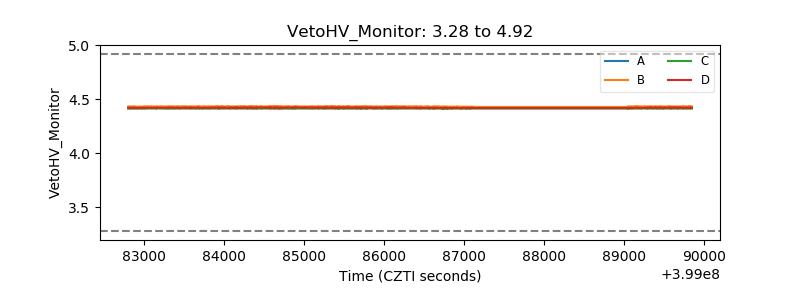 |
| Veto LLD | 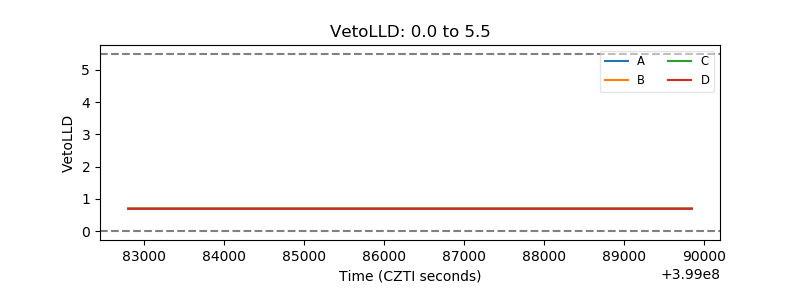 |
| Alpha Counter | 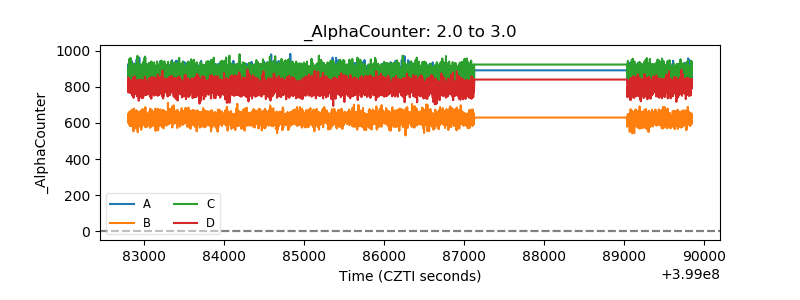 |
| _CPM_Rate | 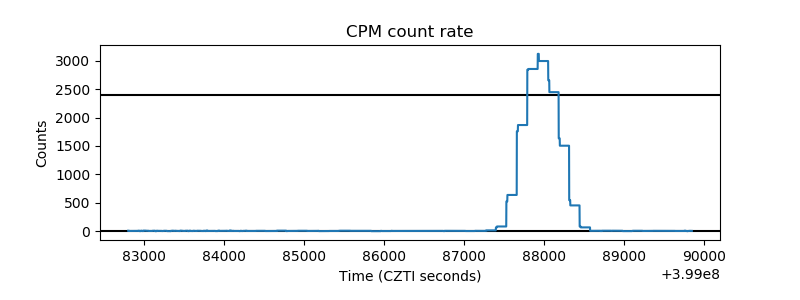 |
| CZT Counter | 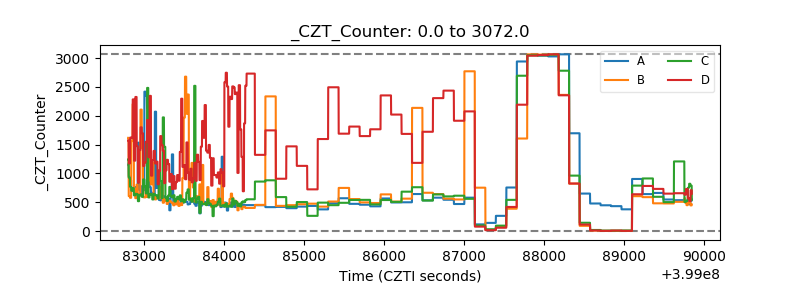 |
| +2.5 Volts monitor | 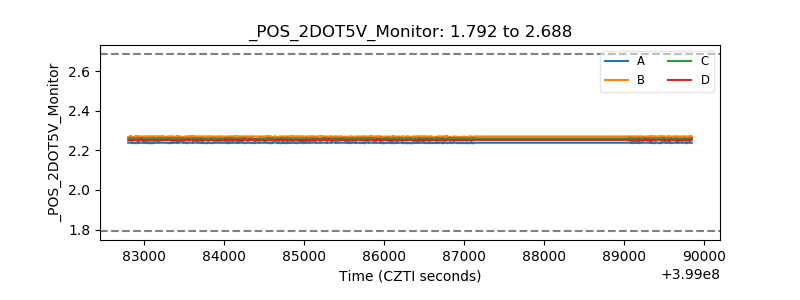 |
| +5 Volts monitor | 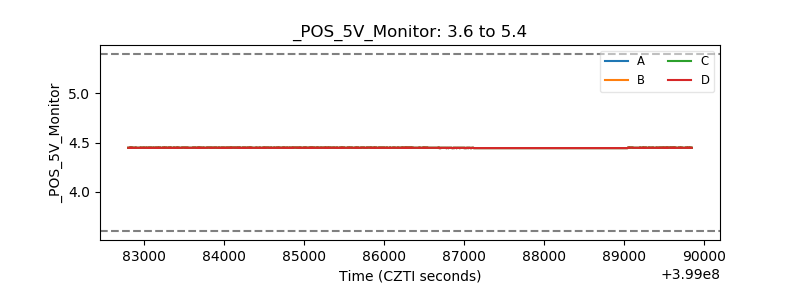 |
| _ROLL_ROT | 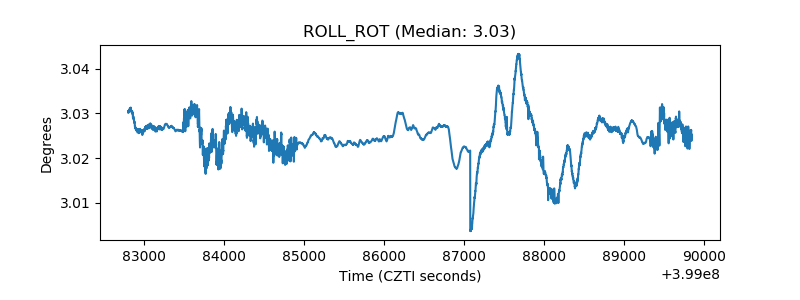 |
| _Roll_DEC | 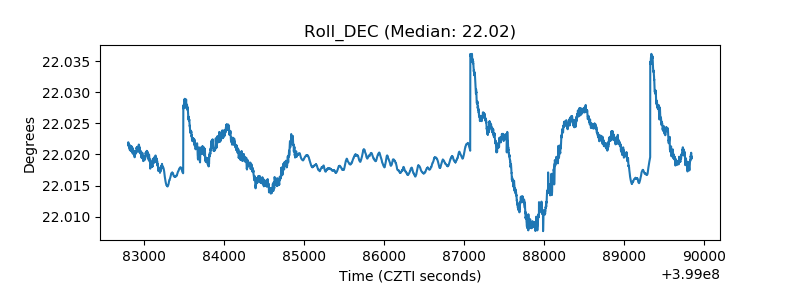 |
| _Roll_RA | 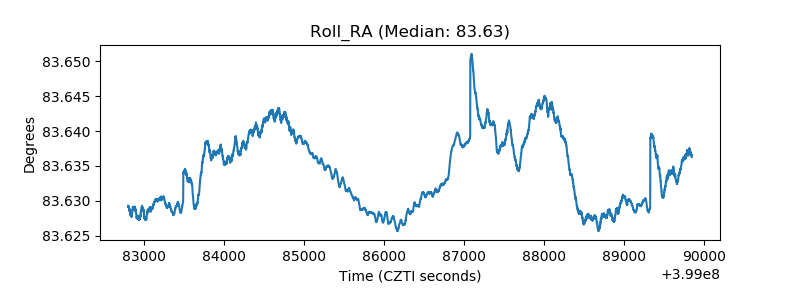 |
| Veto Counter | 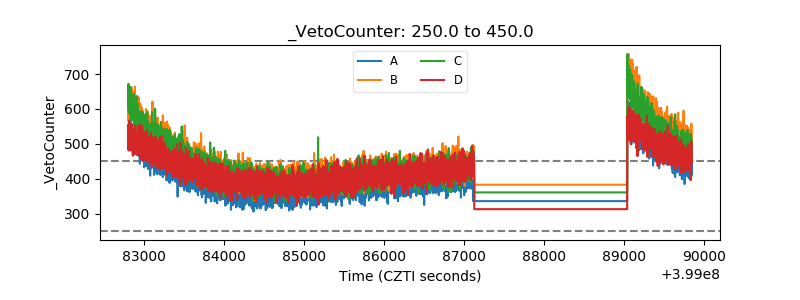 |