| Param | Original file | Final file |
|---|---|---|
| Filename | modeM0/AS1C07_014T01_9000005314_37346cztM0_level2.evt | modeM0/AS1C07_014T01_9000005314_37346cztM0_level2_quad_clean.evt |
| Size (bytes) | 471,107,520 | 85,176,000 |
| Size | 449.3 MB | 81.2 MB |
| Events in quadrant A | 2,822,408 | 571,392 |
| Events in quadrant B | 3,026,394 | 590,979 |
| Events in quadrant C | 3,698,973 | 553,240 |
| Events in quadrant D | 4,380,759 | 513,021 |
| Mode M0 | |||
|---|---|---|---|
| Quadrant | BADHDUFLAG | Total packets | Discarded packets |
| A | 0 | 11385 | 3 |
| B | 0 | 12046 | 2 |
| C | 0 | 14109 | 2 |
| D | 0 | 16583 | 2 |
| Mode M9 | |||
|---|---|---|---|
| Quadrant | BADHDUFLAG | Total packets | Discarded packets |
| A | 0 | 26 | 0 |
| B | 0 | 26 | 0 |
| C | 0 | 26 | 0 |
| D | 0 | 27 | 0 |
| Mode SS | |||
|---|---|---|---|
| Quadrant | BADHDUFLAG | Total packets | Discarded packets |
| A | 0 | 102 | 0 |
| B | 0 | 102 | 0 |
| C | 0 | 102 | 0 |
| D | 0 | 102 | 0 |
| Quadrant | Total seconds | Saturated seconds | Saturation percentage |
|---|---|---|---|
| A | 5000 | 34 | 0.680000% |
| B | 5000 | 154 | 3.080000% |
| C | 5000 | 244 | 4.880000% |
| D | 5000 | 262 | 5.240000% |
Noise dominated data is calculated using 1-second bins in cleaned event files. If a bin has >2000 counts, and if more than 50% of those come from <1% of pixels, then it is considered to be noise-dominated and hence unusable.
| Quadrant | # 1 sec bins | Bins with >0 counts | Bins with >2000 counts | High rate bins dominated by noise | Noise dominated (total time) | Noise dominated (detector-on time) | Marked lightcurve |
|---|---|---|---|---|---|---|---|
| A | 7033 | 5000 | 21 | 21 | 0.30% | 0.42% | 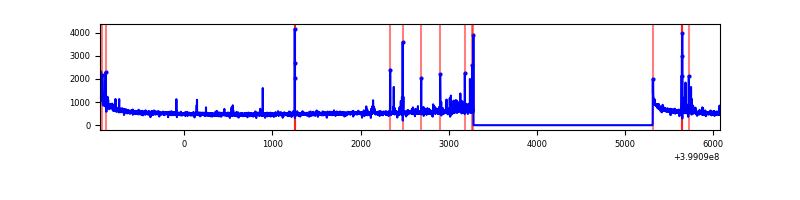 |
| B | 7033 | 5001 | 90 | 90 | 1.28% | 1.80% | 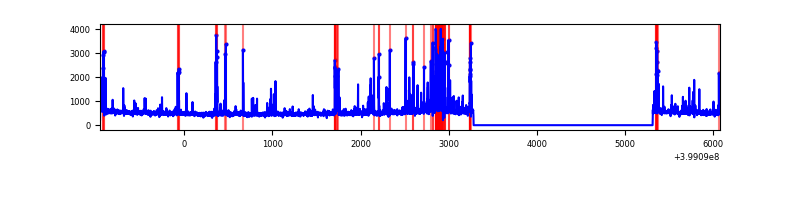 |
| C | 7033 | 5001 | 192 | 192 | 2.73% | 3.84% | 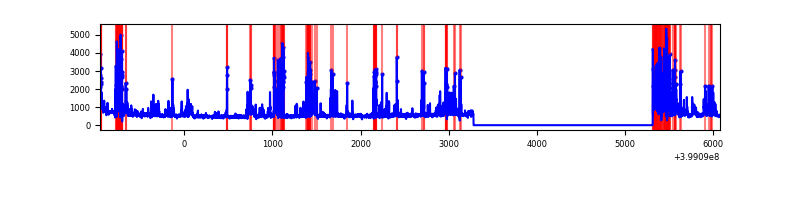 |
| D | 7033 | 5001 | 253 | 253 | 3.60% | 5.06% | 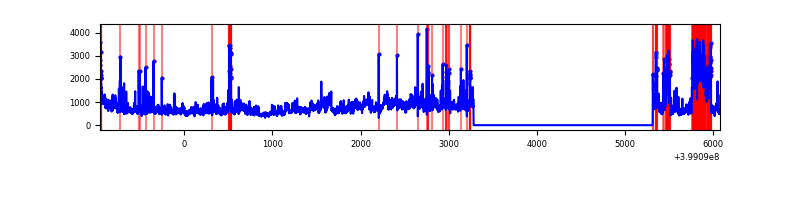 |
Top three noisy pixels from each quadrant. If the there are fewer than three noisy pixels in the level2.evt file, extra rows are filled as -1
| Pixel properties | Quadrant properties | ||||||
|---|---|---|---|---|---|---|---|
| Quadrant | DetID | PixID | Counts | Sigma | Mean | Median | Sigma |
| A | 10 | 83 | 265665 | 2144.22 | 618 | 609 | 123.6 |
| A | 15 | 237 | 56541 | 452.47 | 618 | 609 | 123.6 |
| A | 9 | 143 | 47852 | 382.18 | 618 | 609 | 123.6 |
| B | 5 | 172 | 304177 | 2573.01 | 619 | 607 | 118.0 |
| B | 5 | 255 | 144267 | 1217.64 | 619 | 607 | 118.0 |
| B | 0 | 190 | 55553 | 465.71 | 619 | 607 | 118.0 |
| C | 1 | 23 | 719219 | 5203.51 | 590 | 598 | 138.1 |
| C | 14 | 254 | 403168 | 2914.99 | 590 | 598 | 138.1 |
| C | 15 | 214 | 207613 | 1498.99 | 590 | 598 | 138.1 |
| D | 12 | 235 | 1194392 | 8349.19 | 584 | 570 | 143.0 |
| D | 12 | 227 | 632893 | 4422.26 | 584 | 570 | 143.0 |
| D | 13 | 249 | 103666 | 721.02 | 584 | 570 | 143.0 |
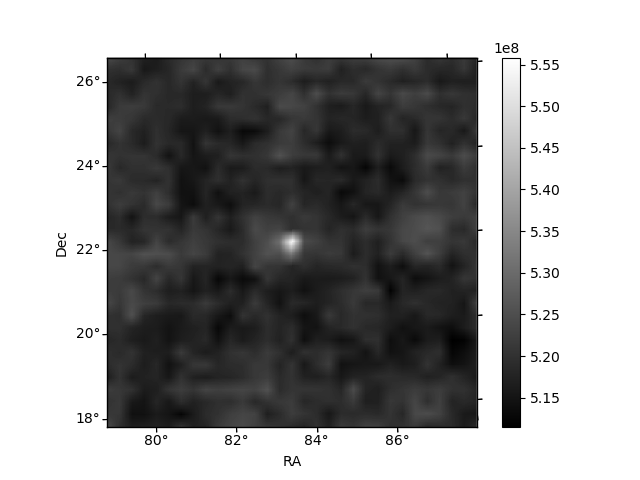
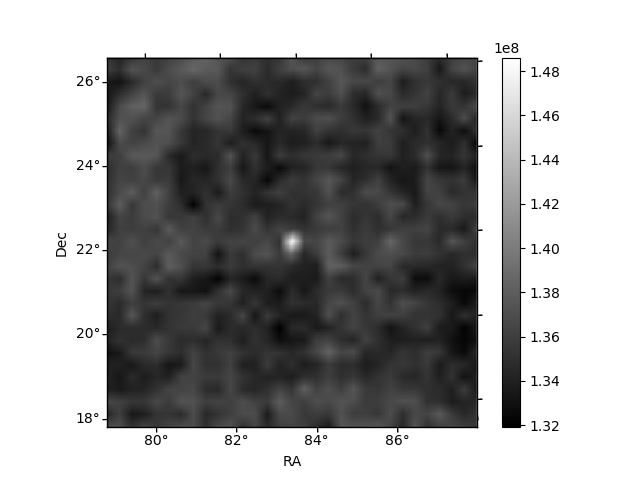
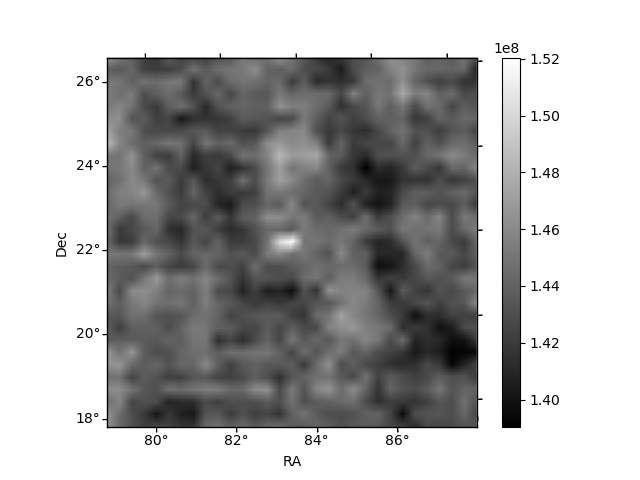
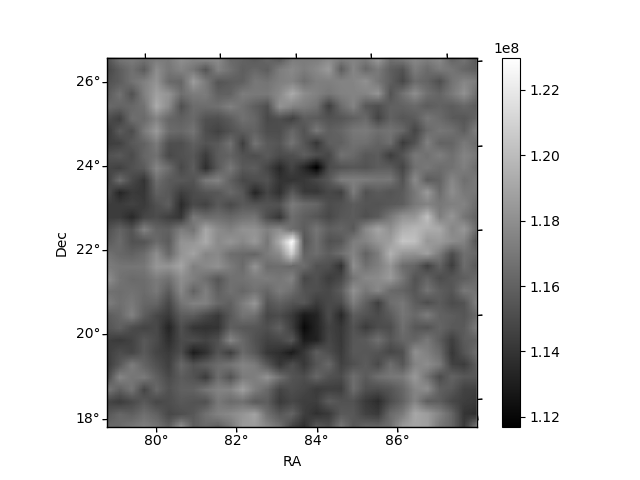
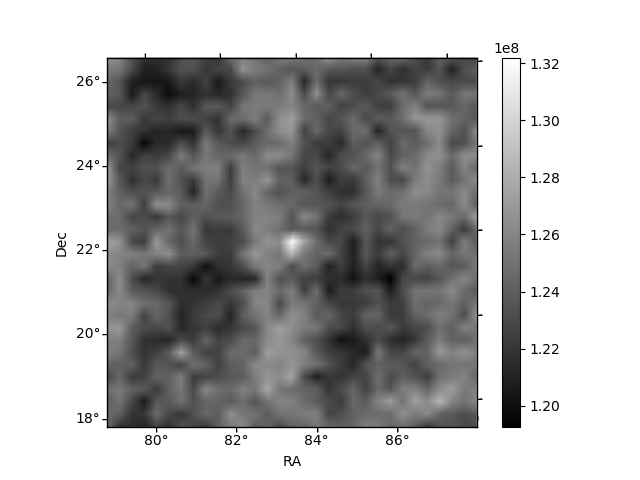
Histogram calculated using DETX and DETY for each event in the final _common_clean file
| Quadrant A | 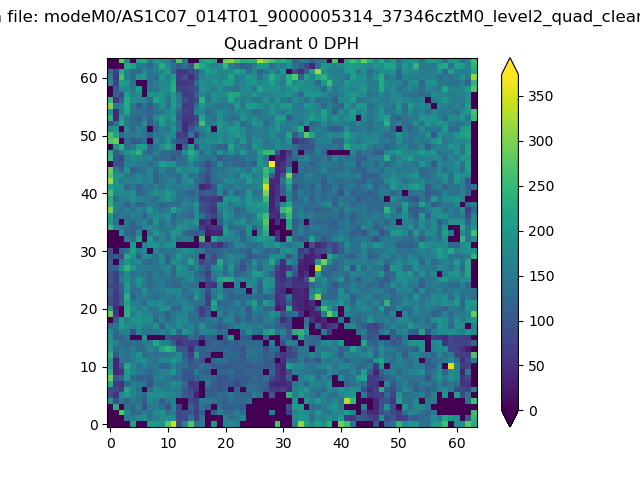 |
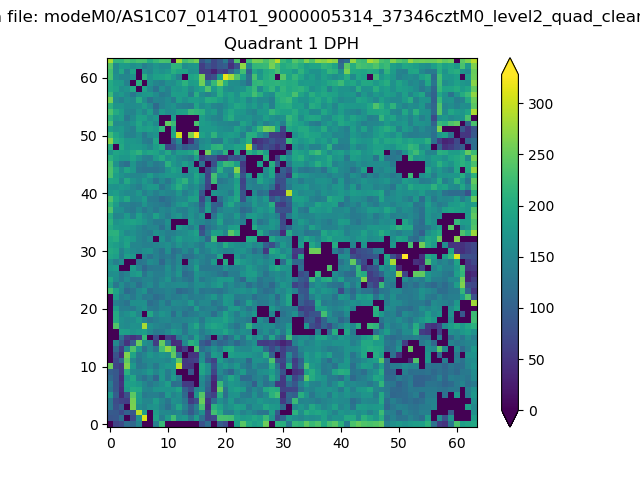 |
Quadrant B |
|---|---|---|---|
| Quadrant D | 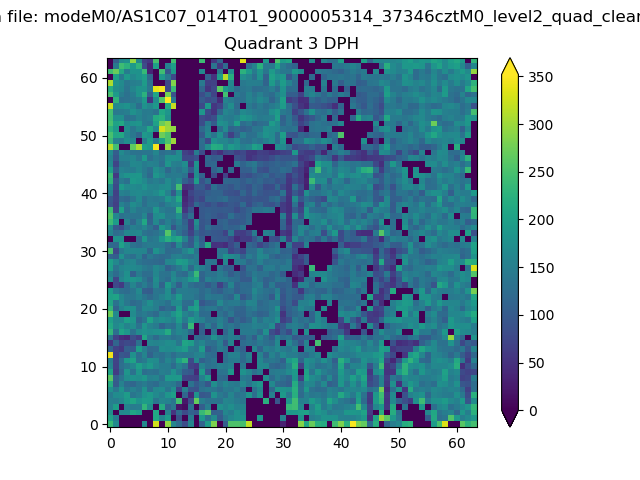 |
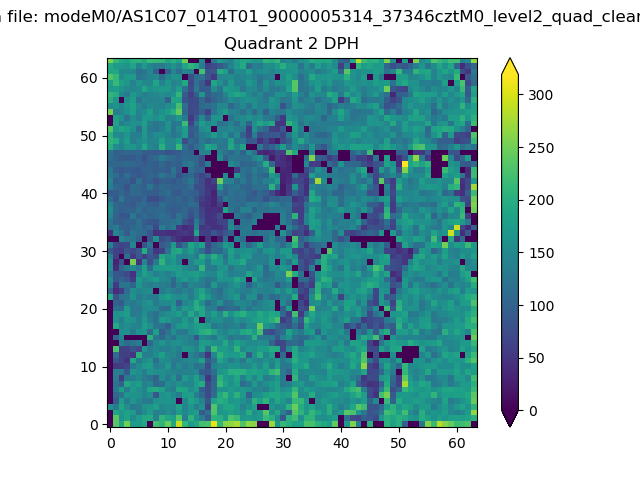 |
Quadrant C |
| Plot type | Count rate plots | Images |
|---|---|---|
| Comparison with Poisson distribution Blue bars denote a histogram of data divided into 1 sec bins. Red curve is a Poisson curve with rate = median count rate of data. |
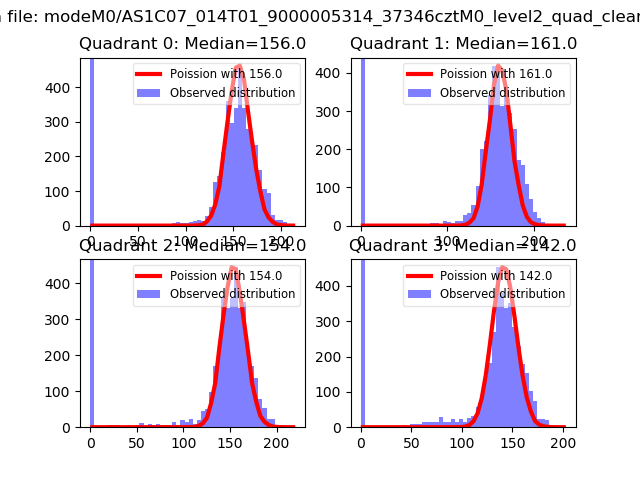 |
 |
| Quadrant-wise count rates Data is divided into 100 sec bins |
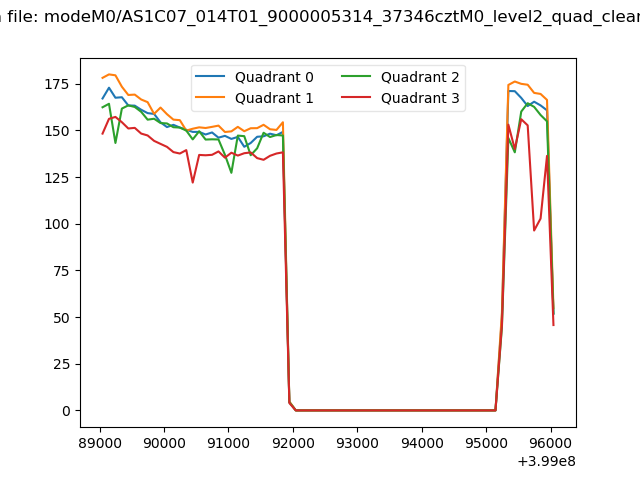 |
|
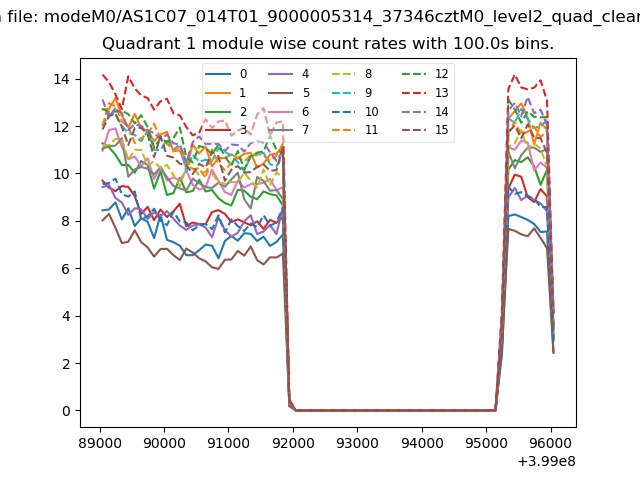
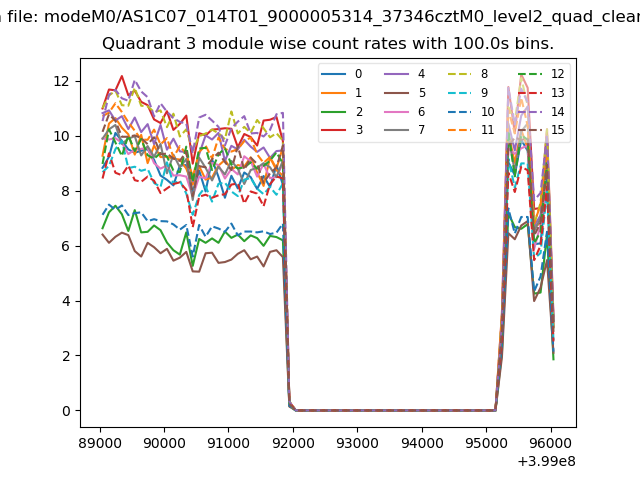
| Module-wise count rates for Quadrant A Data is divided into 100 sec bins |
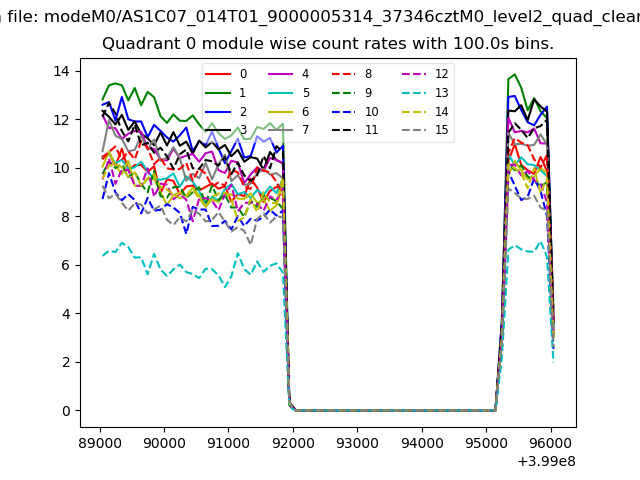 |
 |
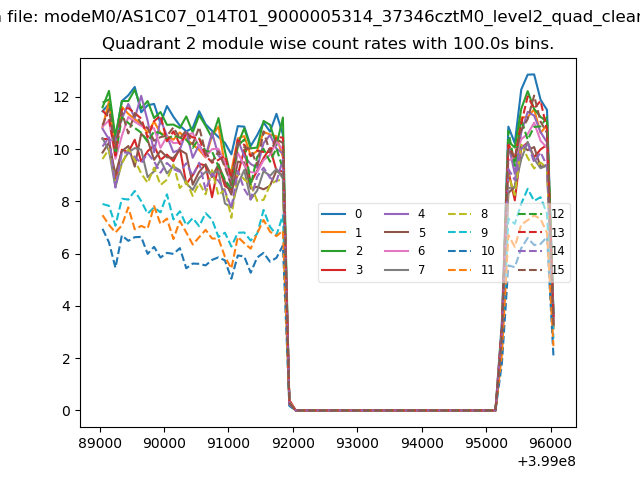
| Module-wise count rates for Quadrant B Data is divided into 100 sec bins |
 |
 |
| Module-wise count rates for Quadrant C Data is divided into 100 sec bins |
 |
 |
| Module-wise count rates for Quadrant D Data is divided into 100 sec bins |
 |
 |
| Parameter | Plot |
|---|---|
| CZT HV Monitor | 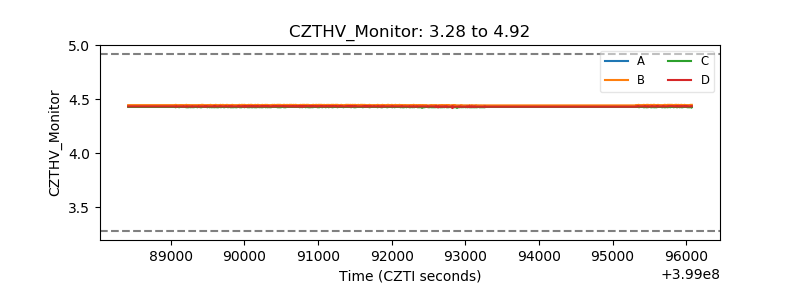 |
| D_VDD | 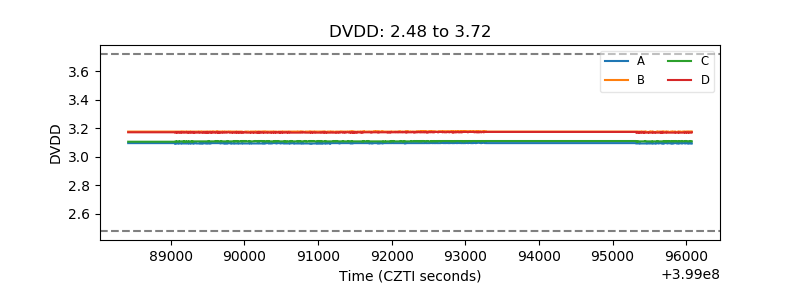 |
| Temperature 1 | 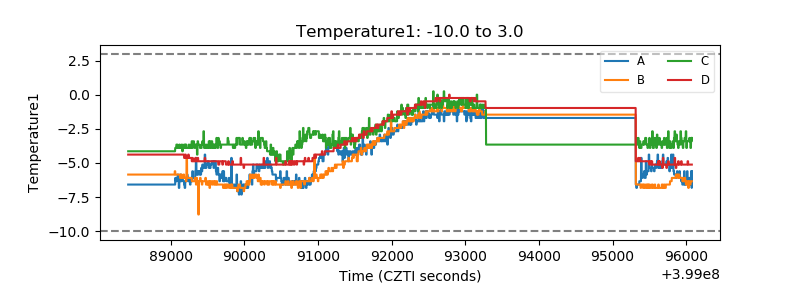 |
| Veto HV Monitor | 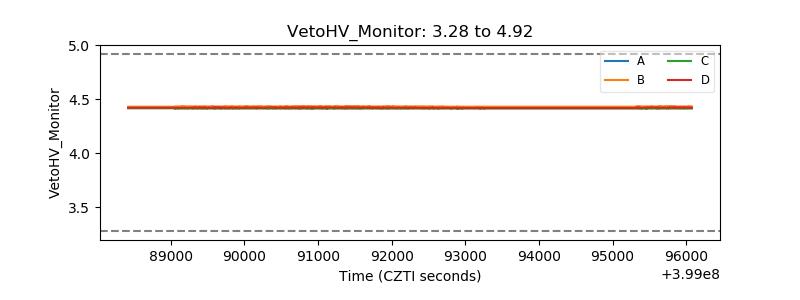 |
| Veto LLD | 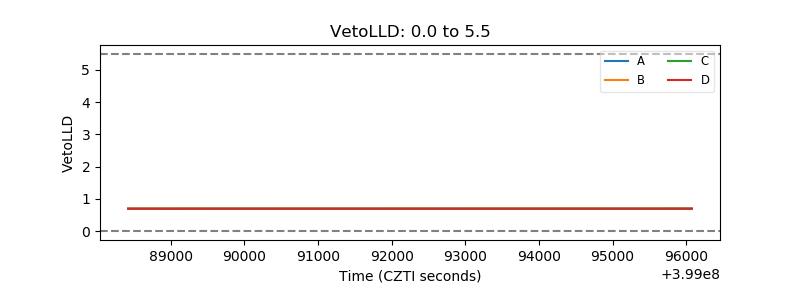 |
| Alpha Counter | 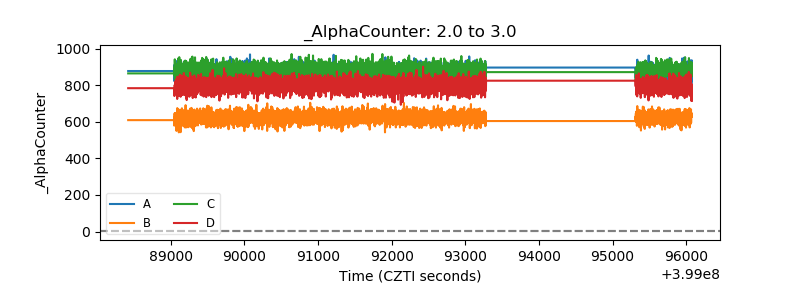 |
| _CPM_Rate | 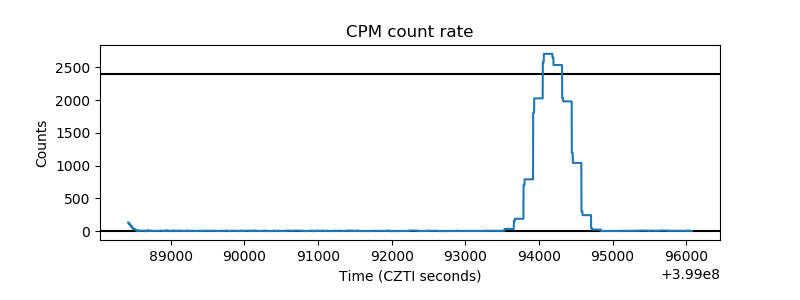 |
| CZT Counter | 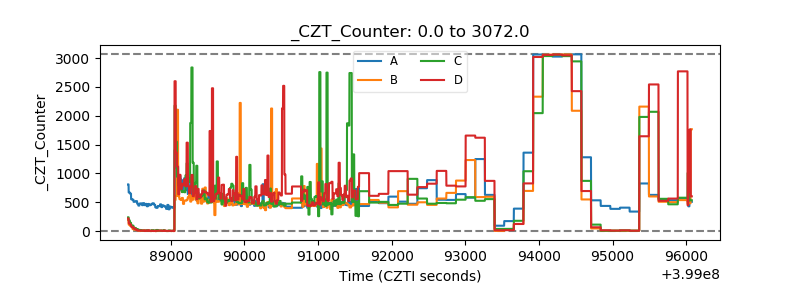 |
| +2.5 Volts monitor | 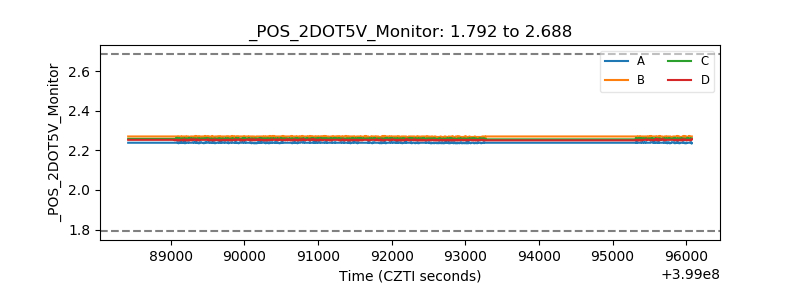 |
| +5 Volts monitor | 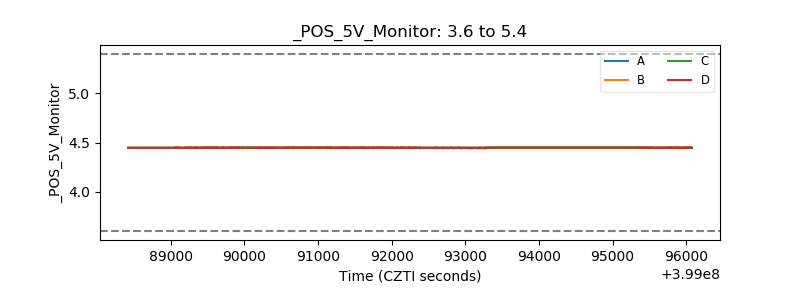 |
| _ROLL_ROT | 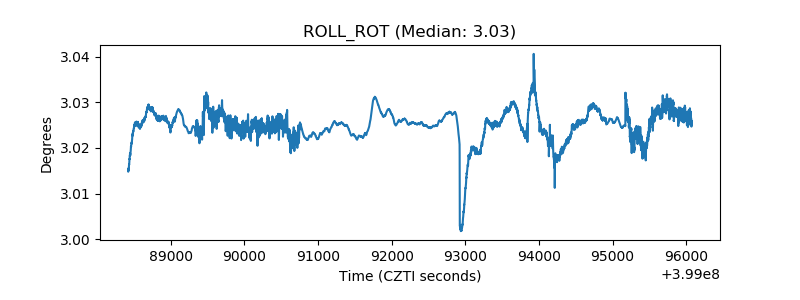 |
| _Roll_DEC | 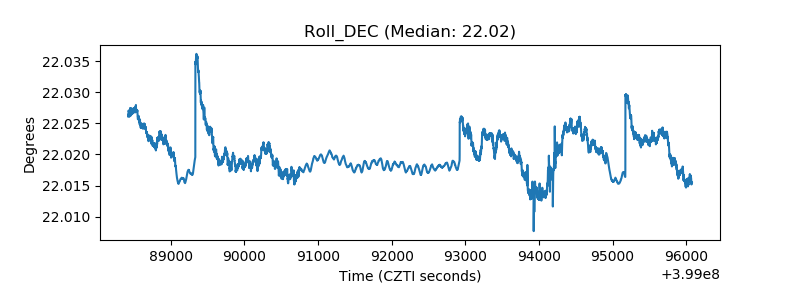 |
| _Roll_RA | 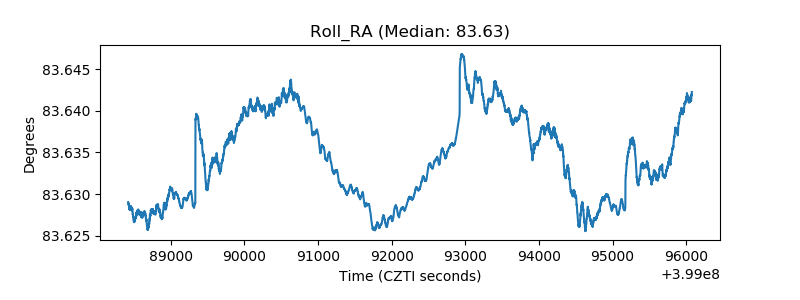 |
| Veto Counter | 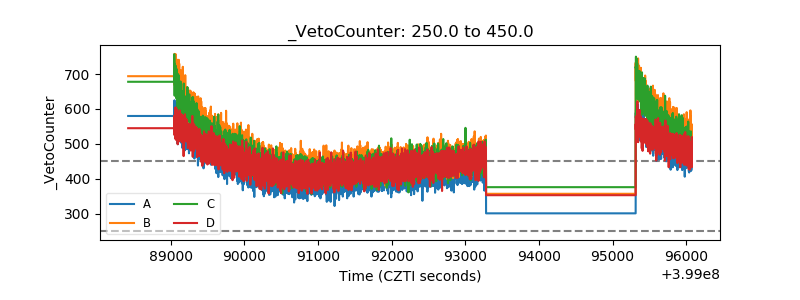 |