| Param | Original file | Final file |
|---|---|---|
| Filename | modeM0/AS1C07_014T01_9000005314_37347cztM0_level2.evt | modeM0/AS1C07_014T01_9000005314_37347cztM0_level2_quad_clean.evt |
| Size (bytes) | 763,689,600 | 78,312,960 |
| Size | 728.3 MB | 74.7 MB |
| Events in quadrant A | 3,025,660 | 555,725 |
| Events in quadrant B | 3,315,772 | 572,791 |
| Events in quadrant C | 10,770,143 | 378,818 |
| Events in quadrant D | 5,663,530 | 496,307 |
| Mode M0 | |||
|---|---|---|---|
| Quadrant | BADHDUFLAG | Total packets | Discarded packets |
| A | 0 | 12145 | 3 |
| B | 0 | 13108 | 2 |
| C | 0 | 35536 | 2 |
| D | 0 | 20334 | 2 |
| Mode M9 | |||
|---|---|---|---|
| Quadrant | BADHDUFLAG | Total packets | Discarded packets |
| A | 0 | 23 | 0 |
| B | 0 | 23 | 0 |
| C | 0 | 23 | 0 |
| D | 0 | 24 | 0 |
| Mode SS | |||
|---|---|---|---|
| Quadrant | BADHDUFLAG | Total packets | Discarded packets |
| A | 0 | 108 | 0 |
| B | 0 | 108 | 0 |
| C | 0 | 108 | 0 |
| D | 0 | 108 | 0 |
| Quadrant | Total seconds | Saturated seconds | Saturation percentage |
|---|---|---|---|
| A | 5232 | 39 | 0.745413% |
| B | 5232 | 175 | 3.344801% |
| C | 5232 | 3405 | 65.080275% |
| D | 5232 | 943 | 18.023700% |
Noise dominated data is calculated using 1-second bins in cleaned event files. If a bin has >2000 counts, and if more than 50% of those come from <1% of pixels, then it is considered to be noise-dominated and hence unusable.
| Quadrant | # 1 sec bins | Bins with >0 counts | Bins with >2000 counts | High rate bins dominated by noise | Noise dominated (total time) | Noise dominated (detector-on time) | Marked lightcurve |
|---|---|---|---|---|---|---|---|
| A | 7355 | 5233 | 22 | 22 | 0.30% | 0.42% | 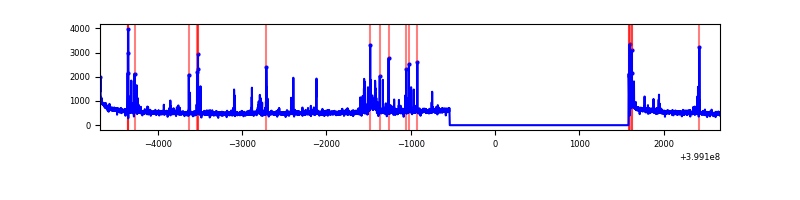 |
| B | 7355 | 5233 | 124 | 124 | 1.69% | 2.37% | 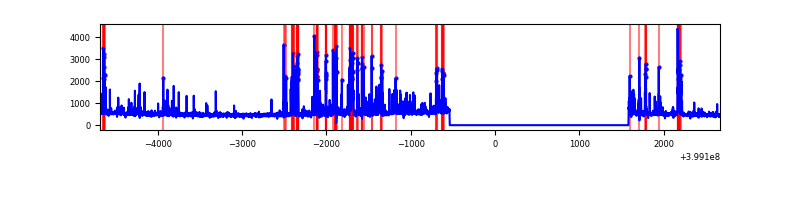 |
| C | 7355 | 5233 | 3220 | 3220 | 43.78% | 61.53% | 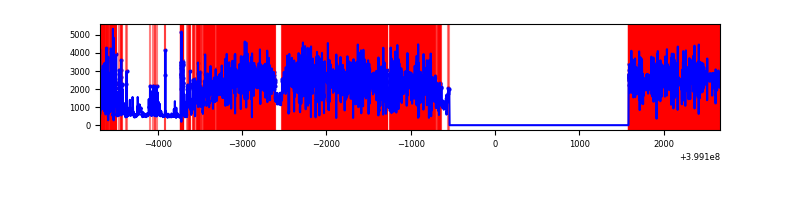 |
| D | 7355 | 5233 | 853 | 853 | 11.60% | 16.30% | 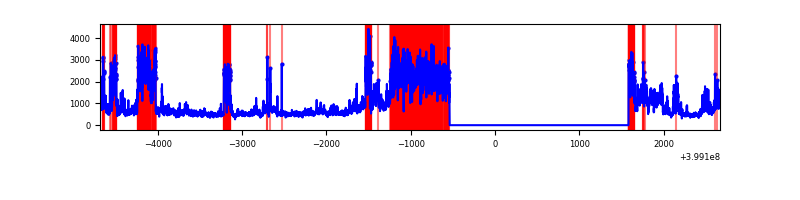 |
Top three noisy pixels from each quadrant. If the there are fewer than three noisy pixels in the level2.evt file, extra rows are filled as -1
| Pixel properties | Quadrant properties | ||||||
|---|---|---|---|---|---|---|---|
| Quadrant | DetID | PixID | Counts | Sigma | Mean | Median | Sigma |
| A | 10 | 83 | 272106 | 2088.74 | 647 | 637 | 130.0 |
| A | 9 | 143 | 127195 | 973.76 | 647 | 637 | 130.0 |
| A | 15 | 237 | 56206 | 427.56 | 647 | 637 | 130.0 |
| B | 5 | 255 | 332813 | 2706.95 | 643 | 629 | 122.7 |
| B | 5 | 172 | 301501 | 2451.79 | 643 | 629 | 122.7 |
| B | 0 | 190 | 44542 | 357.85 | 643 | 629 | 122.7 |
| C | 1 | 23 | 8733515 | 88822.39 | 422 | 426 | 98.3 |
| C | 14 | 254 | 159303 | 1615.9 | 422 | 426 | 98.3 |
| C | 15 | 214 | 154437 | 1566.41 | 422 | 426 | 98.3 |
| D | 12 | 227 | 1976378 | 13998.08 | 577 | 563 | 141.1 |
| D | 12 | 235 | 1150844 | 8149.41 | 577 | 563 | 141.1 |
| D | 12 | 233 | 126522 | 892.38 | 577 | 563 | 141.1 |
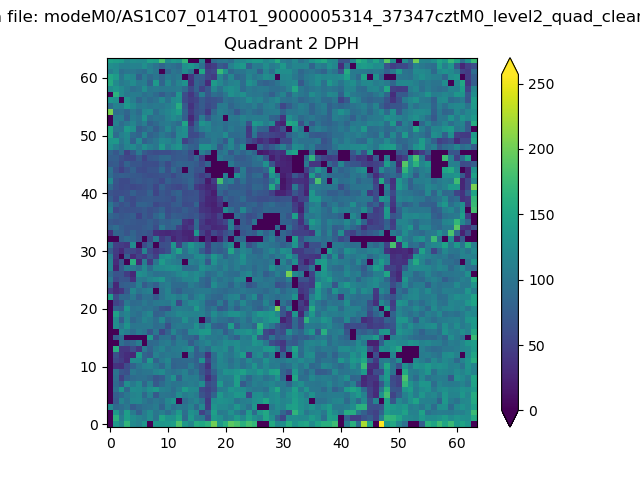
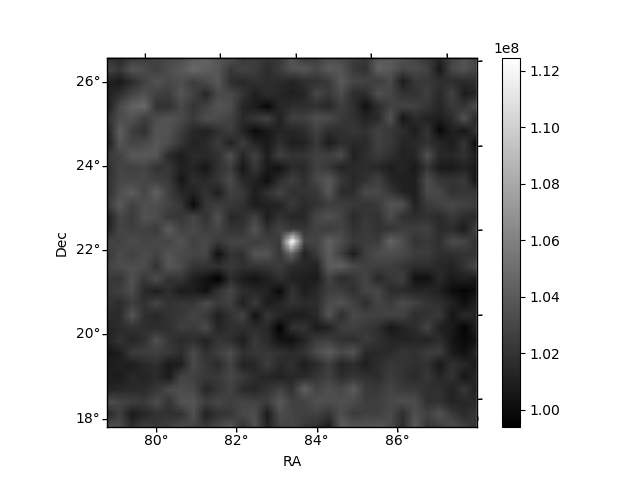
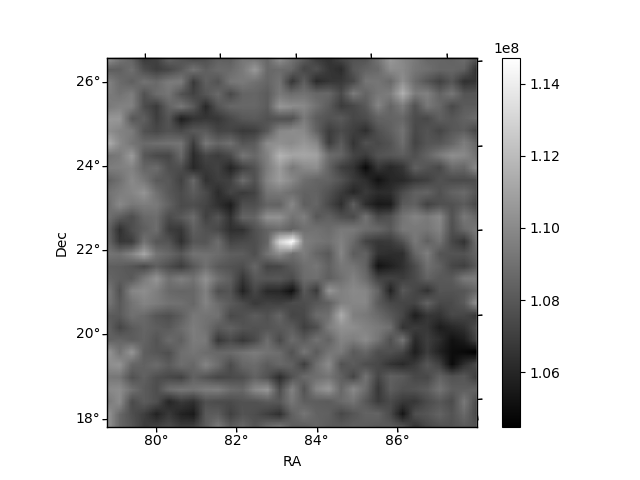
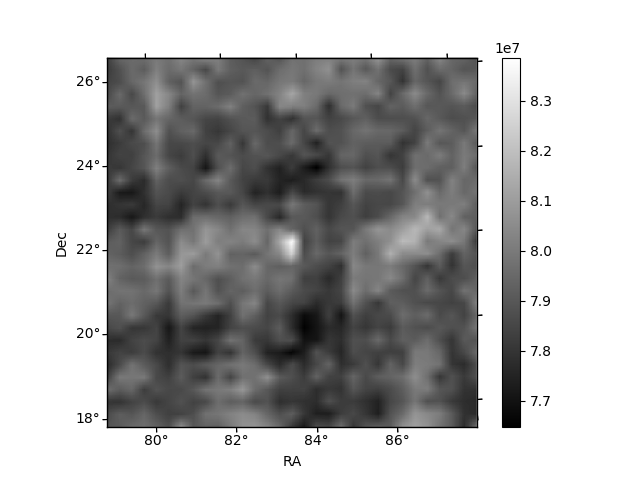
Histogram calculated using DETX and DETY for each event in the final _common_clean file
| Quadrant A | 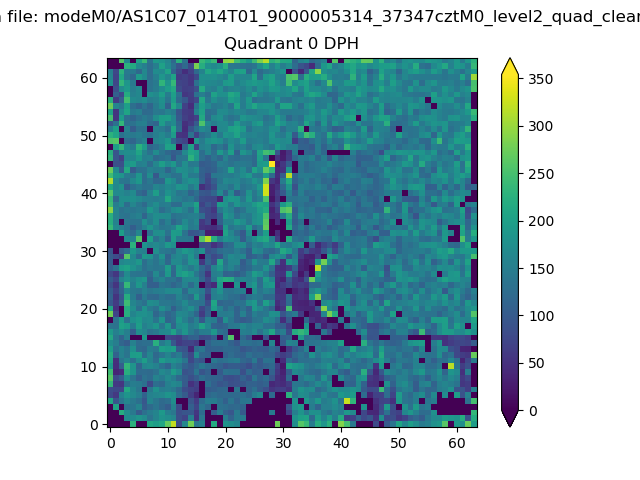 |
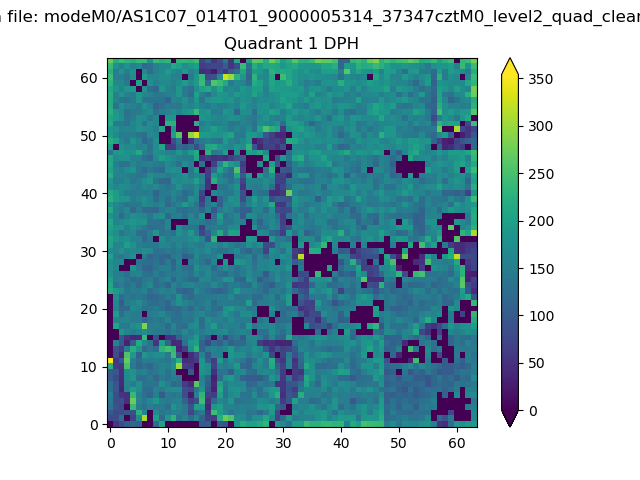 |
Quadrant B |
|---|---|---|---|
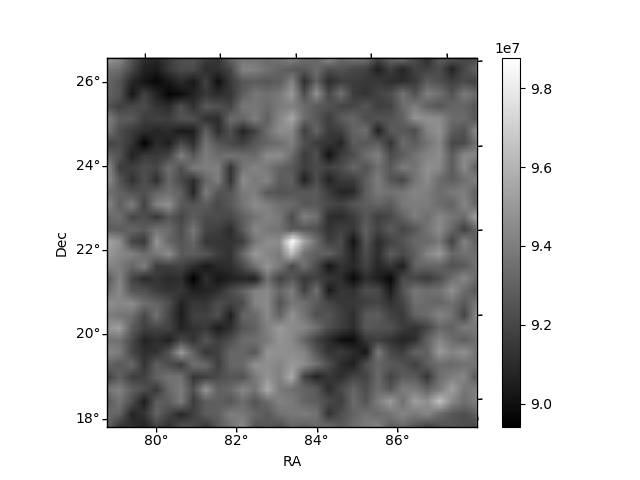
| Quadrant D | 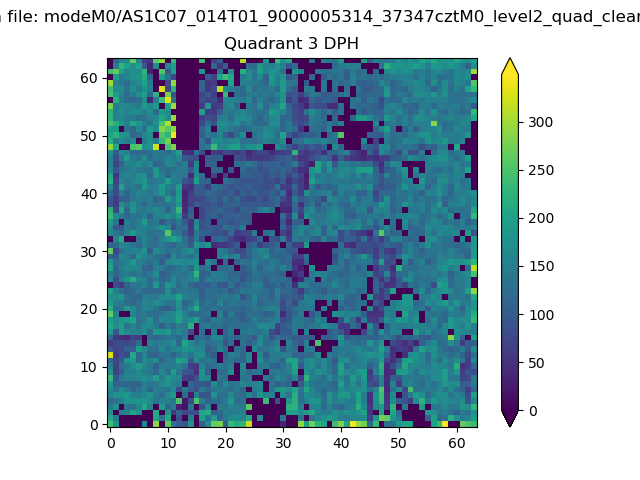 |
 |
Quadrant C |
| Plot type | Count rate plots | Images |
|---|---|---|
| Comparison with Poisson distribution Blue bars denote a histogram of data divided into 1 sec bins. Red curve is a Poisson curve with rate = median count rate of data. |
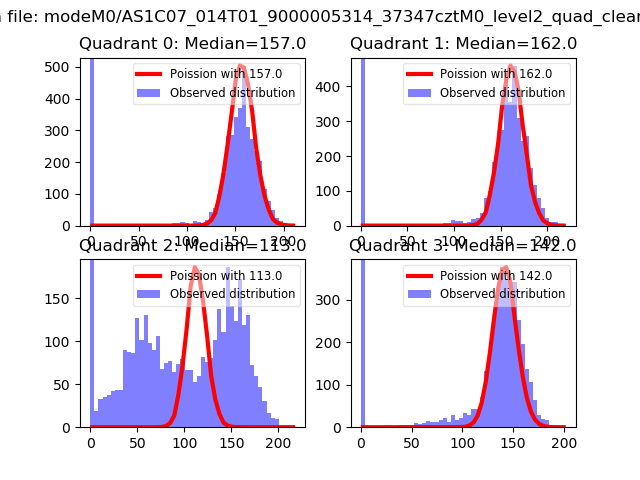 |
 |
| Quadrant-wise count rates Data is divided into 100 sec bins |
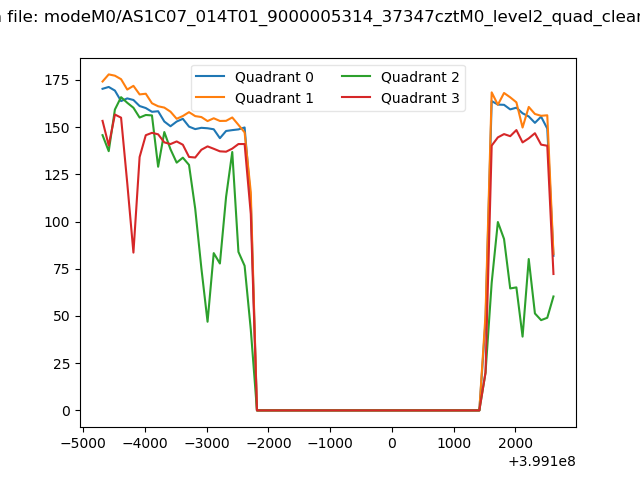 |
|
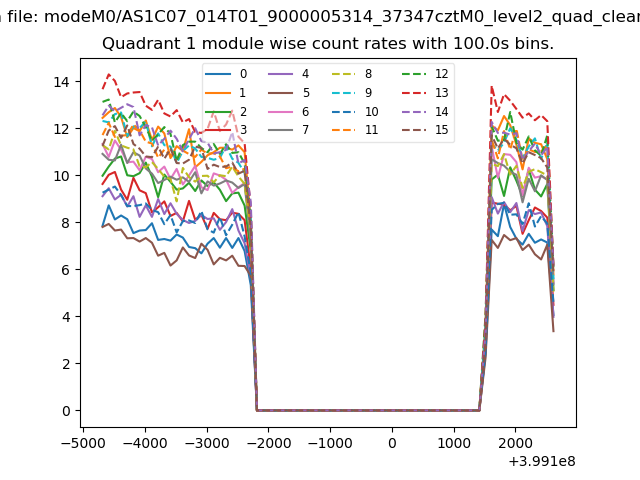
| Module-wise count rates for Quadrant A Data is divided into 100 sec bins |
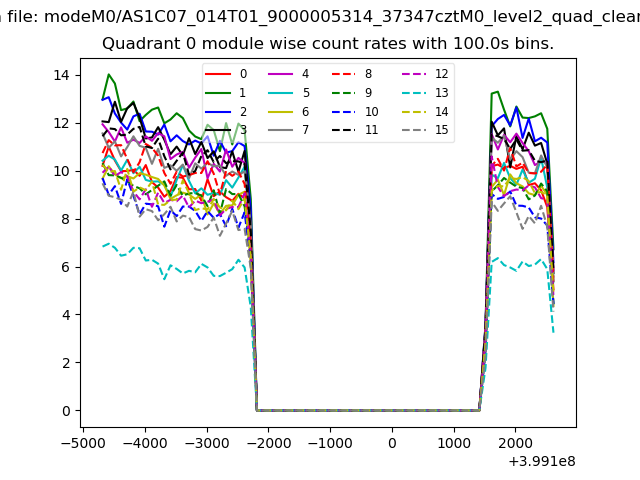 |
 |
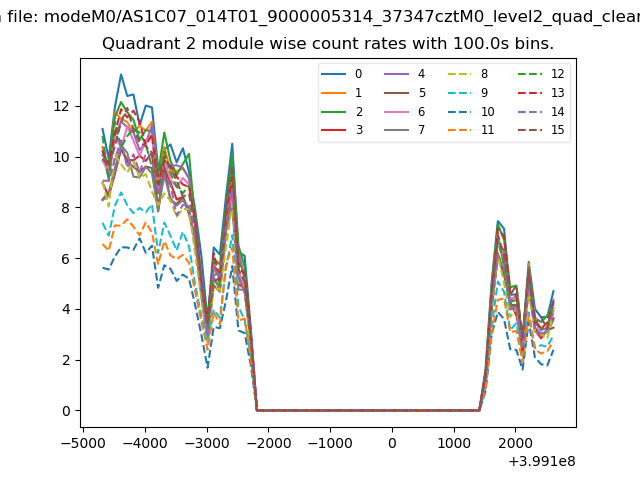
| Module-wise count rates for Quadrant B Data is divided into 100 sec bins |
 |
 |
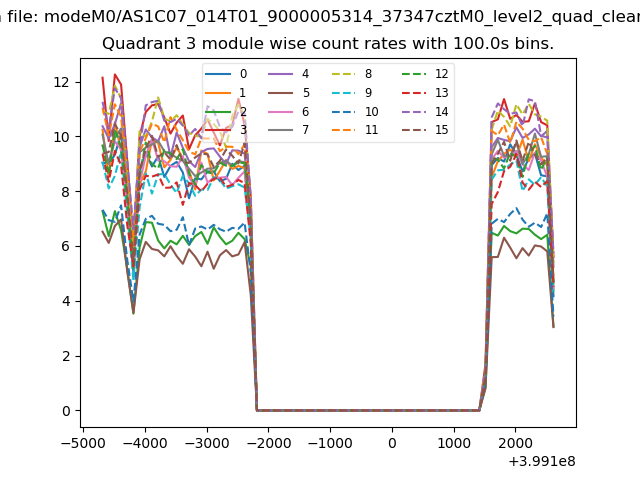
| Module-wise count rates for Quadrant C Data is divided into 100 sec bins |
 |
 |
| Module-wise count rates for Quadrant D Data is divided into 100 sec bins |
 |
 |
| Parameter | Plot |
|---|---|
| CZT HV Monitor | 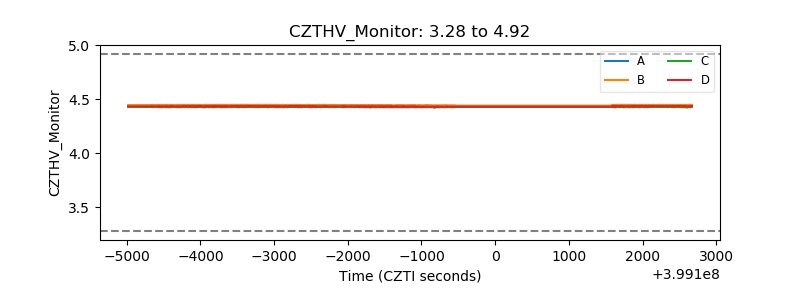 |
| D_VDD | 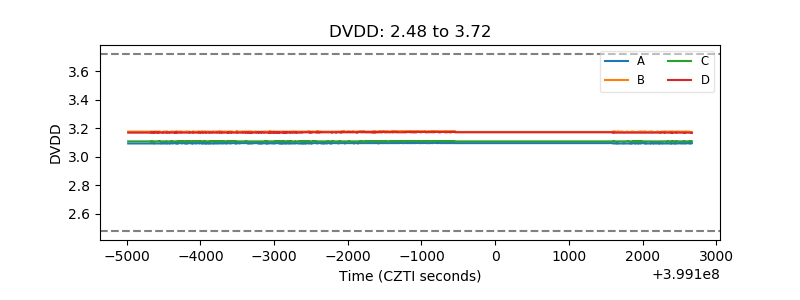 |
| Temperature 1 | 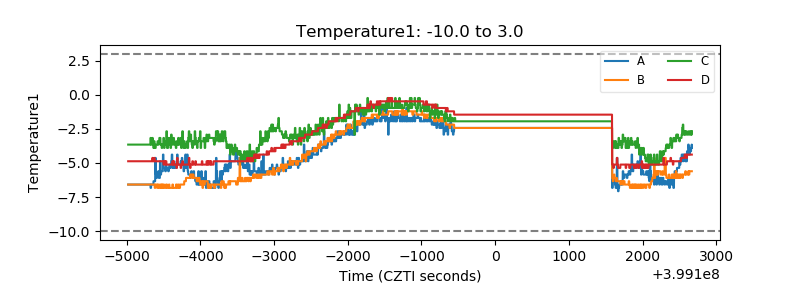 |
| Veto HV Monitor |  |
| Veto LLD | 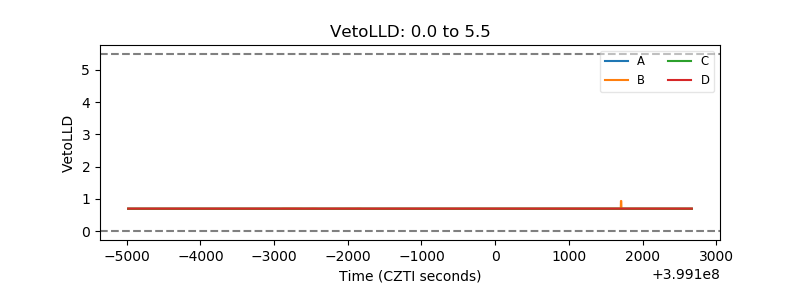 |
| Alpha Counter | 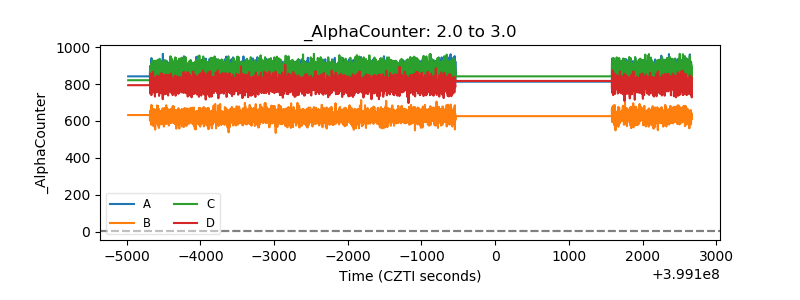 |
| _CPM_Rate | 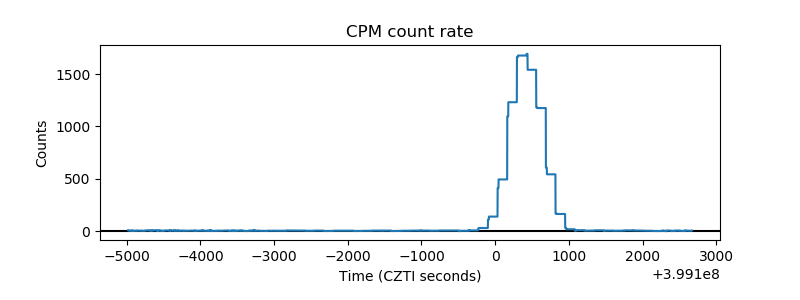 |
| CZT Counter | 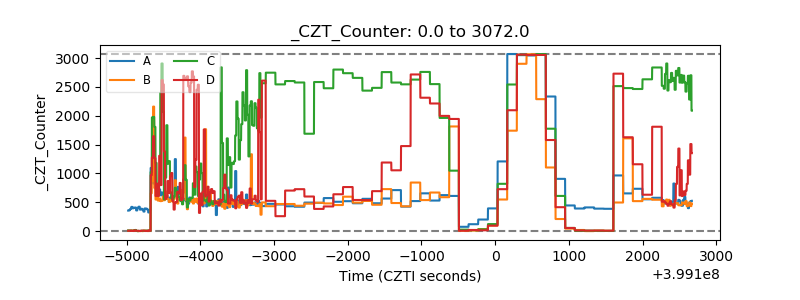 |
| +2.5 Volts monitor | 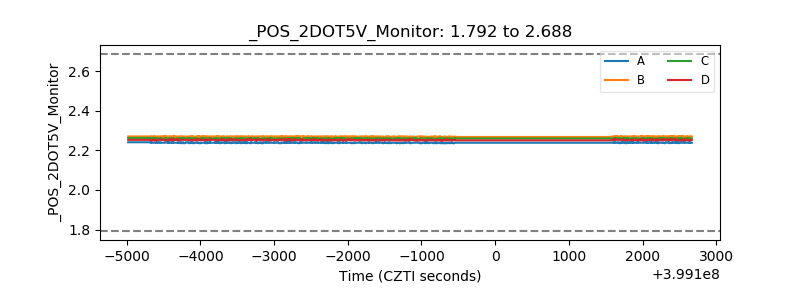 |
| +5 Volts monitor | 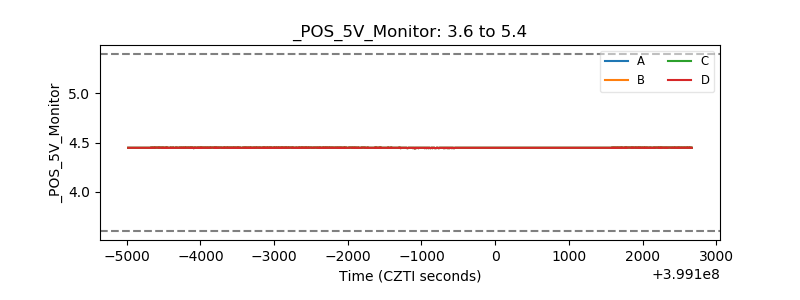 |
| _ROLL_ROT | 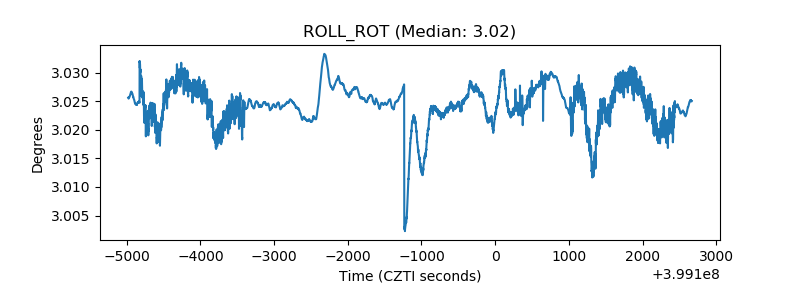 |
| _Roll_DEC | 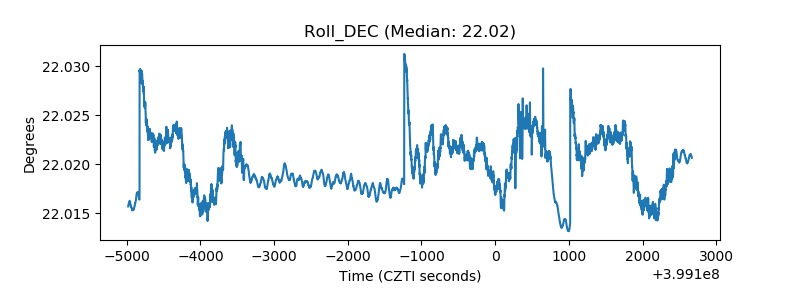 |
| _Roll_RA | 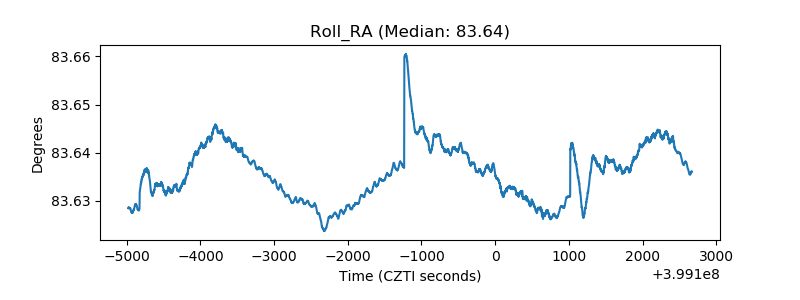 |
| Veto Counter | 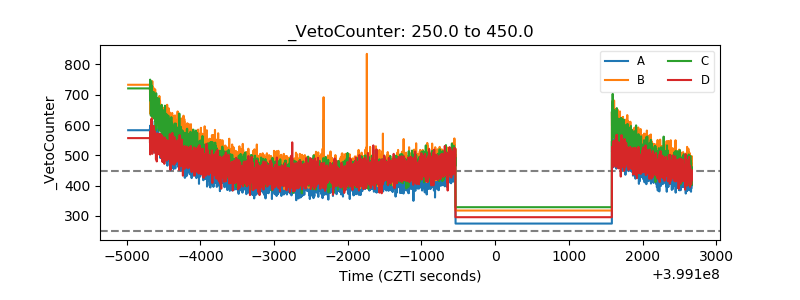 |