| Param | Original file | Final file |
|---|---|---|
| Filename | modeM0/AS1C07_014T01_9000005314_37348cztM0_level2.evt | modeM0/AS1C07_014T01_9000005314_37348cztM0_level2_quad_clean.evt |
| Size (bytes) | 747,976,320 | 65,154,240 |
| Size | 713.3 MB | 62.1 MB |
| Events in quadrant A | 2,718,379 | 456,192 |
| Events in quadrant B | 3,020,174 | 467,421 |
| Events in quadrant C | 9,293,781 | 316,686 |
| Events in quadrant D | 7,275,639 | 373,445 |
| Mode M0 | |||
|---|---|---|---|
| Quadrant | BADHDUFLAG | Total packets | Discarded packets |
| A | 0 | 10960 | 2 |
| B | 0 | 12170 | 1 |
| C | 0 | 31063 | 1 |
| D | 0 | 25075 | 1 |
| Mode M9 | |||
|---|---|---|---|
| Quadrant | BADHDUFLAG | Total packets | Discarded packets |
| A | 0 | 22 | 0 |
| B | 0 | 22 | 0 |
| C | 0 | 22 | 0 |
| D | 0 | 22 | 0 |
| Mode SS | |||
|---|---|---|---|
| Quadrant | BADHDUFLAG | Total packets | Discarded packets |
| A | 0 | 104 | 0 |
| B | 0 | 104 | 0 |
| C | 0 | 104 | 0 |
| D | 0 | 104 | 0 |
| Quadrant | Total seconds | Saturated seconds | Saturation percentage |
|---|---|---|---|
| A | 5106 | 9 | 0.176263% |
| B | 5106 | 101 | 1.978065% |
| C | 5106 | 2753 | 53.916960% |
| D | 5106 | 1572 | 30.787309% |
Noise dominated data is calculated using 1-second bins in cleaned event files. If a bin has >2000 counts, and if more than 50% of those come from <1% of pixels, then it is considered to be noise-dominated and hence unusable.
| Quadrant | # 1 sec bins | Bins with >0 counts | Bins with >2000 counts | High rate bins dominated by noise | Noise dominated (total time) | Noise dominated (detector-on time) | Marked lightcurve |
|---|---|---|---|---|---|---|---|
| A | 7259 | 5107 | 4 | 4 | 0.06% | 0.08% | 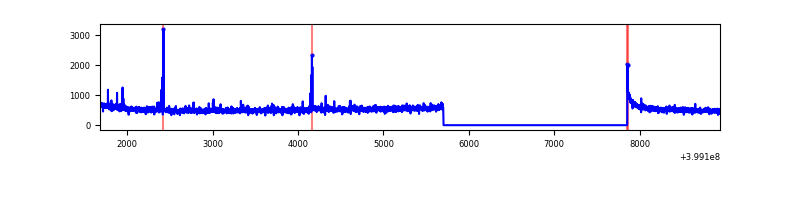 |
| B | 7259 | 5107 | 52 | 52 | 0.72% | 1.02% | 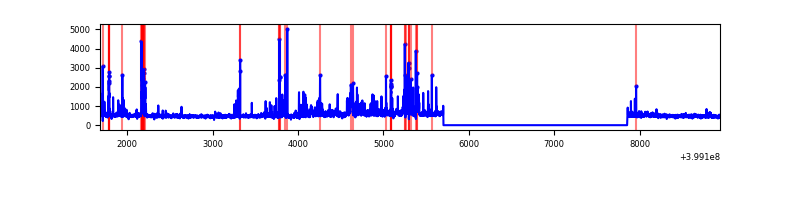 |
| C | 7259 | 5107 | 2593 | 2593 | 35.72% | 50.77% | 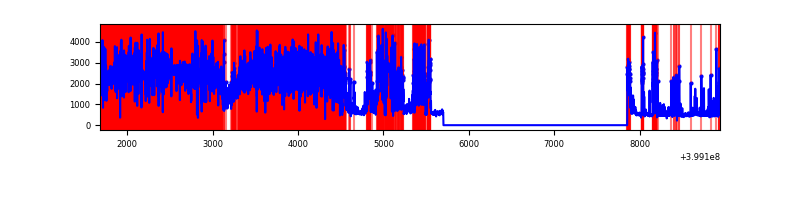 |
| D | 7259 | 5107 | 1423 | 1423 | 19.60% | 27.86% | 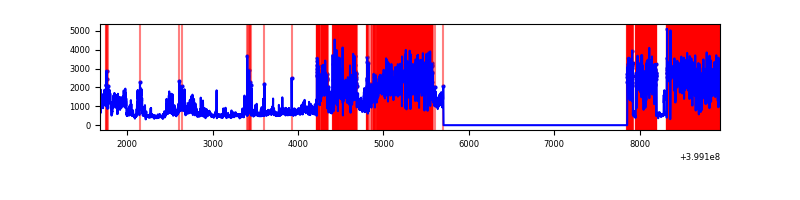 |
Top three noisy pixels from each quadrant. If the there are fewer than three noisy pixels in the level2.evt file, extra rows are filled as -1
| Pixel properties | Quadrant properties | ||||||
|---|---|---|---|---|---|---|---|
| Quadrant | DetID | PixID | Counts | Sigma | Mean | Median | Sigma |
| A | 10 | 83 | 245757 | 1940.99 | 623 | 613 | 126.3 |
| A | 9 | 143 | 31078 | 241.21 | 623 | 613 | 126.3 |
| A | 15 | 237 | 18288 | 139.95 | 623 | 613 | 126.3 |
| B | 5 | 255 | 237558 | 2008.15 | 615 | 602 | 118.0 |
| B | 0 | 190 | 182112 | 1538.25 | 615 | 602 | 118.0 |
| B | 5 | 172 | 140042 | 1181.72 | 615 | 602 | 118.0 |
| C | 1 | 23 | 7081697 | 66711.68 | 452 | 456 | 106.1 |
| C | 14 | 254 | 177544 | 1668.33 | 452 | 456 | 106.1 |
| C | 15 | 214 | 169176 | 1589.49 | 452 | 456 | 106.1 |
| D | 12 | 227 | 3883534 | 30155.63 | 523 | 509 | 128.8 |
| D | 12 | 235 | 963667 | 7479.9 | 523 | 509 | 128.8 |
| D | 12 | 233 | 108056 | 835.21 | 523 | 509 | 128.8 |
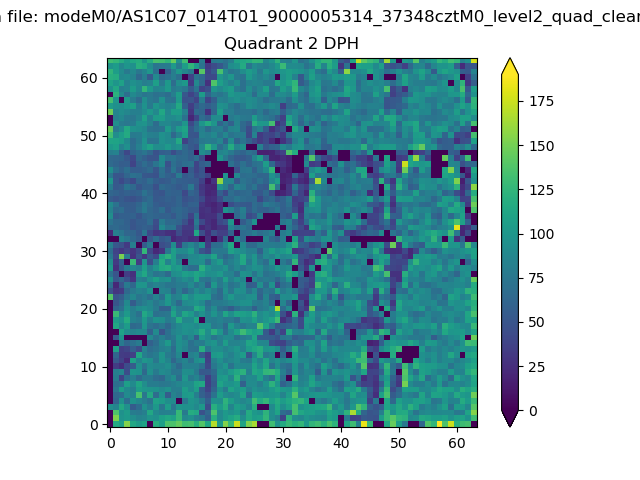
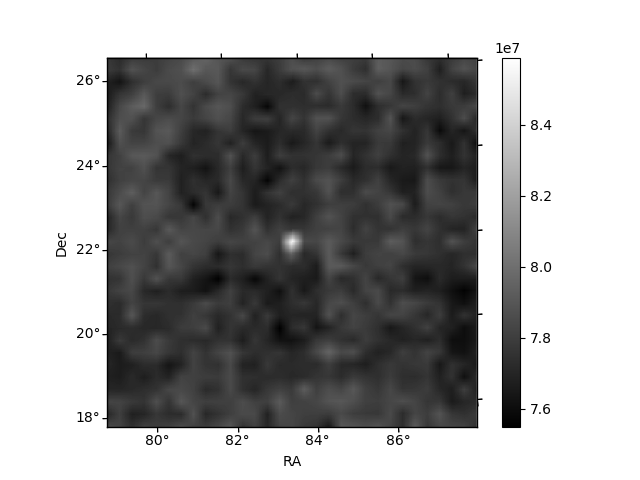
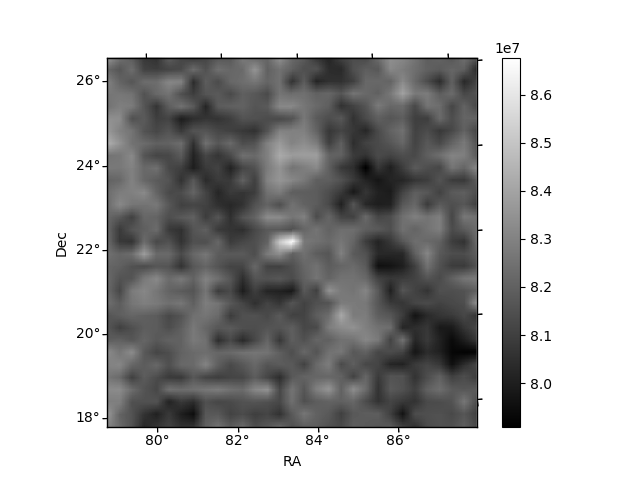
Histogram calculated using DETX and DETY for each event in the final _common_clean file
| Quadrant A | 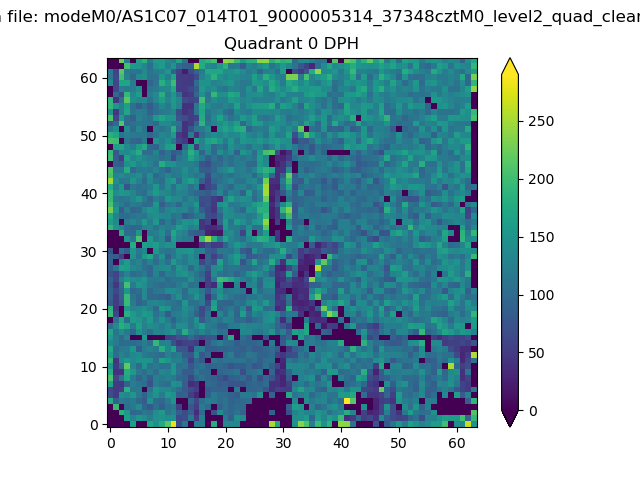 |
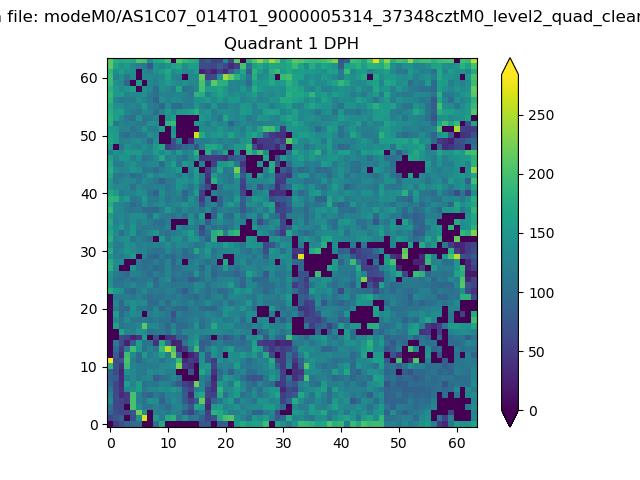 |
Quadrant B |
|---|---|---|---|
| Quadrant D | 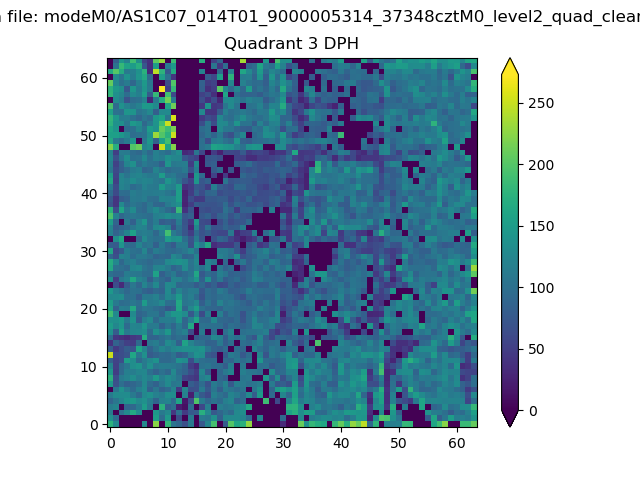 |
 |
Quadrant C |
| Plot type | Count rate plots | Images |
|---|---|---|
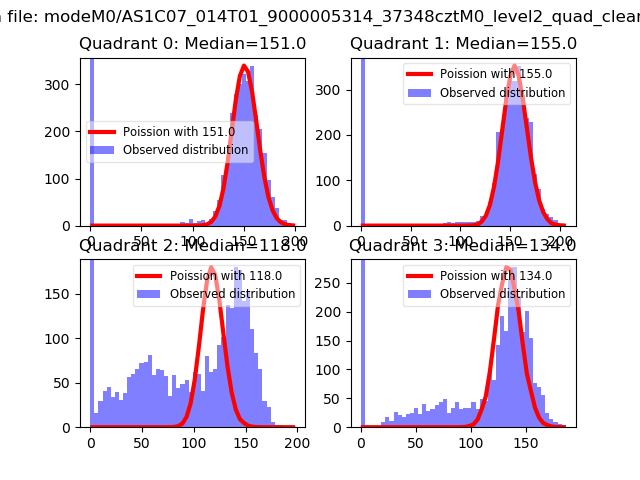
| Comparison with Poisson distribution Blue bars denote a histogram of data divided into 1 sec bins. Red curve is a Poisson curve with rate = median count rate of data. |
 |
 |
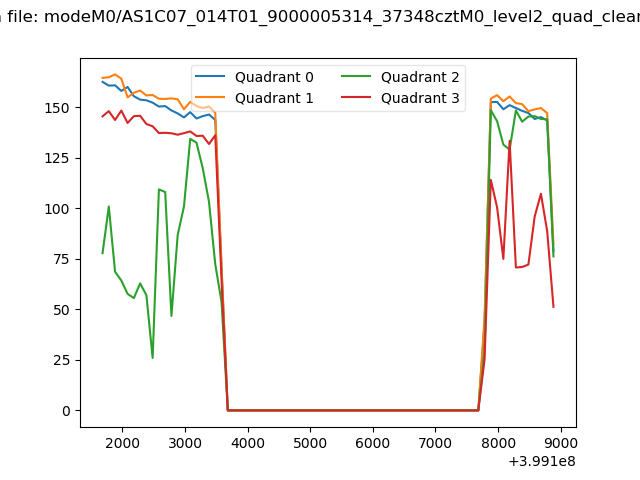
| Quadrant-wise count rates Data is divided into 100 sec bins |
 |
|
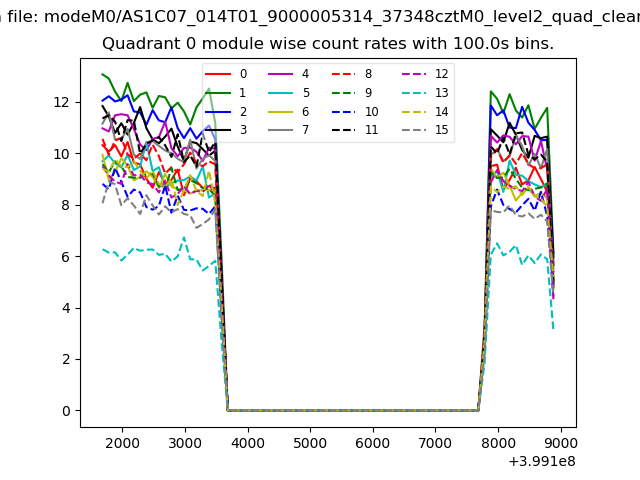
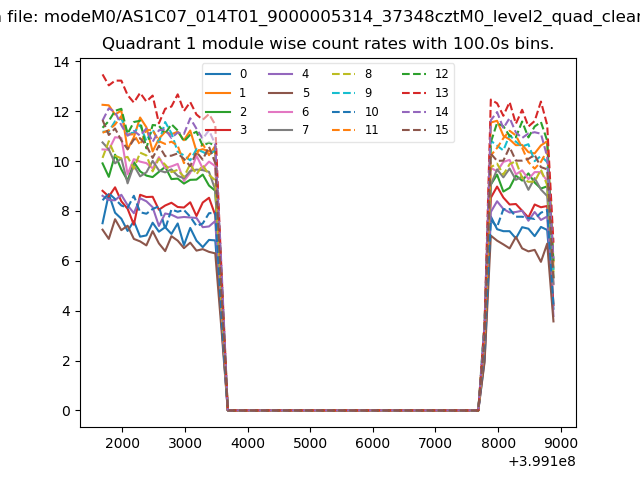
| Module-wise count rates for Quadrant A Data is divided into 100 sec bins |
 |
 |
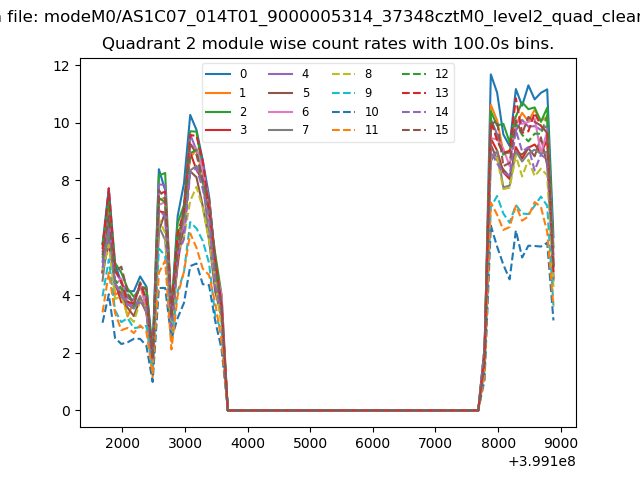
| Module-wise count rates for Quadrant B Data is divided into 100 sec bins |
 |
 |
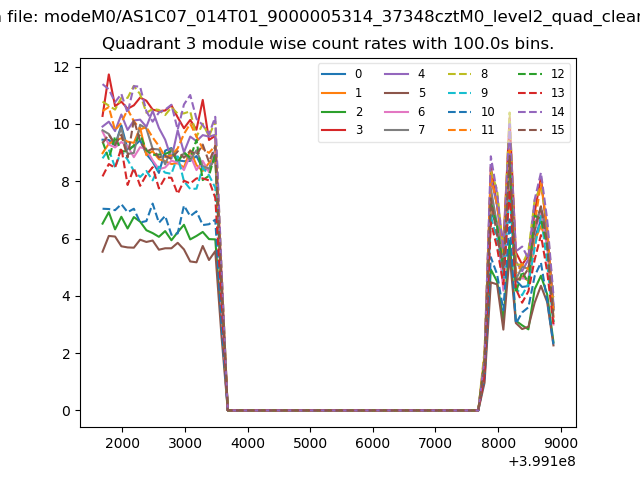
| Module-wise count rates for Quadrant C Data is divided into 100 sec bins |
 |
 |
| Module-wise count rates for Quadrant D Data is divided into 100 sec bins |
 |
 |
| Parameter | Plot |
|---|---|
| CZT HV Monitor | 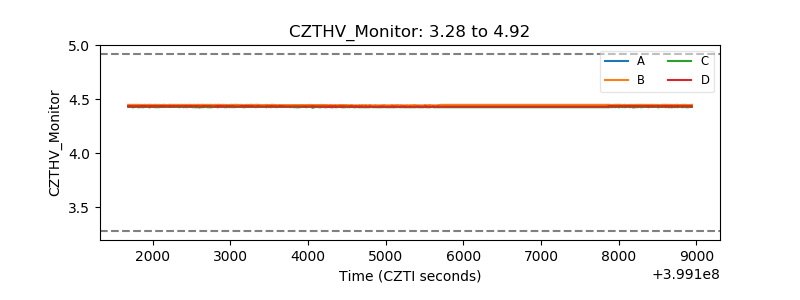 |
| D_VDD | 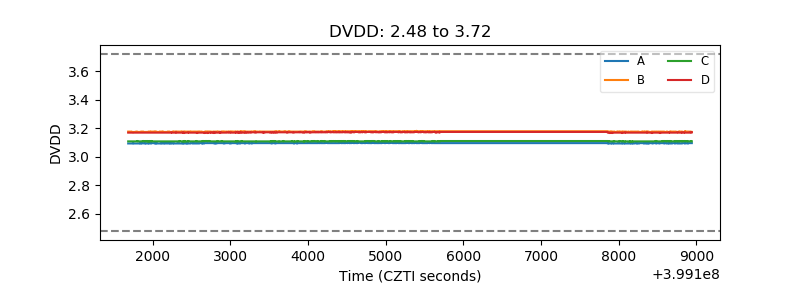 |
| Temperature 1 | 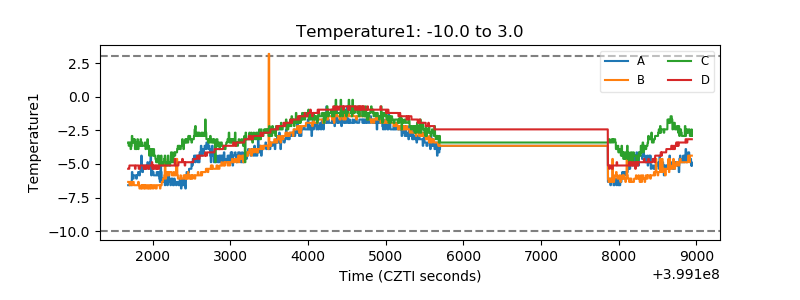 |
| Veto HV Monitor | 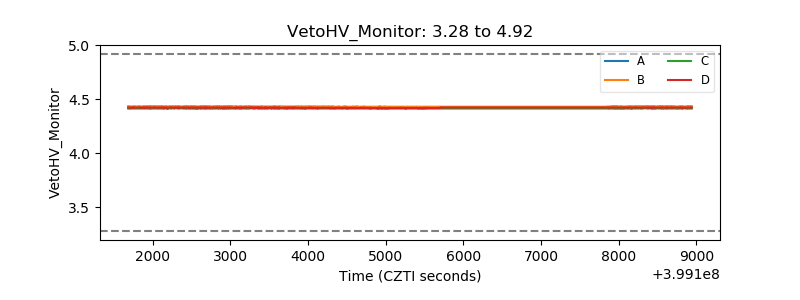 |
| Veto LLD | 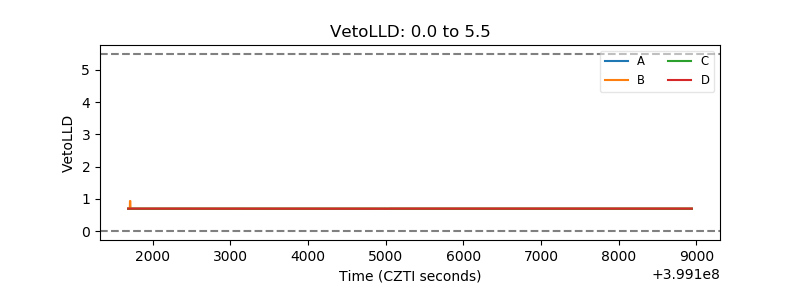 |
| Alpha Counter | 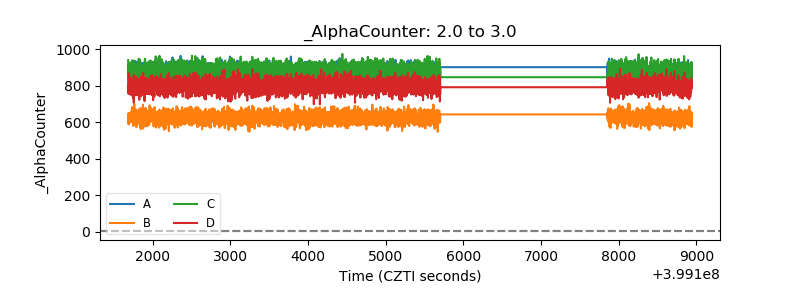 |
| _CPM_Rate | 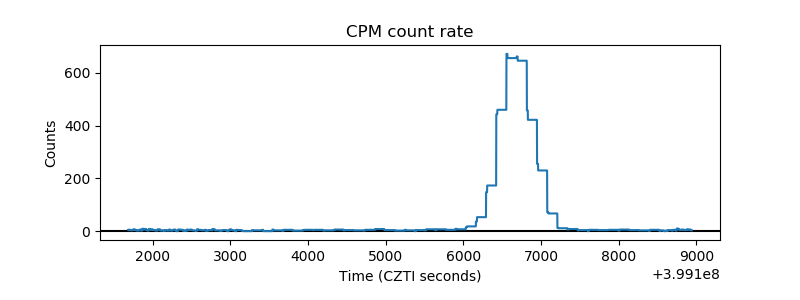 |
| CZT Counter | 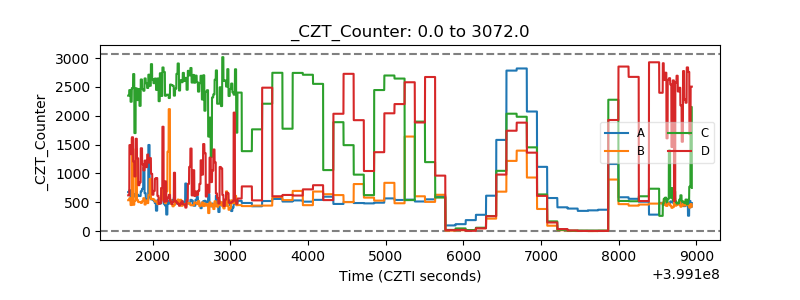 |
| +2.5 Volts monitor |  |
| +5 Volts monitor | 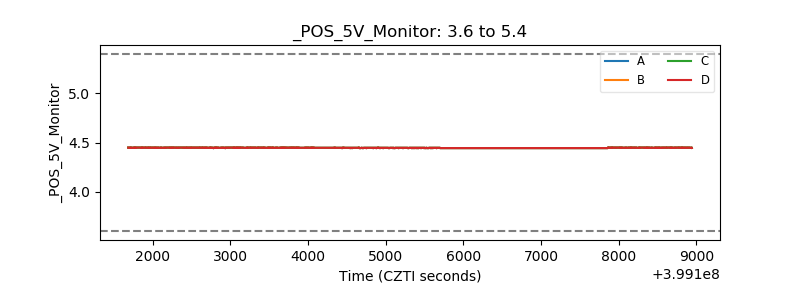 |
| _ROLL_ROT | 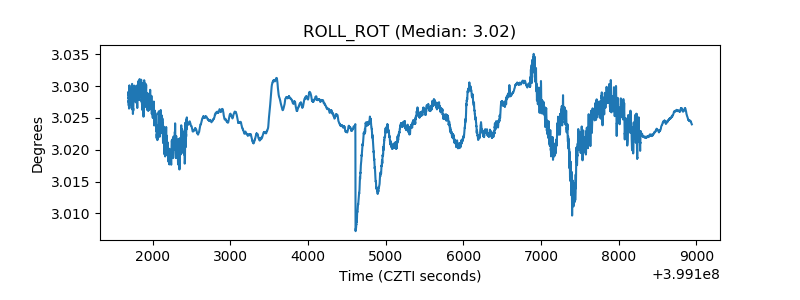 |
| _Roll_DEC | 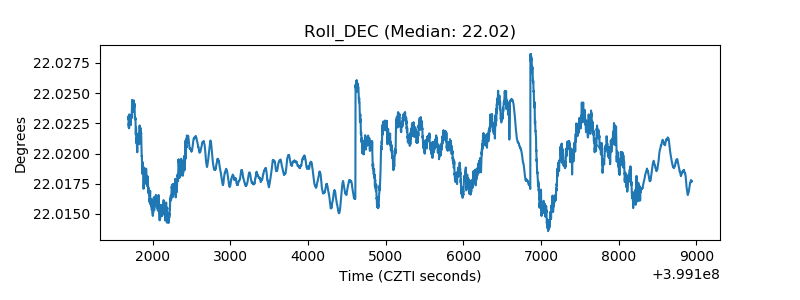 |
| _Roll_RA | 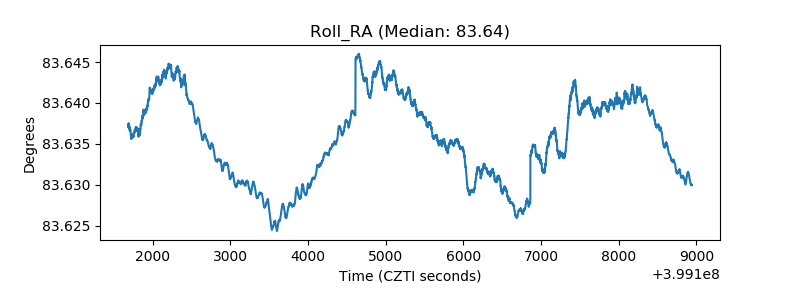 |
| Veto Counter | 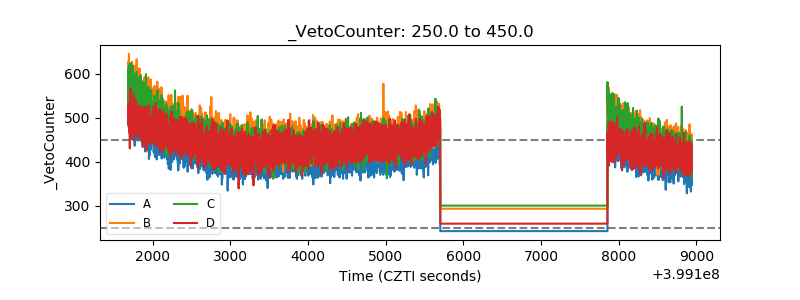 |