| Param | Original file | Final file |
|---|---|---|
| Filename | modeM0/AS1C07_014T01_9000005314_37349cztM0_level2.evt | modeM0/AS1C07_014T01_9000005314_37349cztM0_level2_quad_clean.evt |
| Size (bytes) | 584,686,080 | 53,164,800 |
| Size | 557.6 MB | 50.7 MB |
| Events in quadrant A | 2,512,623 | 360,647 |
| Events in quadrant B | 2,781,453 | 359,131 |
| Events in quadrant C | 3,479,870 | 352,381 |
| Events in quadrant D | 8,611,069 | 202,211 |
| Mode M0 | |||
|---|---|---|---|
| Quadrant | BADHDUFLAG | Total packets | Discarded packets |
| A | 0 | 10180 | 2 |
| B | 0 | 11158 | 1 |
| C | 0 | 13349 | 1 |
| D | 0 | 28882 | 1 |
| Mode M9 | |||
|---|---|---|---|
| Quadrant | BADHDUFLAG | Total packets | Discarded packets |
| A | 0 | 21 | 0 |
| B | 0 | 21 | 0 |
| C | 0 | 21 | 0 |
| D | 0 | 21 | 0 |
| Mode SS | |||
|---|---|---|---|
| Quadrant | BADHDUFLAG | Total packets | Discarded packets |
| A | 0 | 96 | 0 |
| B | 0 | 96 | 0 |
| C | 0 | 96 | 0 |
| D | 0 | 96 | 0 |
| Quadrant | Total seconds | Saturated seconds | Saturation percentage |
|---|---|---|---|
| A | 4765 | 18 | 0.377754% |
| B | 4765 | 139 | 2.917104% |
| C | 4765 | 135 | 2.833158% |
| D | 4765 | 2274 | 47.722980% |
Noise dominated data is calculated using 1-second bins in cleaned event files. If a bin has >2000 counts, and if more than 50% of those come from <1% of pixels, then it is considered to be noise-dominated and hence unusable.
| Quadrant | # 1 sec bins | Bins with >0 counts | Bins with >2000 counts | High rate bins dominated by noise | Noise dominated (total time) | Noise dominated (detector-on time) | Marked lightcurve |
|---|---|---|---|---|---|---|---|
| A | 6828 | 4766 | 4 | 4 | 0.06% | 0.08% | 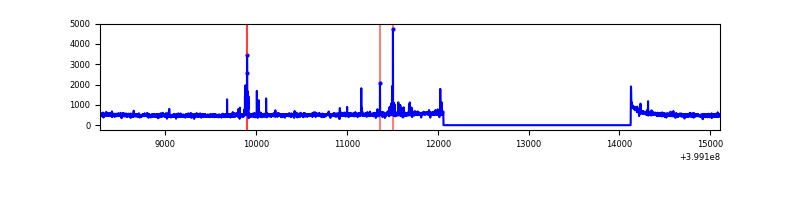 |
| B | 6828 | 4766 | 112 | 112 | 1.64% | 2.35% | 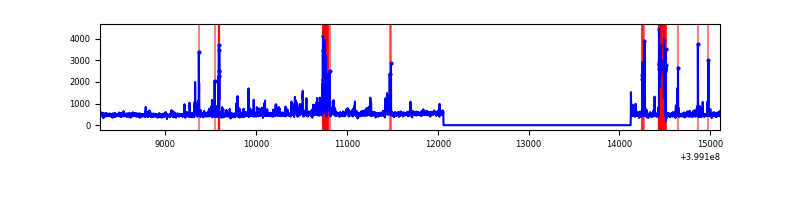 |
| C | 6828 | 4766 | 164 | 164 | 2.40% | 3.44% | 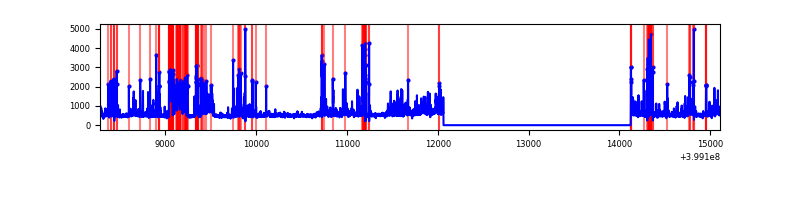 |
| D | 6827 | 4765 | 2063 | 2063 | 30.22% | 43.29% | 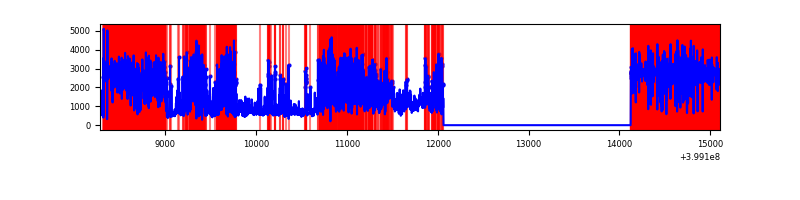 |
Top three noisy pixels from each quadrant. If the there are fewer than three noisy pixels in the level2.evt file, extra rows are filled as -1
| Pixel properties | Quadrant properties | ||||||
|---|---|---|---|---|---|---|---|
| Quadrant | DetID | PixID | Counts | Sigma | Mean | Median | Sigma |
| A | 10 | 83 | 213939 | 1845.53 | 572 | 563 | 115.6 |
| A | 15 | 237 | 42037 | 358.72 | 572 | 563 | 115.6 |
| A | 13 | 248 | 37055 | 315.63 | 572 | 563 | 115.6 |
| B | 5 | 172 | 396206 | 3670.55 | 558 | 544 | 107.8 |
| B | 0 | 190 | 128401 | 1186.13 | 558 | 544 | 107.8 |
| B | 5 | 255 | 30577 | 278.62 | 558 | 544 | 107.8 |
| C | 1 | 23 | 846437 | 6664.0 | 543 | 548 | 126.9 |
| C | 14 | 254 | 255603 | 2009.35 | 543 | 548 | 126.9 |
| C | 15 | 214 | 198700 | 1561.06 | 543 | 548 | 126.9 |
| D | 12 | 227 | 4906395 | 45496.32 | 432 | 420 | 107.8 |
| D | 12 | 235 | 1037306 | 9615.72 | 432 | 420 | 107.8 |
| D | 2 | 249 | 677752 | 6281.34 | 432 | 420 | 107.8 |
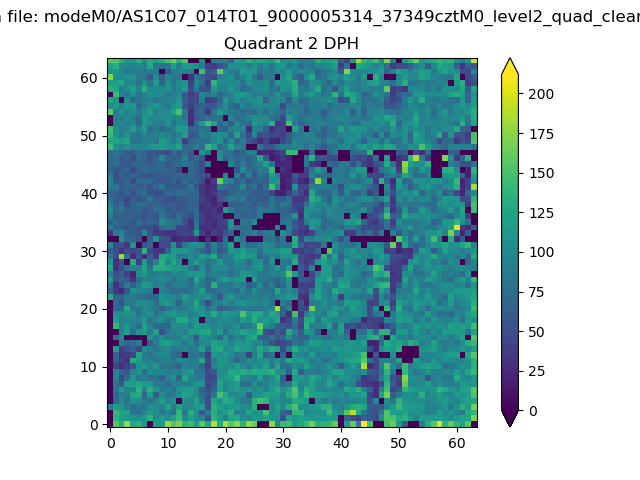
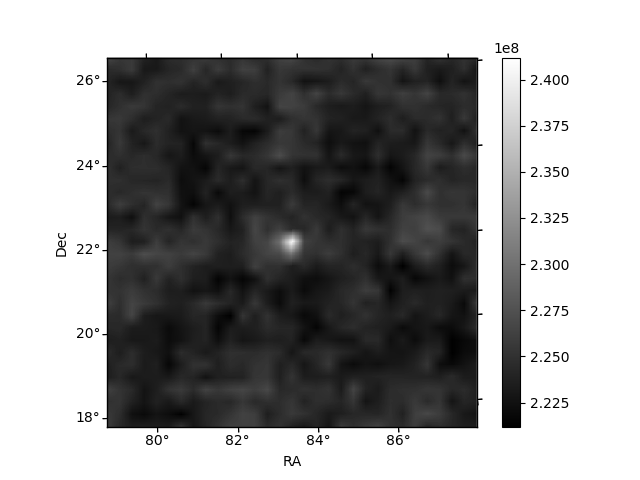
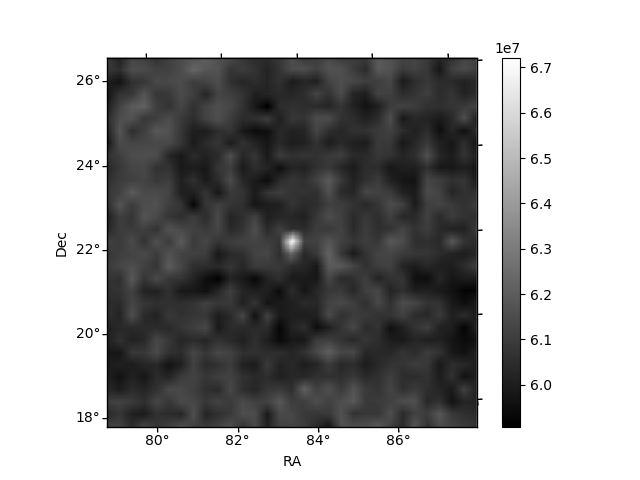
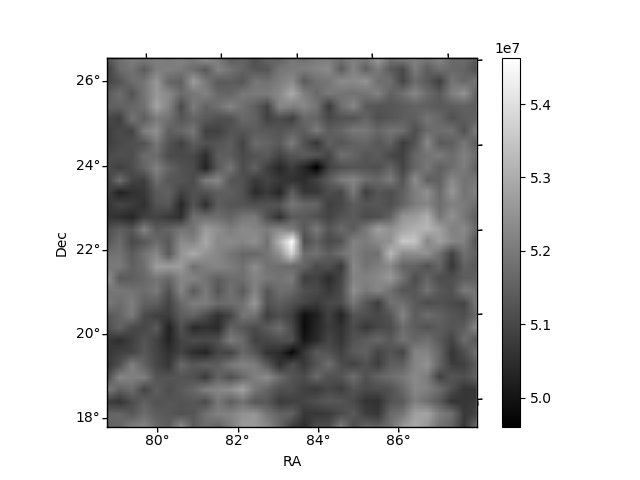
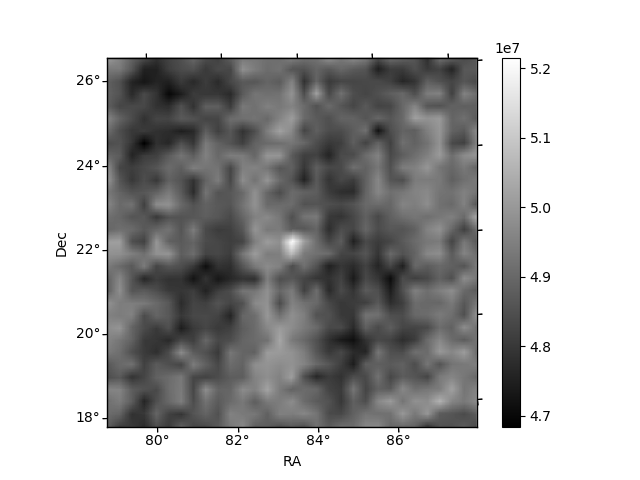
Histogram calculated using DETX and DETY for each event in the final _common_clean file
| Quadrant A | 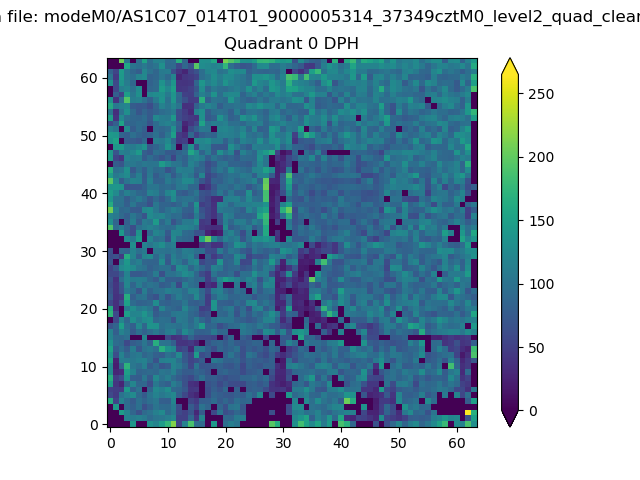 |
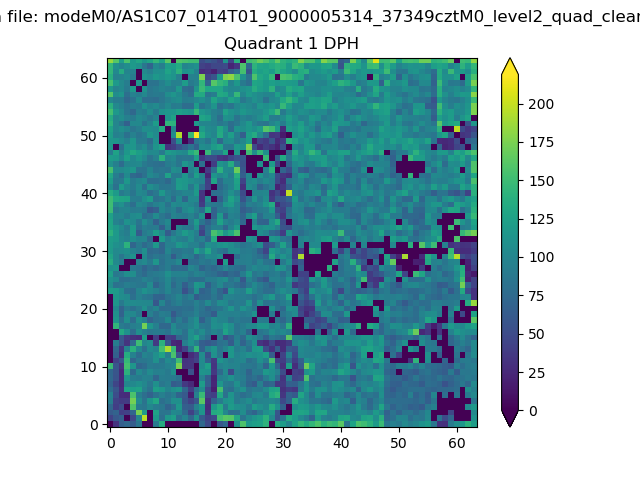 |
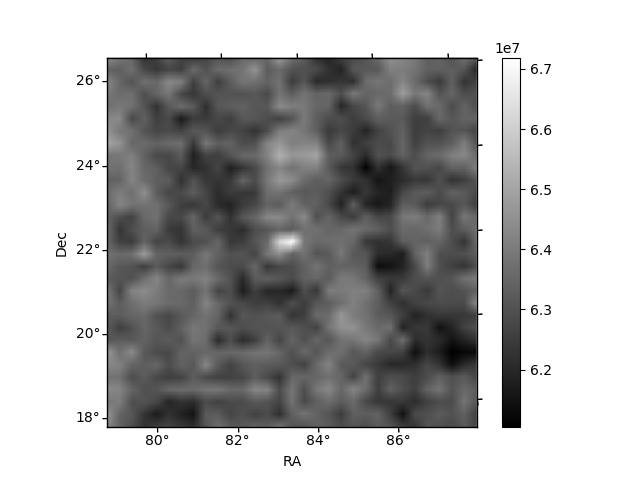
Quadrant B |
|---|---|---|---|
| Quadrant D | 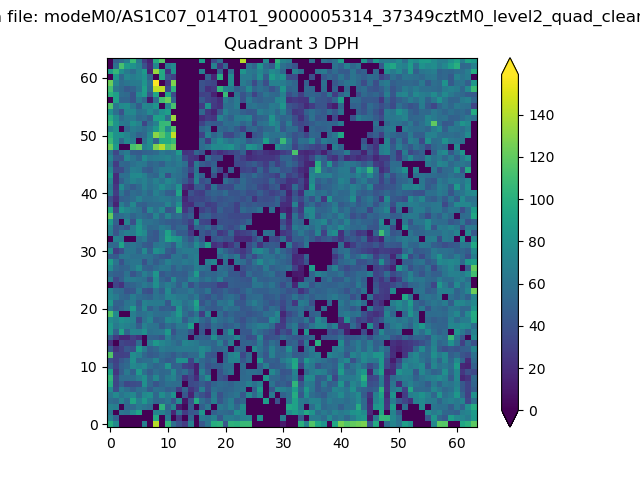 |
 |
Quadrant C |
| Plot type | Count rate plots | Images |
|---|---|---|
| Comparison with Poisson distribution Blue bars denote a histogram of data divided into 1 sec bins. Red curve is a Poisson curve with rate = median count rate of data. |
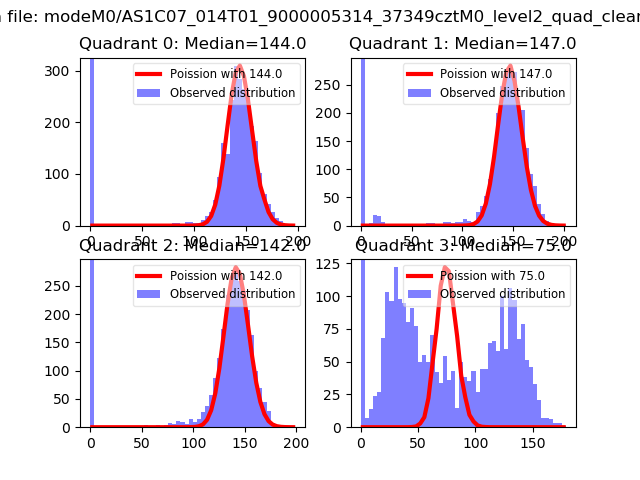 |
 |
| Quadrant-wise count rates Data is divided into 100 sec bins |
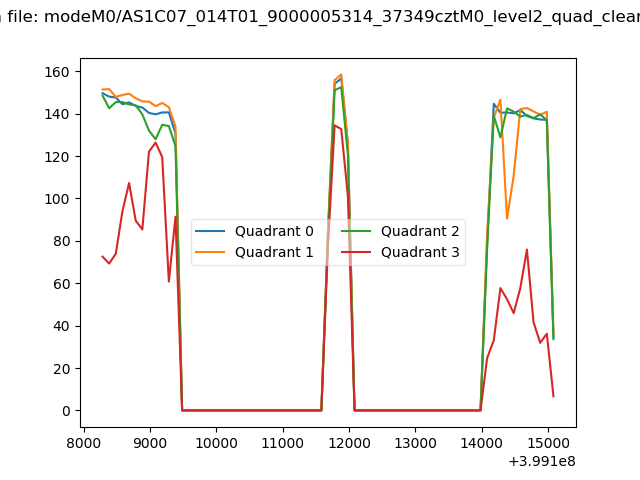 |
|
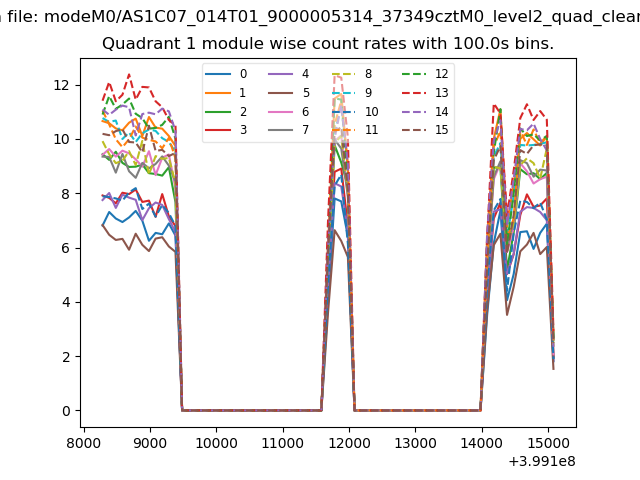
| Module-wise count rates for Quadrant A Data is divided into 100 sec bins |
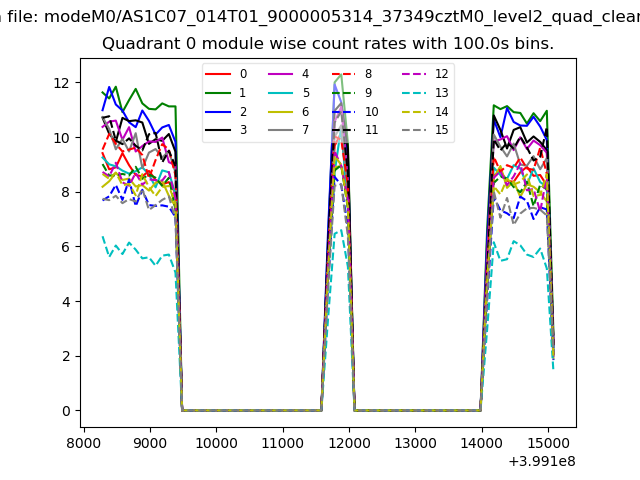 |
 |
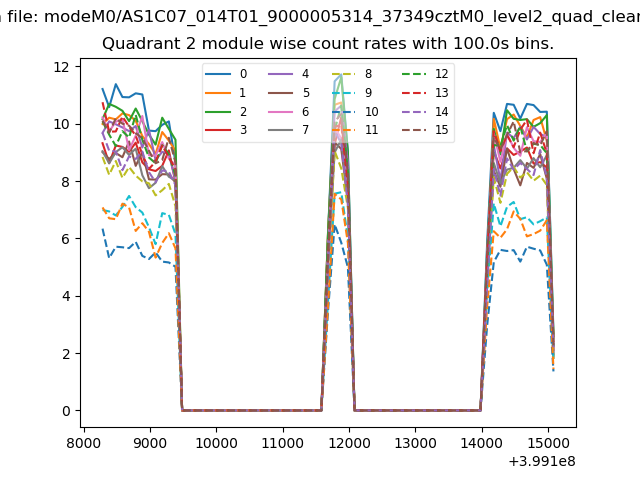
| Module-wise count rates for Quadrant B Data is divided into 100 sec bins |
 |
 |
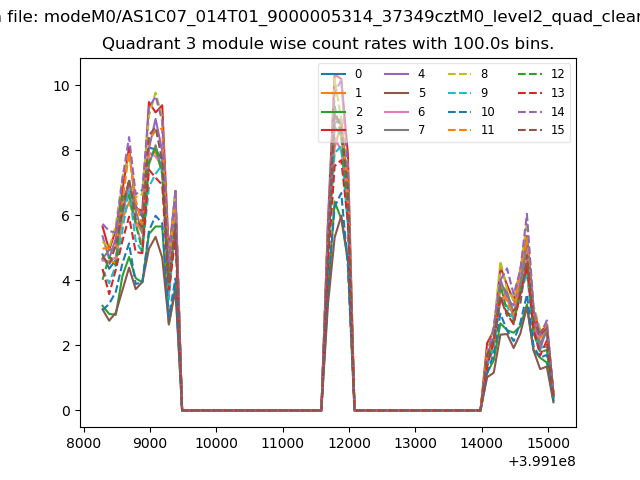
| Module-wise count rates for Quadrant C Data is divided into 100 sec bins |
 |
 |
| Module-wise count rates for Quadrant D Data is divided into 100 sec bins |
 |
 |
| Parameter | Plot |
|---|---|
| CZT HV Monitor | 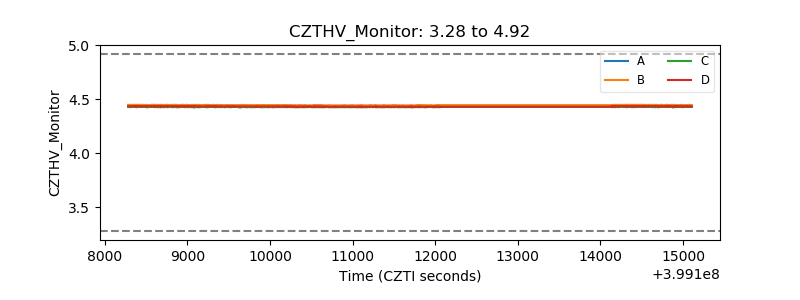 |
| D_VDD | 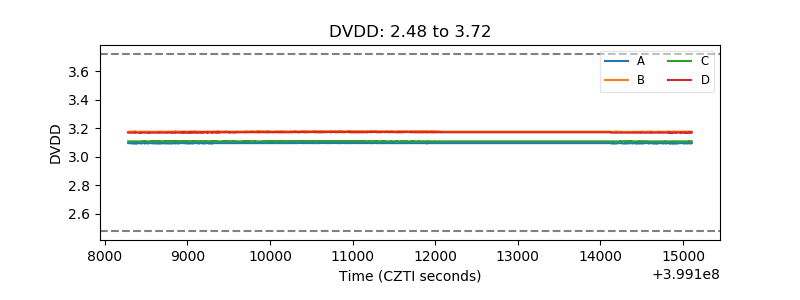 |
| Temperature 1 | 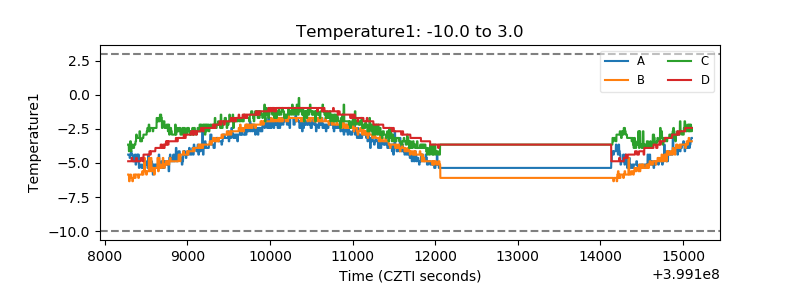 |
| Veto HV Monitor | 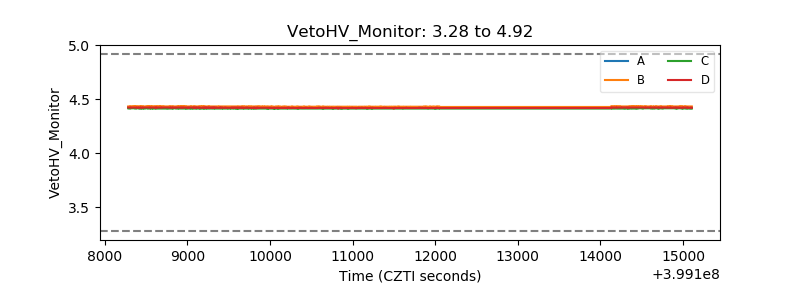 |
| Veto LLD | 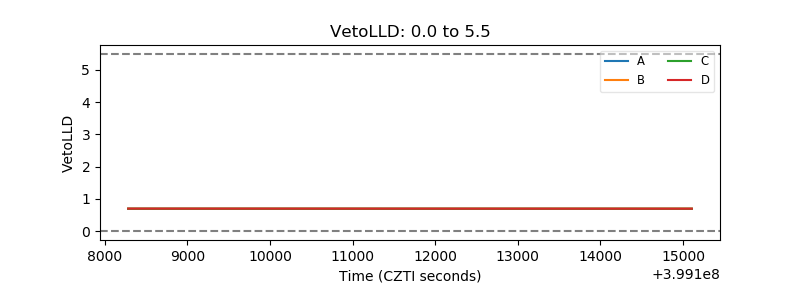 |
| Alpha Counter | 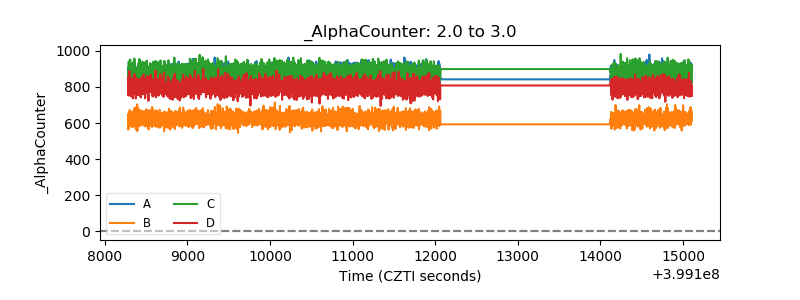 |
| _CPM_Rate | 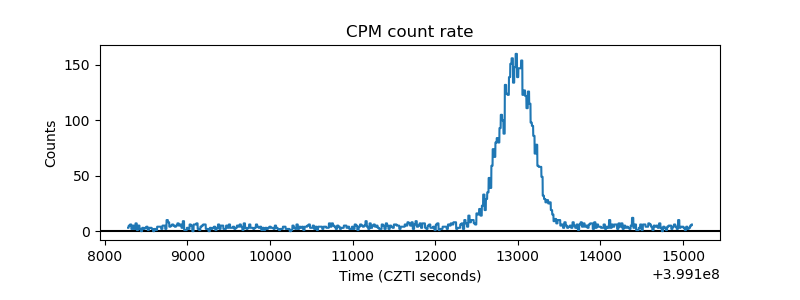 |
| CZT Counter | 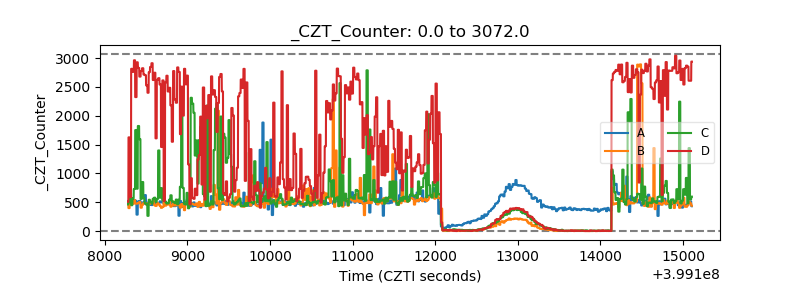 |
| +2.5 Volts monitor | 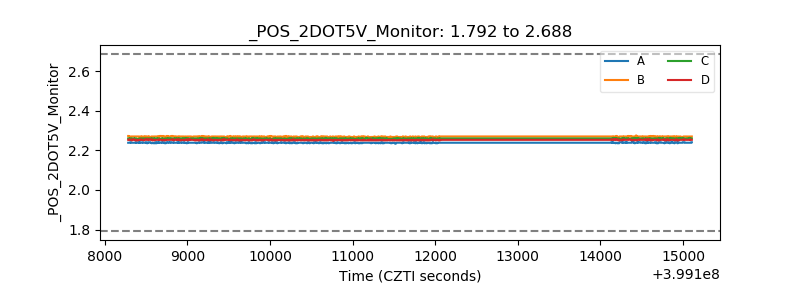 |
| +5 Volts monitor | 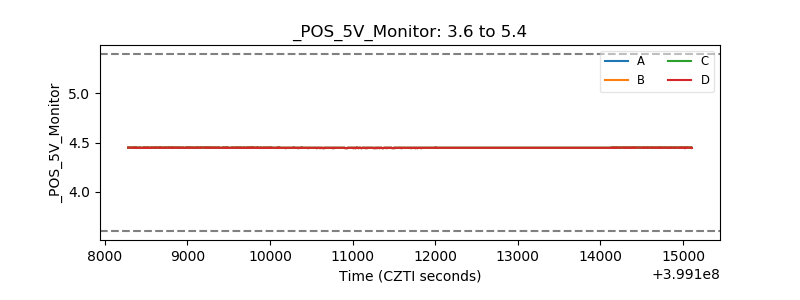 |
| _ROLL_ROT | 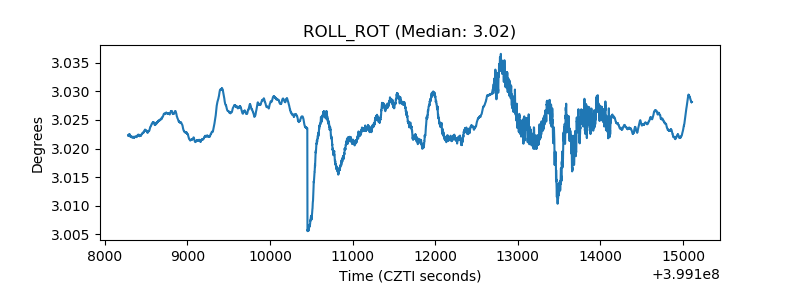 |
| _Roll_DEC |  |
| _Roll_RA | 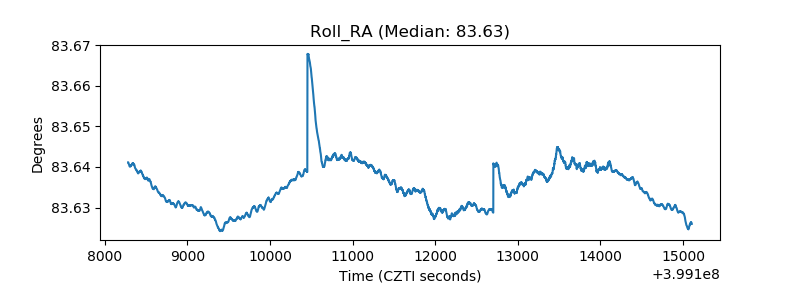 |
| Veto Counter | 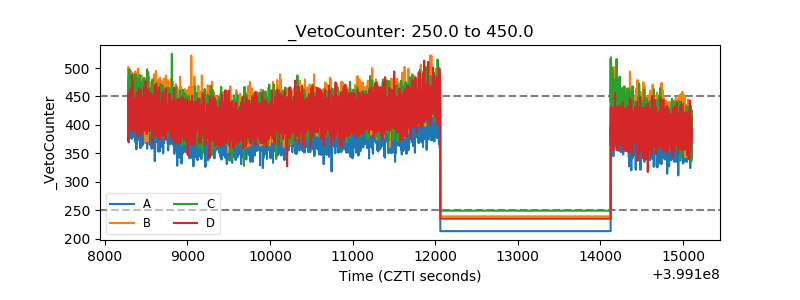 |