| Param | Original file | Final file |
|---|---|---|
| Filename | modeM0/AS1C07_014T01_9000005314_37350cztM0_level2.evt | modeM0/AS1C07_014T01_9000005314_37350cztM0_level2_quad_clean.evt |
| Size (bytes) | 723,980,160 | 62,976,960 |
| Size | 690.4 MB | 60.1 MB |
| Events in quadrant A | 3,143,547 | 420,986 |
| Events in quadrant B | 3,218,382 | 422,198 |
| Events in quadrant C | 4,485,839 | 413,906 |
| Events in quadrant D | 10,703,119 | 260,558 |
| Mode M0 | |||
|---|---|---|---|
| Quadrant | BADHDUFLAG | Total packets | Discarded packets |
| A | 0 | 12571 | 3 |
| B | 0 | 12948 | 2 |
| C | 0 | 16890 | 2 |
| D | 0 | 35498 | 2 |
| Mode M9 | |||
|---|---|---|---|
| Quadrant | BADHDUFLAG | Total packets | Discarded packets |
| A | 0 | 18 | 0 |
| B | 0 | 18 | 0 |
| C | 0 | 18 | 0 |
| D | 0 | 19 | 0 |
| Mode SS | |||
|---|---|---|---|
| Quadrant | BADHDUFLAG | Total packets | Discarded packets |
| A | 0 | 112 | 0 |
| B | 0 | 112 | 0 |
| C | 0 | 112 | 0 |
| D | 0 | 112 | 0 |
| Quadrant | Total seconds | Saturated seconds | Saturation percentage |
|---|---|---|---|
| A | 5555 | 72 | 1.296130% |
| B | 5555 | 147 | 2.646265% |
| C | 5555 | 240 | 4.320432% |
| D | 5555 | 3052 | 54.941494% |
Noise dominated data is calculated using 1-second bins in cleaned event files. If a bin has >2000 counts, and if more than 50% of those come from <1% of pixels, then it is considered to be noise-dominated and hence unusable.
| Quadrant | # 1 sec bins | Bins with >0 counts | Bins with >2000 counts | High rate bins dominated by noise | Noise dominated (total time) | Noise dominated (detector-on time) | Marked lightcurve |
|---|---|---|---|---|---|---|---|
| A | 7348 | 5556 | 61 | 61 | 0.83% | 1.10% | 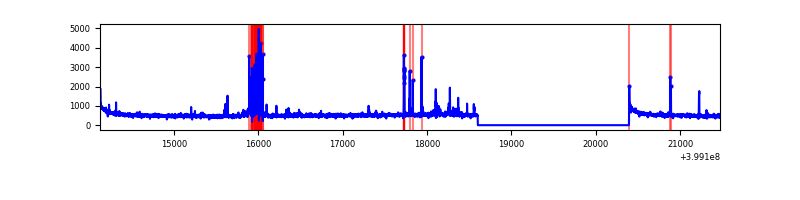 |
| B | 7348 | 5556 | 111 | 111 | 1.51% | 2.00% | 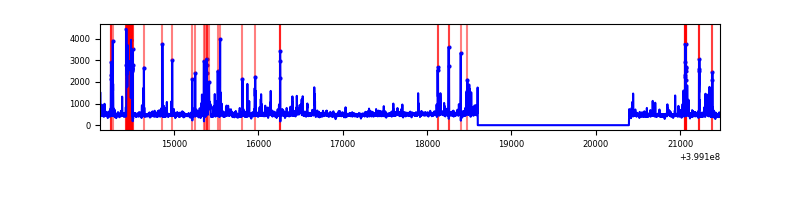 |
| C | 7348 | 5556 | 212 | 212 | 2.89% | 3.82% | 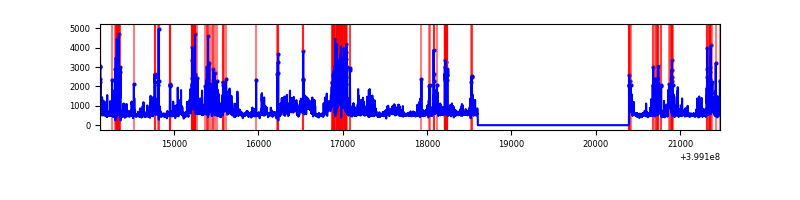 |
| D | 7348 | 5556 | 2866 | 2866 | 39.00% | 51.58% | 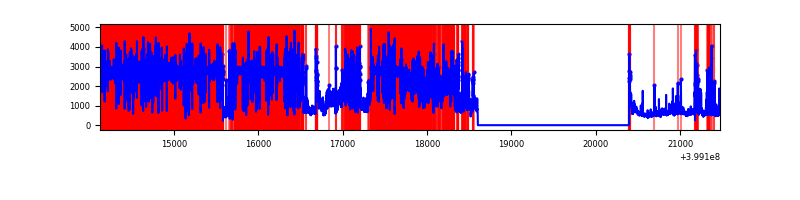 |
Top three noisy pixels from each quadrant. If the there are fewer than three noisy pixels in the level2.evt file, extra rows are filled as -1
| Pixel properties | Quadrant properties | ||||||
|---|---|---|---|---|---|---|---|
| Quadrant | DetID | PixID | Counts | Sigma | Mean | Median | Sigma |
| A | 10 | 83 | 293456 | 2212.92 | 651 | 638 | 132.3 |
| A | 15 | 237 | 277699 | 2093.84 | 651 | 638 | 132.3 |
| A | 13 | 248 | 20613 | 150.96 | 651 | 638 | 132.3 |
| B | 5 | 172 | 390975 | 3162.56 | 642 | 627 | 123.4 |
| B | 0 | 190 | 162374 | 1310.46 | 642 | 627 | 123.4 |
| B | 5 | 255 | 97324 | 783.43 | 642 | 627 | 123.4 |
| C | 14 | 254 | 898968 | 6205.37 | 622 | 628 | 144.8 |
| C | 1 | 23 | 841619 | 5809.22 | 622 | 628 | 144.8 |
| C | 15 | 214 | 233629 | 1609.48 | 622 | 628 | 144.8 |
| D | 12 | 227 | 7359149 | 67065.65 | 435 | 421 | 109.7 |
| D | 12 | 235 | 1209871 | 11022.63 | 435 | 421 | 109.7 |
| D | 2 | 249 | 218860 | 1990.8 | 435 | 421 | 109.7 |
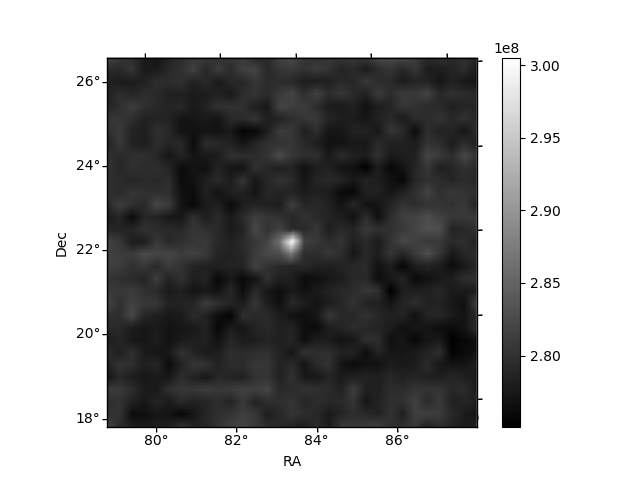
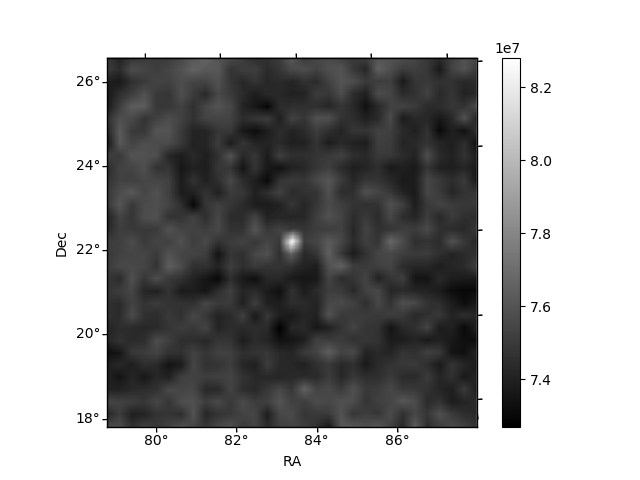
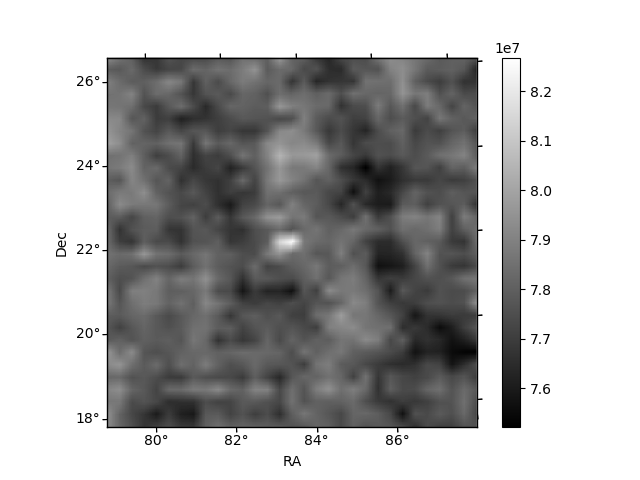
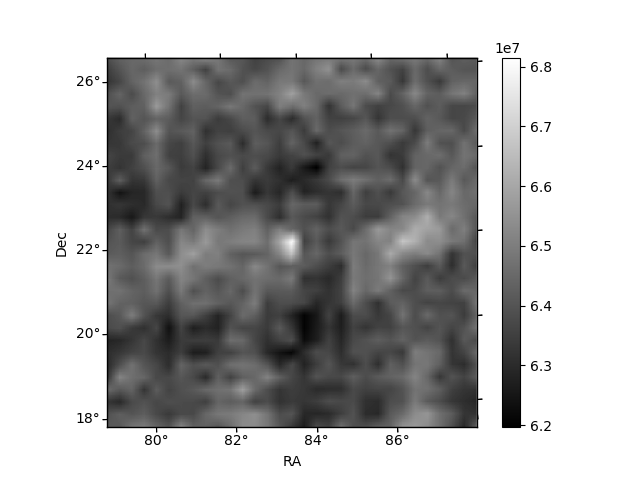
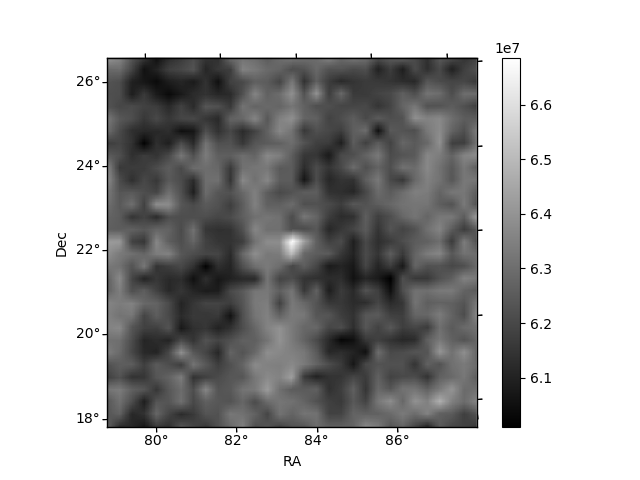
Histogram calculated using DETX and DETY for each event in the final _common_clean file
| Quadrant A | 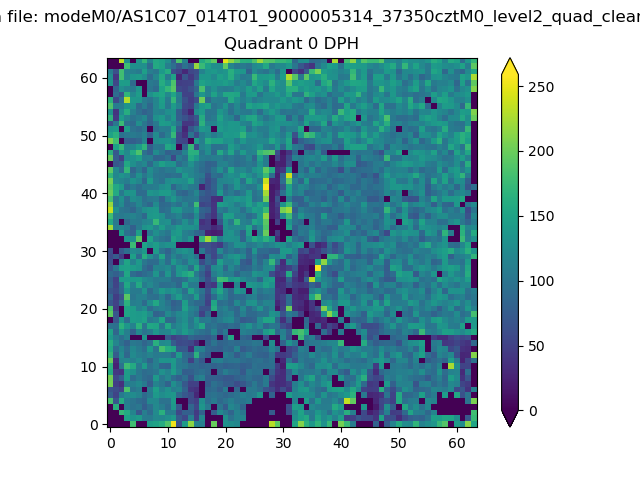 |
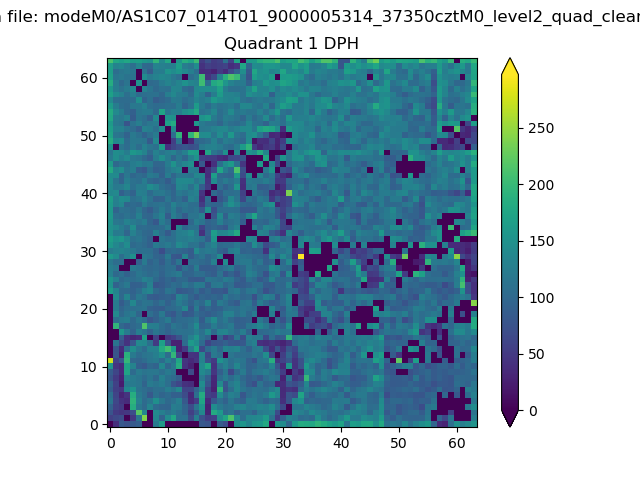 |
Quadrant B |
|---|---|---|---|
| Quadrant D |  |
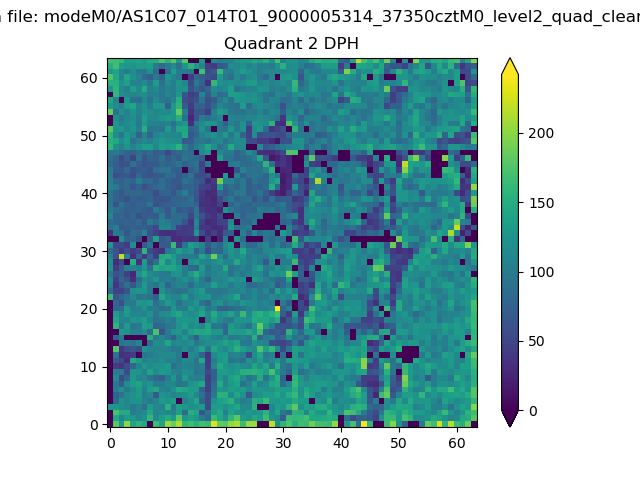 |
Quadrant C |
| Plot type | Count rate plots | Images |
|---|---|---|
| Comparison with Poisson distribution Blue bars denote a histogram of data divided into 1 sec bins. Red curve is a Poisson curve with rate = median count rate of data. |
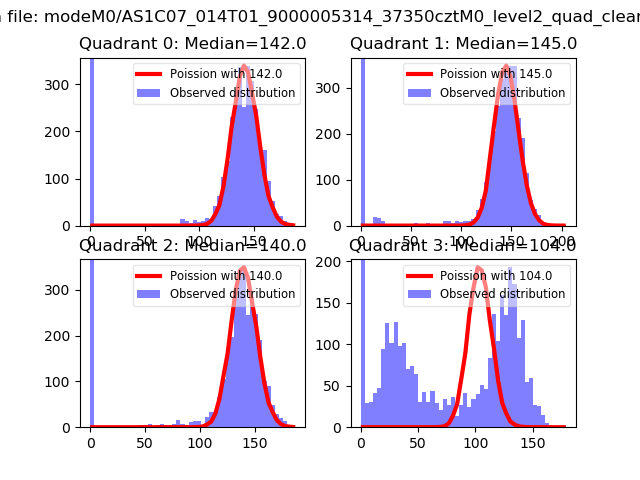 |
 |
| Quadrant-wise count rates Data is divided into 100 sec bins |
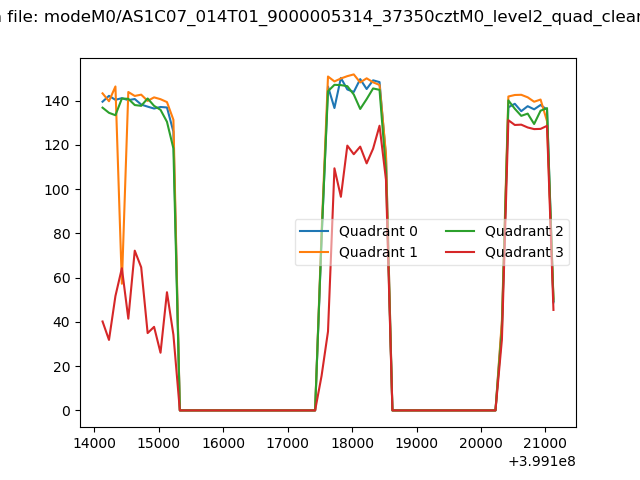 |
|
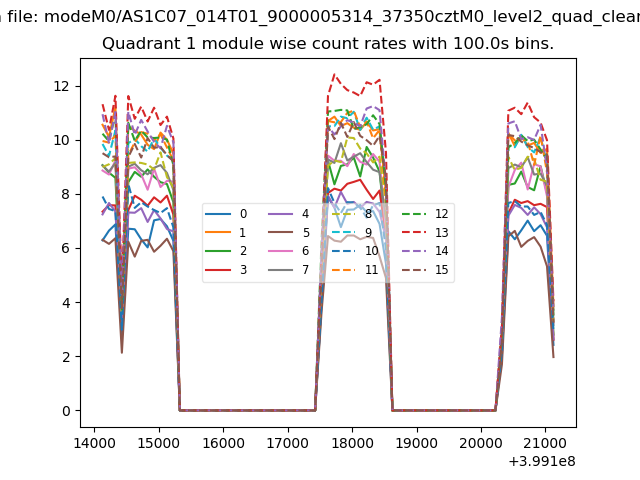
| Module-wise count rates for Quadrant A Data is divided into 100 sec bins |
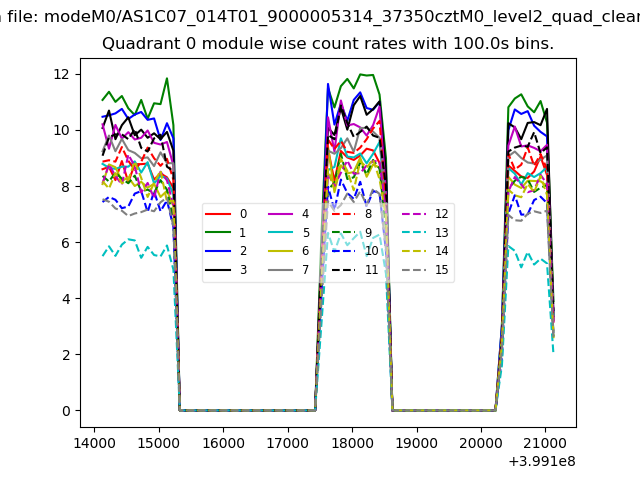 |
 |
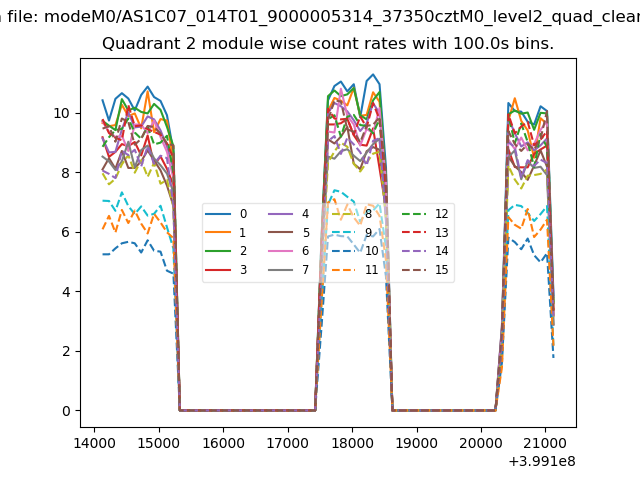
| Module-wise count rates for Quadrant B Data is divided into 100 sec bins |
 |
 |
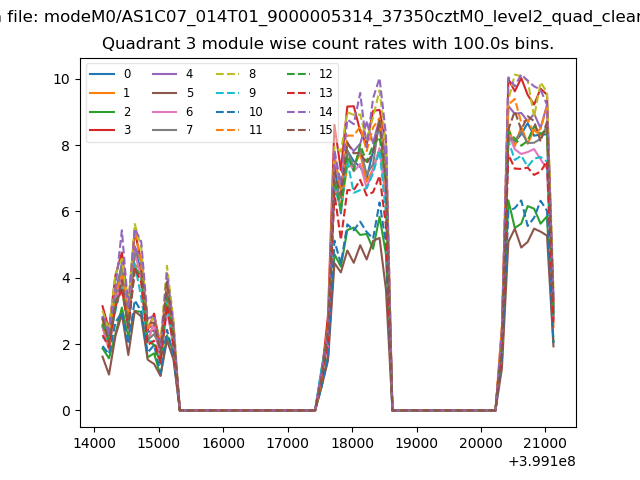
| Module-wise count rates for Quadrant C Data is divided into 100 sec bins |
 |
 |
| Module-wise count rates for Quadrant D Data is divided into 100 sec bins |
 |
 |
| Parameter | Plot |
|---|---|
| CZT HV Monitor | 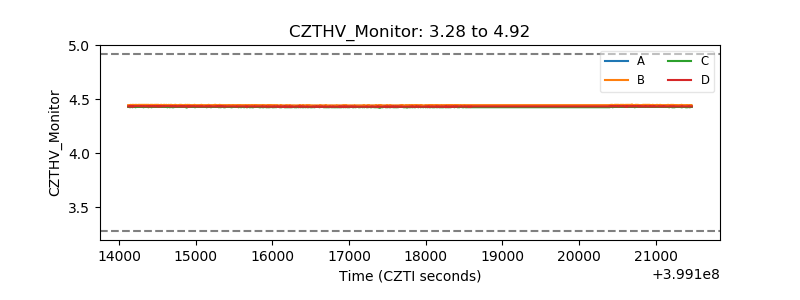 |
| D_VDD | 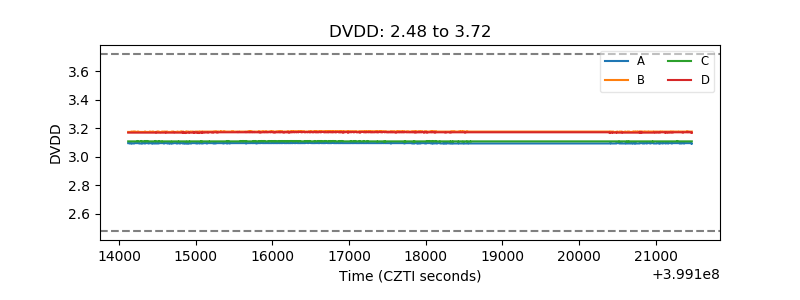 |
| Temperature 1 | 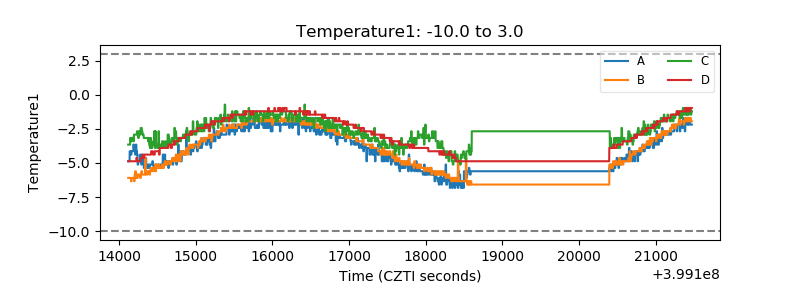 |
| Veto HV Monitor | 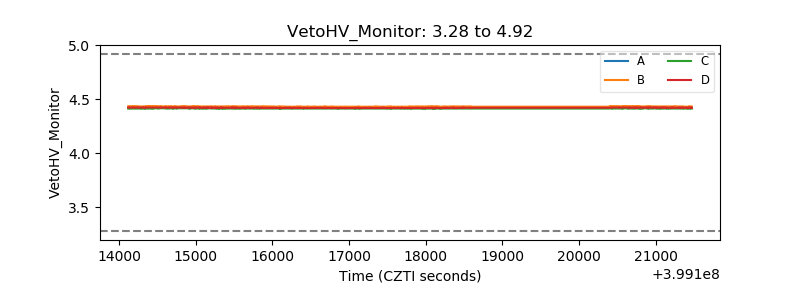 |
| Veto LLD | 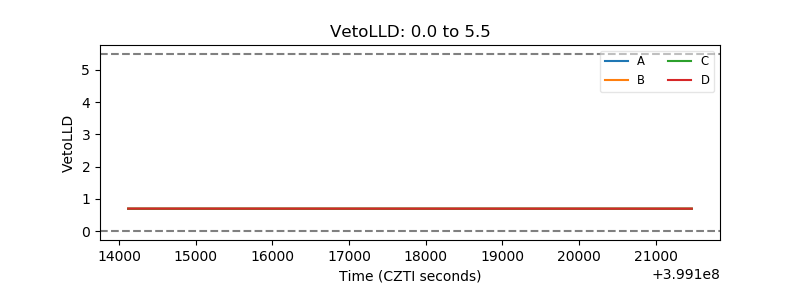 |
| Alpha Counter | 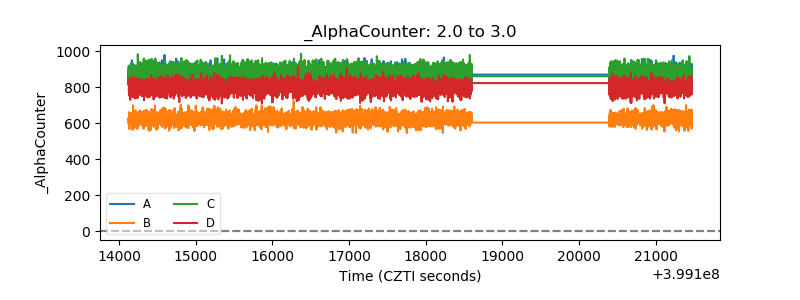 |
| _CPM_Rate | 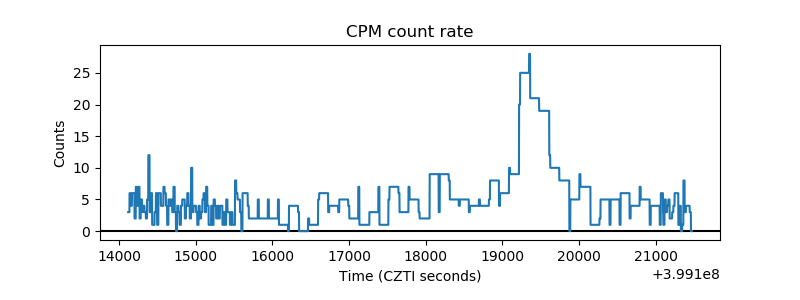 |
| CZT Counter | 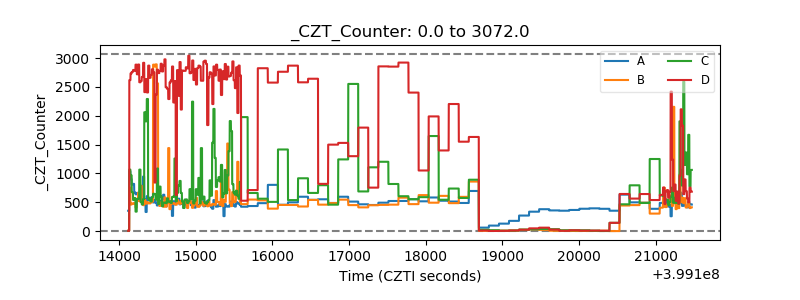 |
| +2.5 Volts monitor | 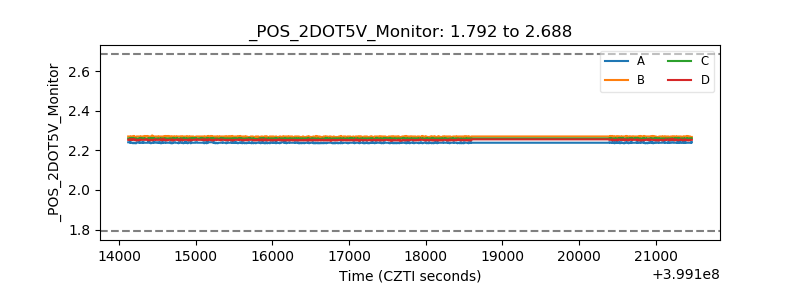 |
| +5 Volts monitor | 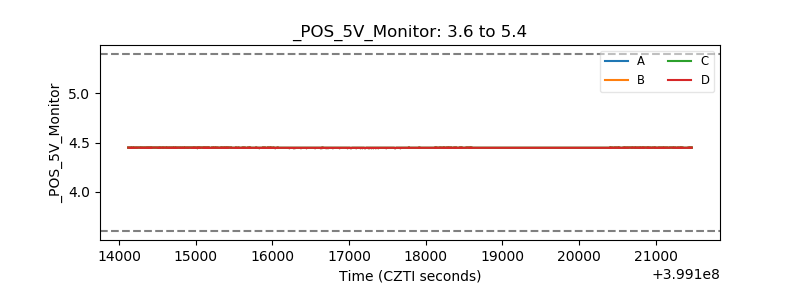 |
| _ROLL_ROT | 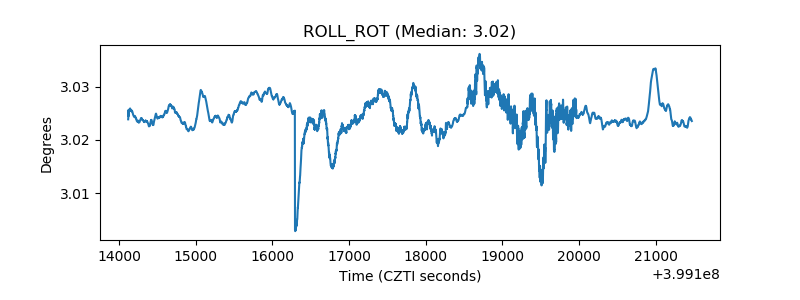 |
| _Roll_DEC | 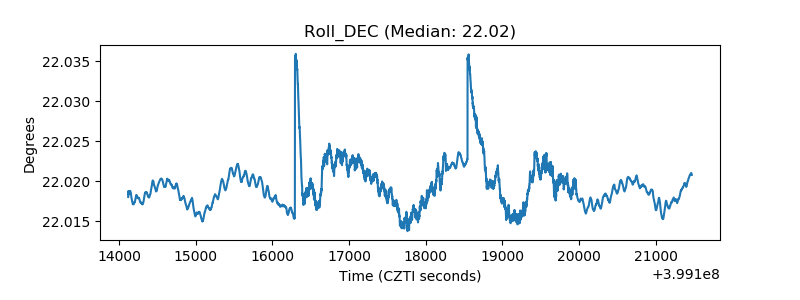 |
| _Roll_RA | 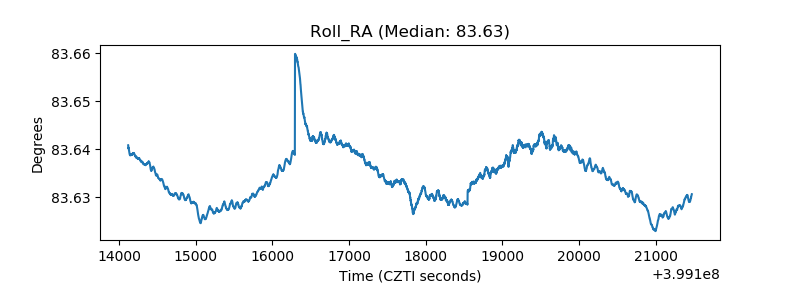 |
| Veto Counter | 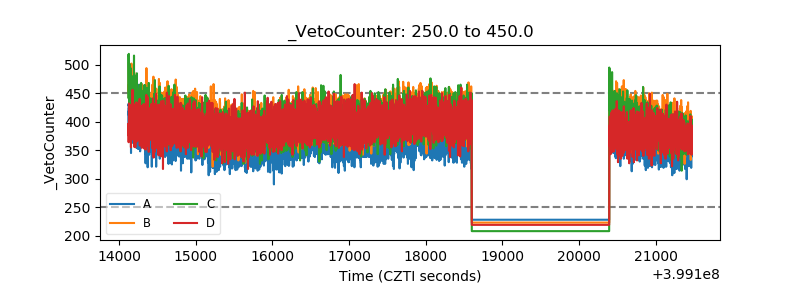 |