| Param | Original file | Final file |
|---|---|---|
| Filename | modeM0/AS1C07_014T01_9000005314_37351cztM0_level2.evt | modeM0/AS1C07_014T01_9000005314_37351cztM0_level2_quad_clean.evt |
| Size (bytes) | 709,384,320 | 63,250,560 |
| Size | 676.5 MB | 60.3 MB |
| Events in quadrant A | 3,469,971 | 406,652 |
| Events in quadrant B | 3,060,404 | 412,135 |
| Events in quadrant C | 4,994,311 | 384,004 |
| Events in quadrant D | 9,577,598 | 316,607 |
| Mode M0 | |||
|---|---|---|---|
| Quadrant | BADHDUFLAG | Total packets | Discarded packets |
| A | 0 | 13700 | 3 |
| B | 0 | 12581 | 2 |
| C | 0 | 18457 | 2 |
| D | 0 | 32337 | 2 |
| Mode M9 | |||
|---|---|---|---|
| Quadrant | BADHDUFLAG | Total packets | Discarded packets |
| A | 0 | 15 | 0 |
| B | 0 | 15 | 0 |
| C | 0 | 15 | 0 |
| D | 0 | 16 | 0 |
| Mode SS | |||
|---|---|---|---|
| Quadrant | BADHDUFLAG | Total packets | Discarded packets |
| A | 0 | 114 | 0 |
| B | 0 | 114 | 0 |
| C | 0 | 114 | 0 |
| D | 0 | 114 | 0 |
| Quadrant | Total seconds | Saturated seconds | Saturation percentage |
|---|---|---|---|
| A | 5652 | 101 | 1.786978% |
| B | 5652 | 84 | 1.486200% |
| C | 5652 | 469 | 8.297948% |
| D | 5652 | 2553 | 45.169851% |
Noise dominated data is calculated using 1-second bins in cleaned event files. If a bin has >2000 counts, and if more than 50% of those come from <1% of pixels, then it is considered to be noise-dominated and hence unusable.
| Quadrant | # 1 sec bins | Bins with >0 counts | Bins with >2000 counts | High rate bins dominated by noise | Noise dominated (total time) | Noise dominated (detector-on time) | Marked lightcurve |
|---|---|---|---|---|---|---|---|
| A | 7115 | 5653 | 81 | 81 | 1.14% | 1.43% | 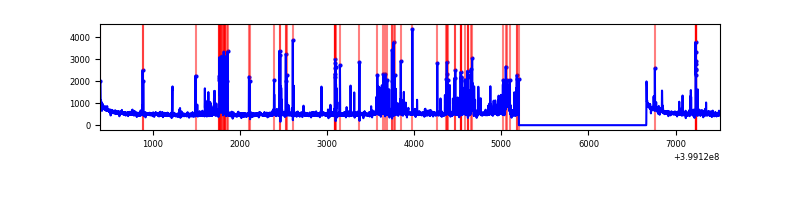 |
| B | 7115 | 5653 | 58 | 58 | 0.82% | 1.03% | 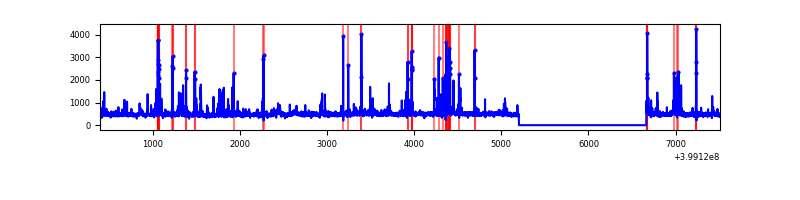 |
| C | 7115 | 5653 | 427 | 427 | 6.00% | 7.55% | 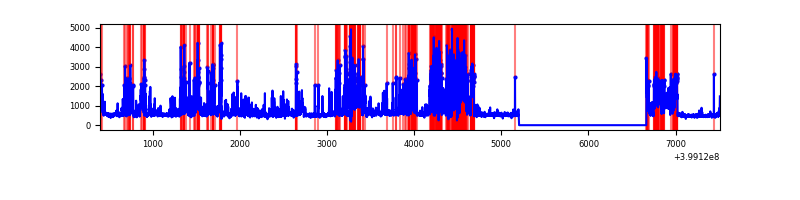 |
| D | 7115 | 5653 | 2457 | 2457 | 34.53% | 43.46% | 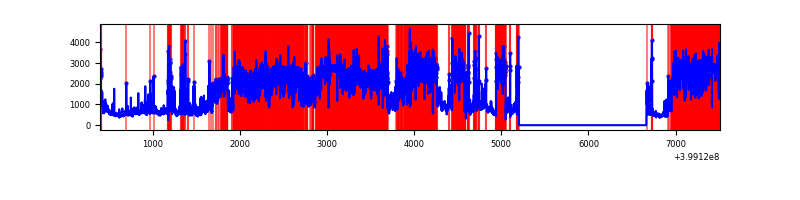 |
Top three noisy pixels from each quadrant. If the there are fewer than three noisy pixels in the level2.evt file, extra rows are filled as -1
| Pixel properties | Quadrant properties | ||||||
|---|---|---|---|---|---|---|---|
| Quadrant | DetID | PixID | Counts | Sigma | Mean | Median | Sigma |
| A | 10 | 83 | 296479 | 2204.07 | 657 | 644 | 134.2 |
| A | 13 | 248 | 271324 | 2016.66 | 657 | 644 | 134.2 |
| A | 15 | 237 | 217345 | 1614.5 | 657 | 644 | 134.2 |
| B | 5 | 172 | 193815 | 1524.74 | 654 | 638 | 126.7 |
| B | 5 | 255 | 128395 | 1008.38 | 654 | 638 | 126.7 |
| B | 0 | 190 | 82364 | 645.06 | 654 | 638 | 126.7 |
| C | 1 | 23 | 1644229 | 11163.69 | 626 | 631 | 147.2 |
| C | 14 | 254 | 566506 | 3843.55 | 626 | 631 | 147.2 |
| C | 15 | 214 | 236546 | 1602.39 | 626 | 631 | 147.2 |
| D | 12 | 235 | 3508998 | 26683.97 | 521 | 508 | 131.5 |
| D | 12 | 227 | 3028259 | 23027.69 | 521 | 508 | 131.5 |
| D | 2 | 249 | 497244 | 3777.95 | 521 | 508 | 131.5 |
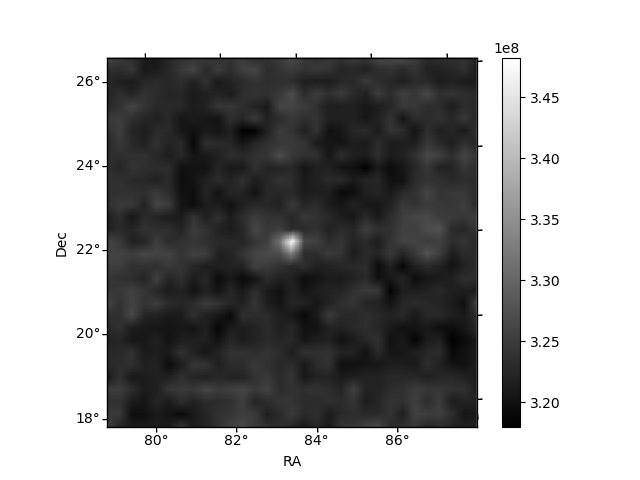
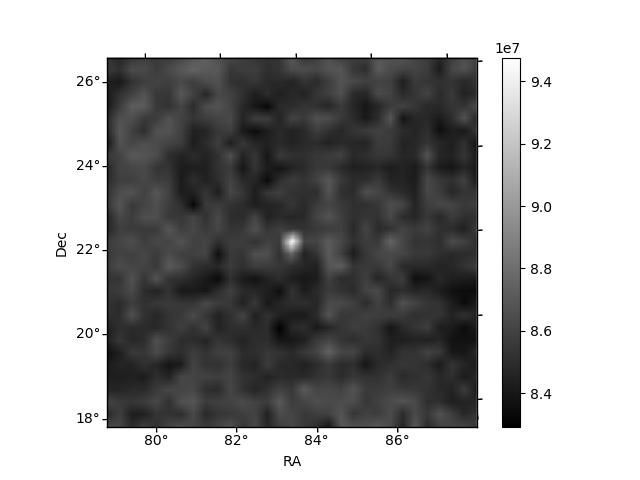
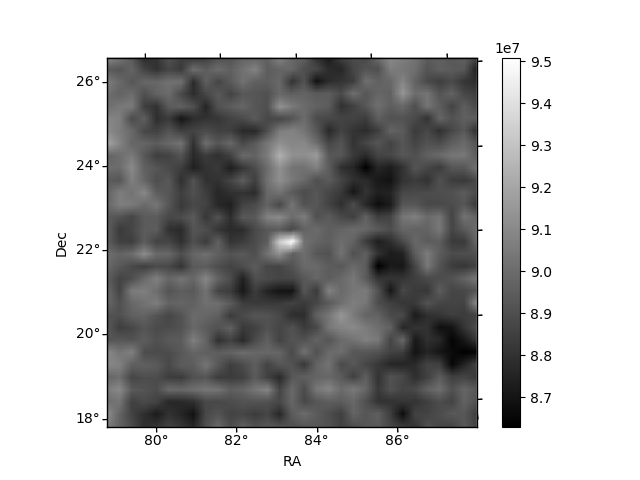
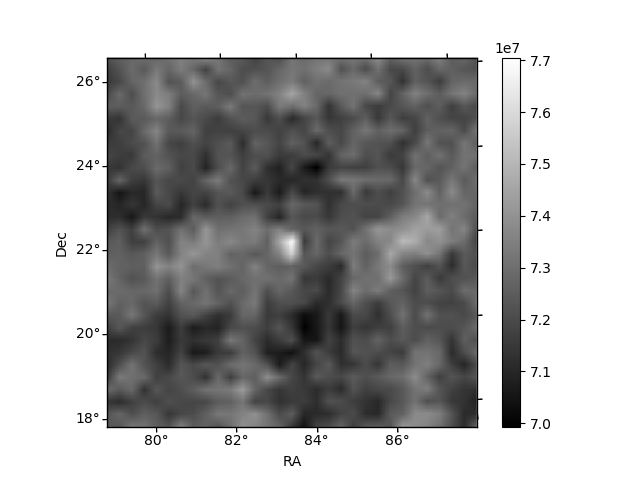
Histogram calculated using DETX and DETY for each event in the final _common_clean file
| Quadrant A | 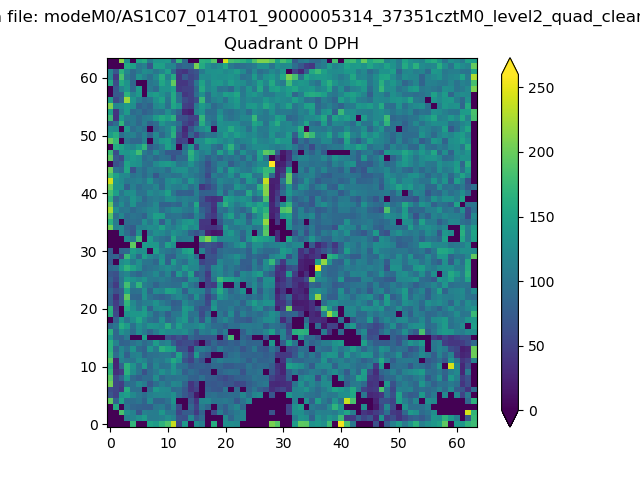 |
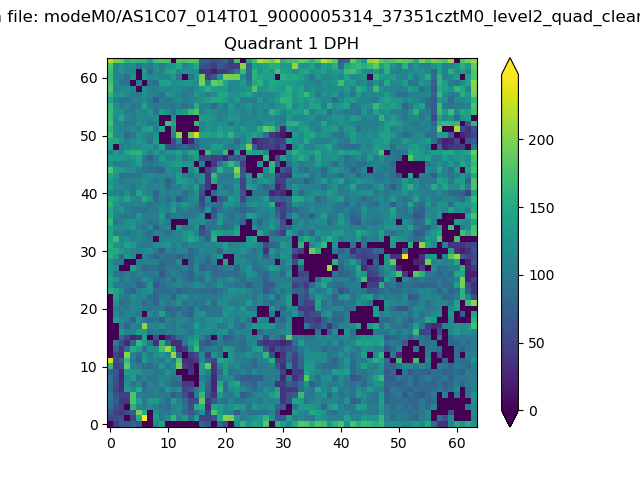 |
Quadrant B |
|---|---|---|---|
| Quadrant D | 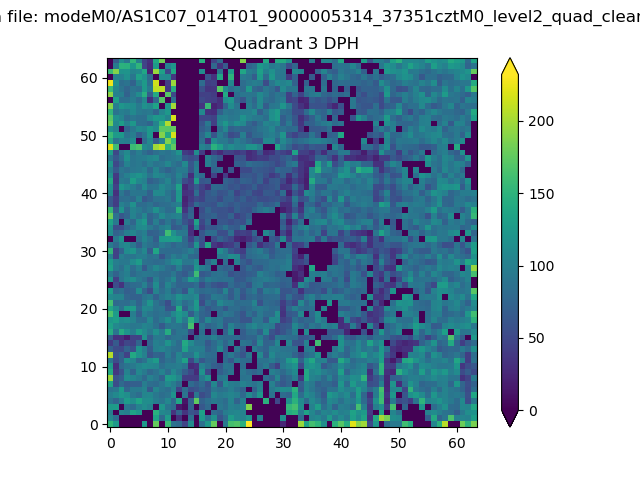 |
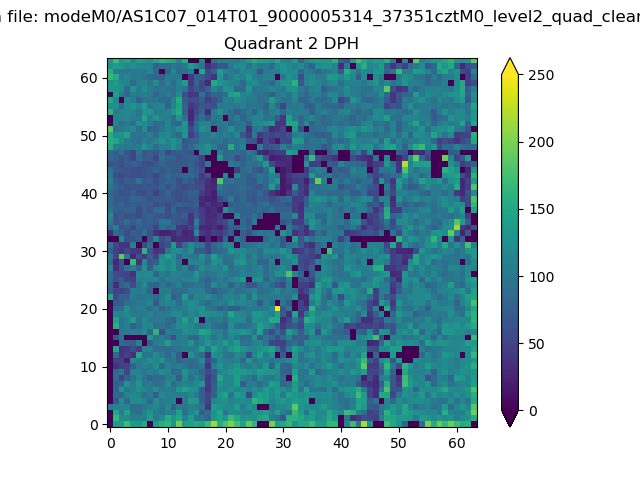 |
Quadrant C |
| Plot type | Count rate plots | Images |
|---|---|---|
| Comparison with Poisson distribution Blue bars denote a histogram of data divided into 1 sec bins. Red curve is a Poisson curve with rate = median count rate of data. |
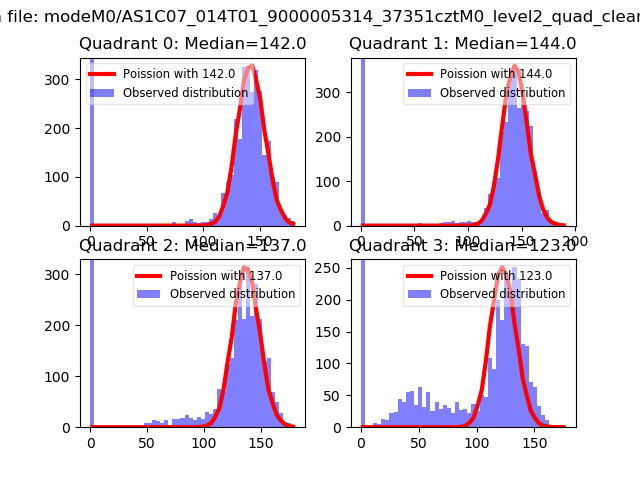 |
 |
| Quadrant-wise count rates Data is divided into 100 sec bins |
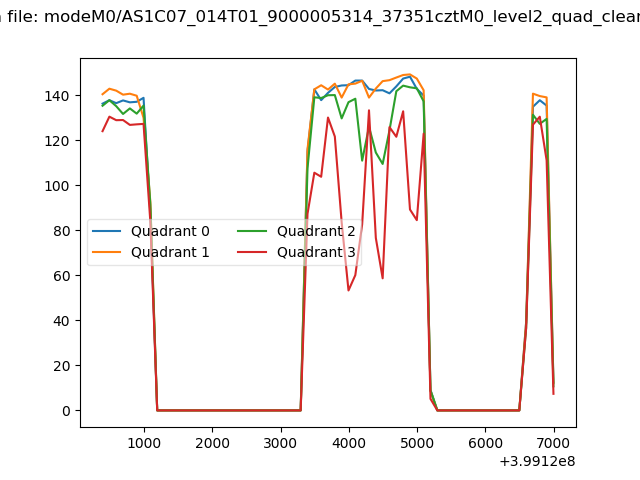 |
|
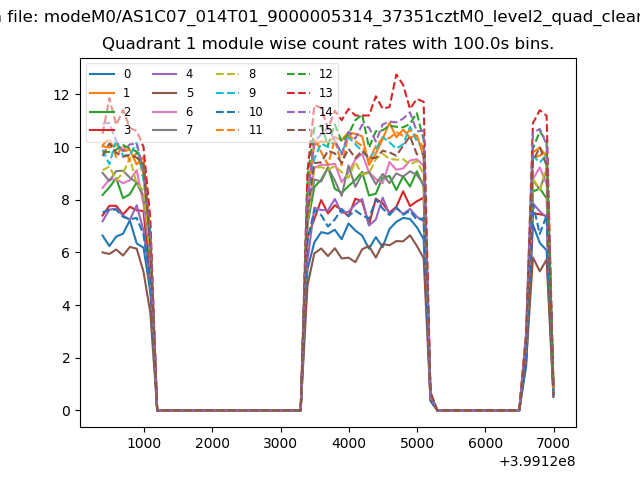
| Module-wise count rates for Quadrant A Data is divided into 100 sec bins |
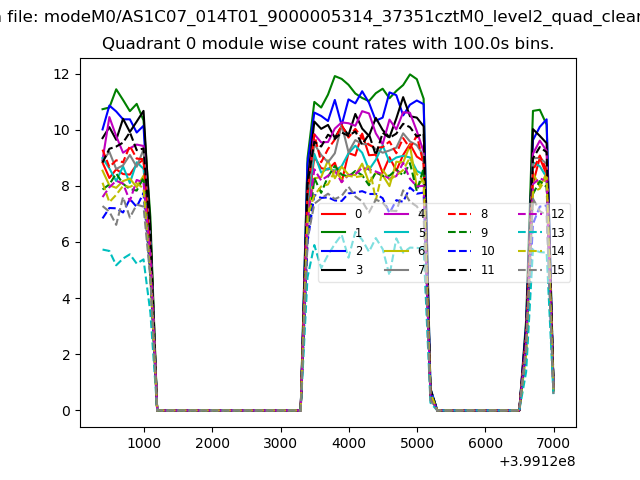 |
 |
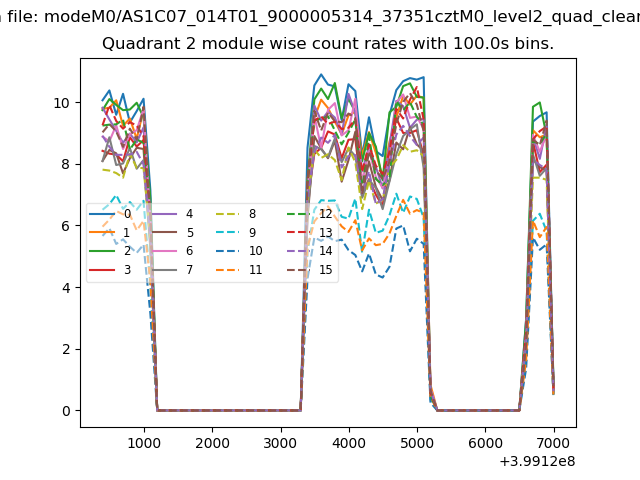
| Module-wise count rates for Quadrant B Data is divided into 100 sec bins |
 |
 |
| Module-wise count rates for Quadrant C Data is divided into 100 sec bins |
 |
 |
| Module-wise count rates for Quadrant D Data is divided into 100 sec bins |
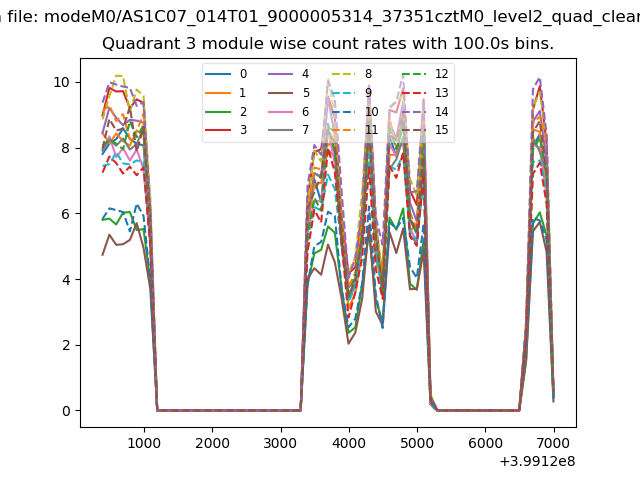 |
 |
| Parameter | Plot |
|---|---|
| CZT HV Monitor | 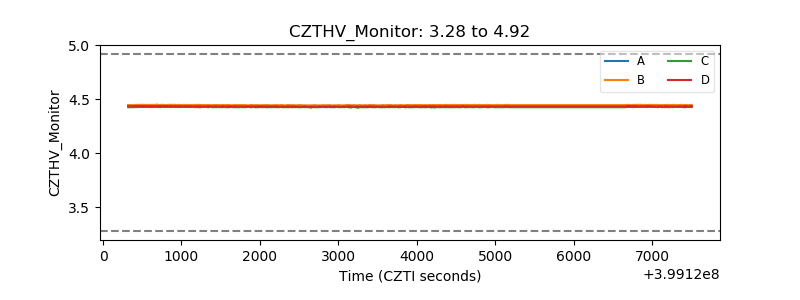 |
| D_VDD | 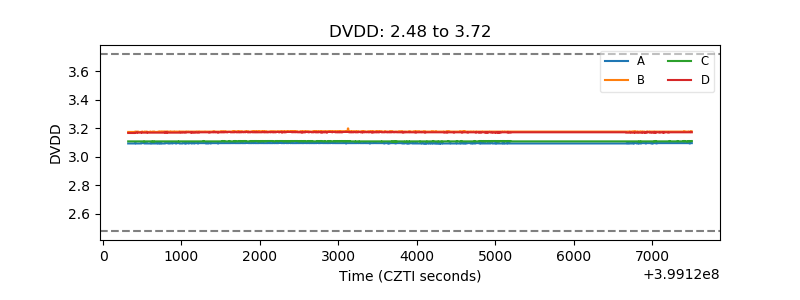 |
| Temperature 1 | 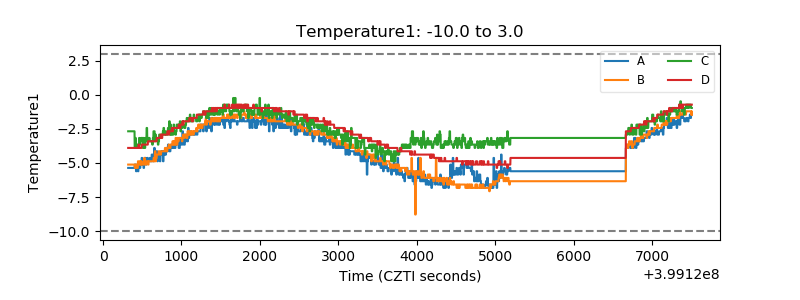 |
| Veto HV Monitor |  |
| Veto LLD | 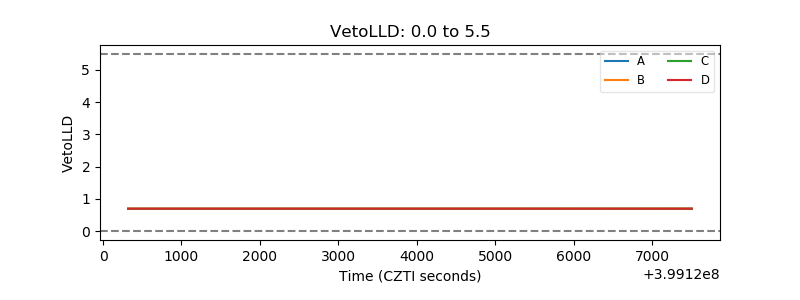 |
| Alpha Counter | 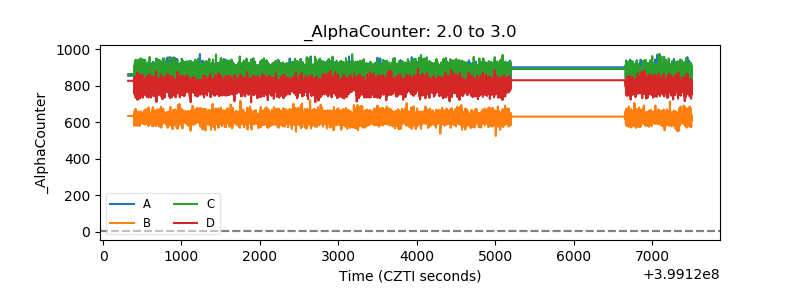 |
| _CPM_Rate | 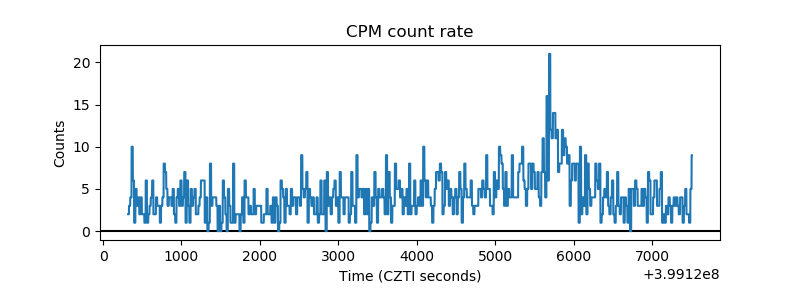 |
| CZT Counter | 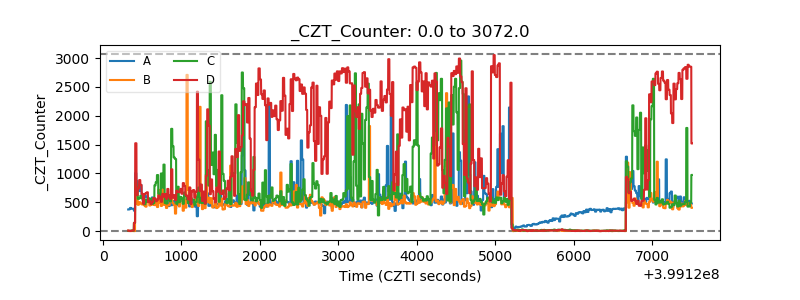 |
| +2.5 Volts monitor | 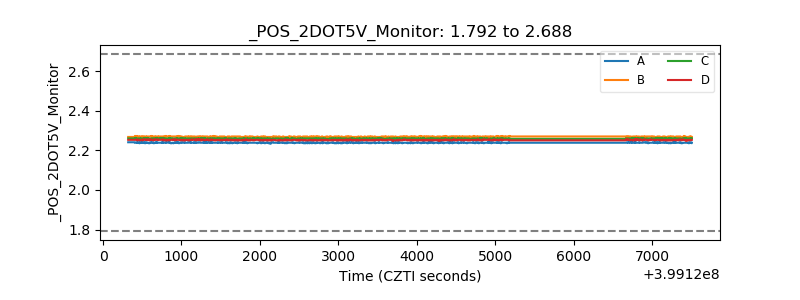 |
| +5 Volts monitor |  |
| _ROLL_ROT | 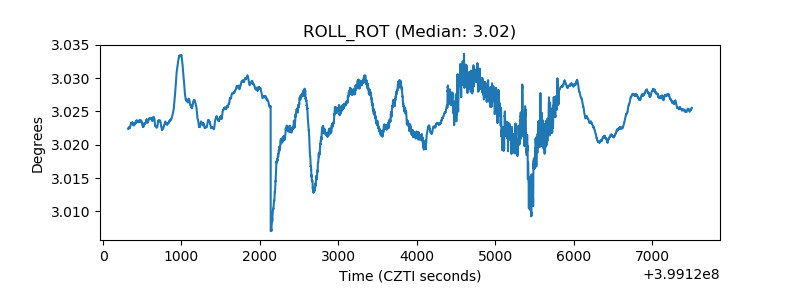 |
| _Roll_DEC | 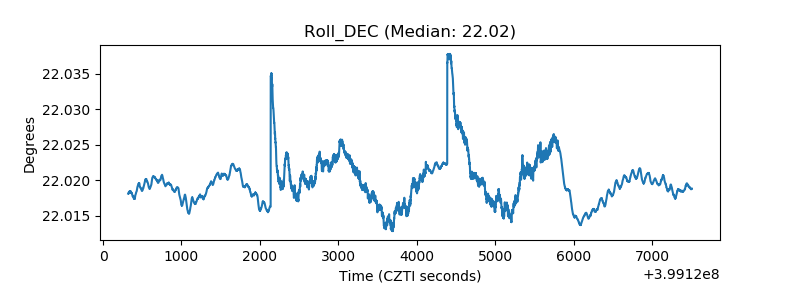 |
| _Roll_RA |  |
| Veto Counter | 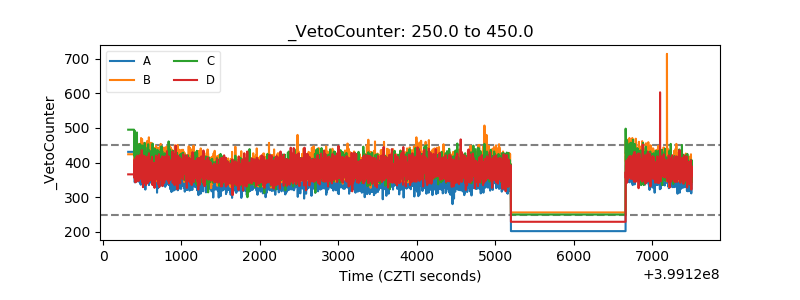 |