| Param | Original file | Final file |
|---|---|---|
| Filename | modeM0/AS1C07_014T01_9000005314_37355cztM0_level2.evt | modeM0/AS1C07_014T01_9000005314_37355cztM0_level2_quad_clean.evt |
| Size (bytes) | 1,085,258,880 | 142,986,240 |
| Size | 1.0 GB | 136.4 MB |
| Events in quadrant A | 5,766,067 | 931,146 |
| Events in quadrant B | 6,412,024 | 926,484 |
| Events in quadrant C | 5,578,283 | 920,592 |
| Events in quadrant D | 14,385,541 | 806,606 |
| Mode M0 | |||
|---|---|---|---|
| Quadrant | BADHDUFLAG | Total packets | Discarded packets |
| A | 0 | 23518 | 4 |
| B | 0 | 25862 | 3 |
| C | 0 | 22719 | 3 |
| D | 0 | 50126 | 3 |
| Mode M9 | |||
|---|---|---|---|
| Quadrant | BADHDUFLAG | Total packets | Discarded packets |
| A | 0 | 38 | 0 |
| B | 0 | 38 | 0 |
| C | 0 | 38 | 0 |
| D | 0 | 39 | 0 |
| Mode SS | |||
|---|---|---|---|
| Quadrant | BADHDUFLAG | Total packets | Discarded packets |
| A | 0 | 220 | 0 |
| B | 0 | 220 | 0 |
| C | 0 | 220 | 0 |
| D | 0 | 220 | 0 |
| Quadrant | Total seconds | Saturated seconds | Saturation percentage |
|---|---|---|---|
| A | 10758 | 55 | 0.511247% |
| B | 10758 | 307 | 2.853690% |
| C | 10758 | 81 | 0.752928% |
| D | 10758 | 2271 | 21.109872% |
Noise dominated data is calculated using 1-second bins in cleaned event files. If a bin has >2000 counts, and if more than 50% of those come from <1% of pixels, then it is considered to be noise-dominated and hence unusable.
| Quadrant | # 1 sec bins | Bins with >0 counts | Bins with >2000 counts | High rate bins dominated by noise | Noise dominated (total time) | Noise dominated (detector-on time) | Marked lightcurve |
|---|---|---|---|---|---|---|---|
| A | 13564 | 10760 | 20 | 20 | 0.15% | 0.19% | 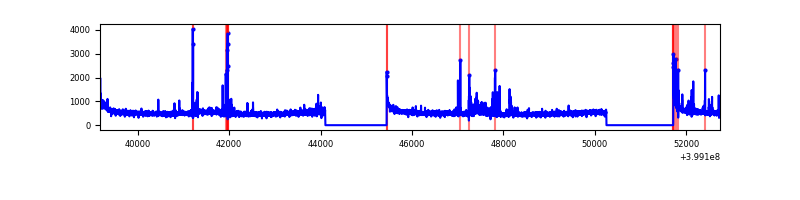 |
| B | 13564 | 10760 | 212 | 212 | 1.56% | 1.97% | 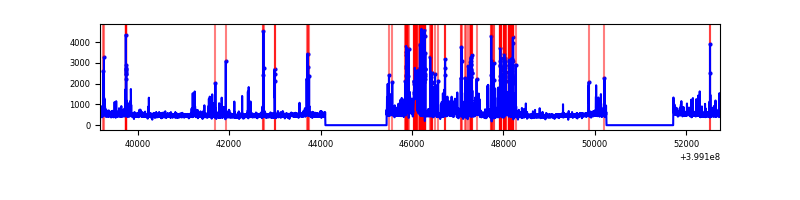 |
| C | 13564 | 10760 | 48 | 48 | 0.35% | 0.45% | 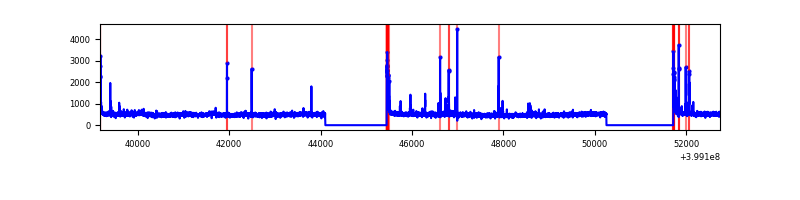 |
| D | 13564 | 10760 | 2251 | 2251 | 16.60% | 20.92% | 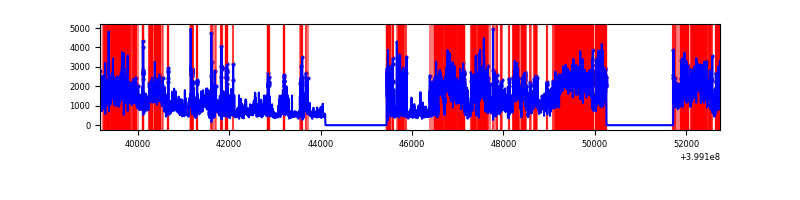 |
Top three noisy pixels from each quadrant. If the there are fewer than three noisy pixels in the level2.evt file, extra rows are filled as -1
| Pixel properties | Quadrant properties | ||||||
|---|---|---|---|---|---|---|---|
| Quadrant | DetID | PixID | Counts | Sigma | Mean | Median | Sigma |
| A | 10 | 83 | 529971 | 2065.83 | 1260 | 1235 | 255.9 |
| A | 15 | 237 | 223251 | 867.44 | 1260 | 1235 | 255.9 |
| A | 9 | 143 | 50830 | 193.77 | 1260 | 1235 | 255.9 |
| B | 5 | 172 | 622819 | 2599.56 | 1242 | 1208 | 239.1 |
| B | 4 | 171 | 305118 | 1270.94 | 1242 | 1208 | 239.1 |
| B | 5 | 255 | 247703 | 1030.83 | 1242 | 1208 | 239.1 |
| C | 15 | 214 | 453510 | 1587.07 | 1224 | 1236 | 285.0 |
| C | 0 | 10 | 149277 | 519.49 | 1224 | 1236 | 285.0 |
| C | 14 | 254 | 121168 | 420.85 | 1224 | 1236 | 285.0 |
| D | 12 | 227 | 6207536 | 21929.52 | 1152 | 1124 | 283.0 |
| D | 12 | 235 | 3070613 | 10845.63 | 1152 | 1124 | 283.0 |
| D | 13 | 249 | 194427 | 683.01 | 1152 | 1124 | 283.0 |
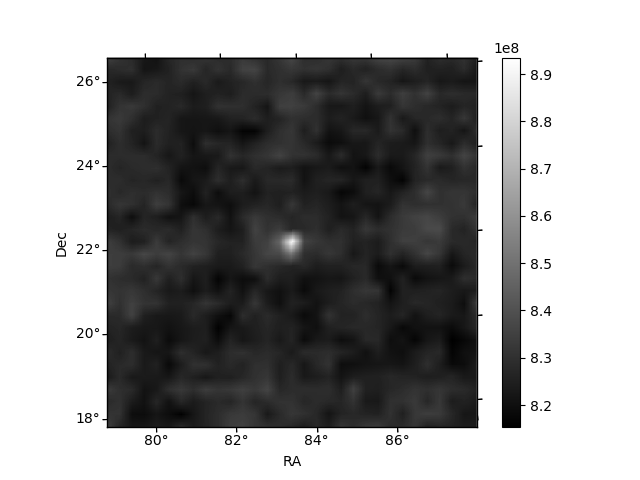
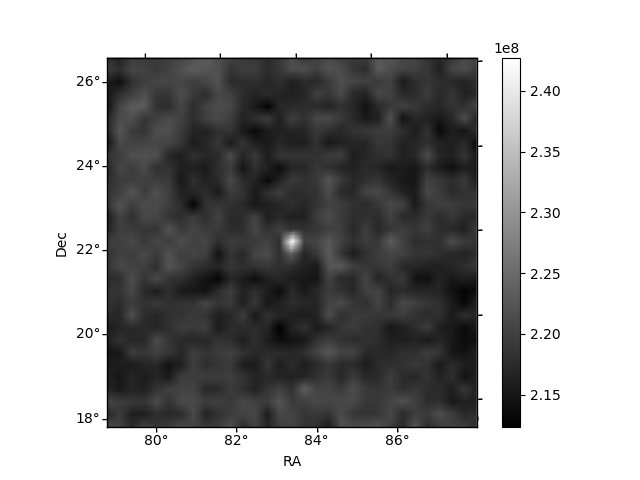
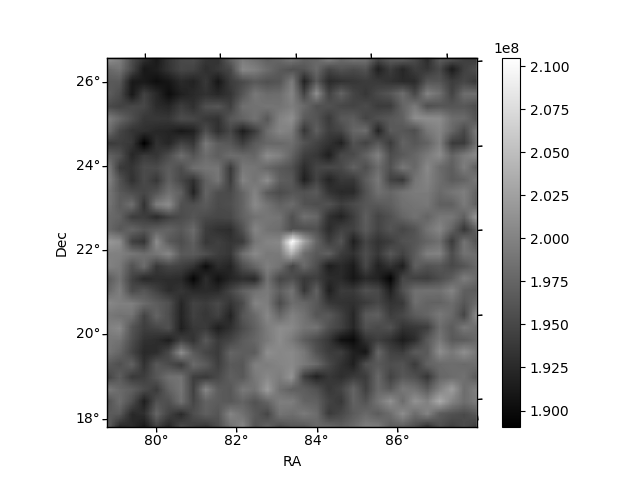
Histogram calculated using DETX and DETY for each event in the final _common_clean file
| Quadrant A | 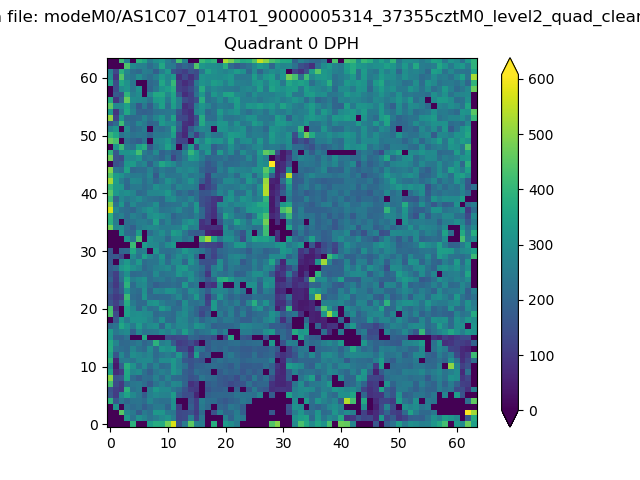 |
 |
Quadrant B |
|---|---|---|---|
| Quadrant D | 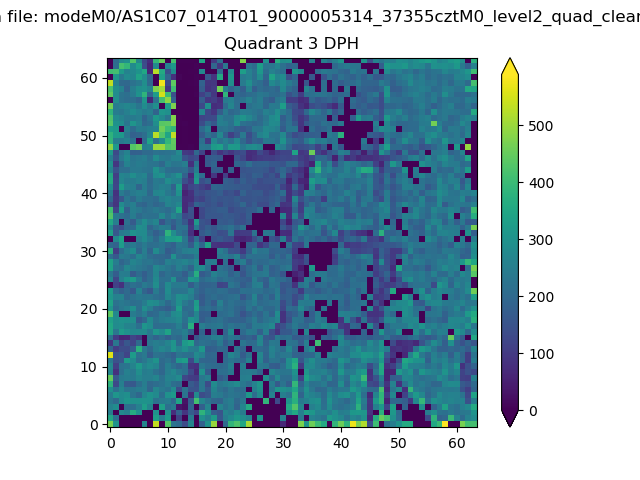 |
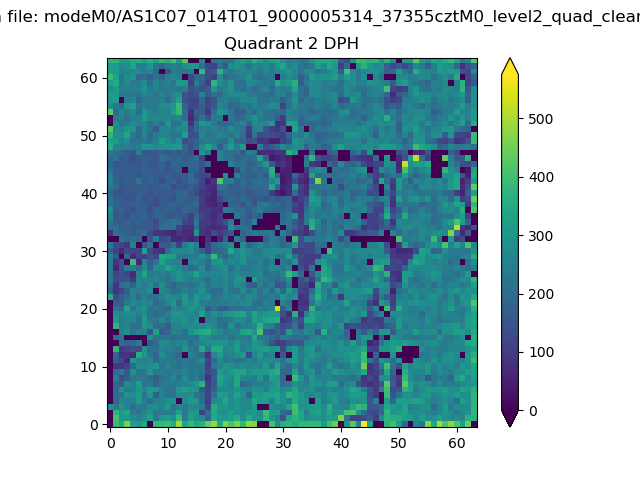 |
Quadrant C |
| Plot type | Count rate plots | Images |
|---|---|---|
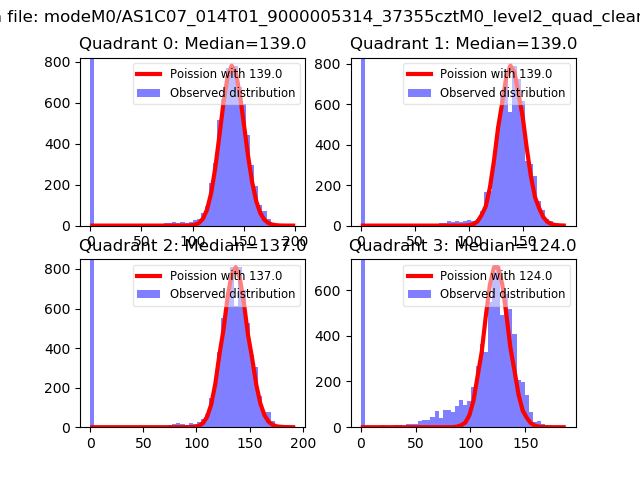
| Comparison with Poisson distribution Blue bars denote a histogram of data divided into 1 sec bins. Red curve is a Poisson curve with rate = median count rate of data. |
 |
 |
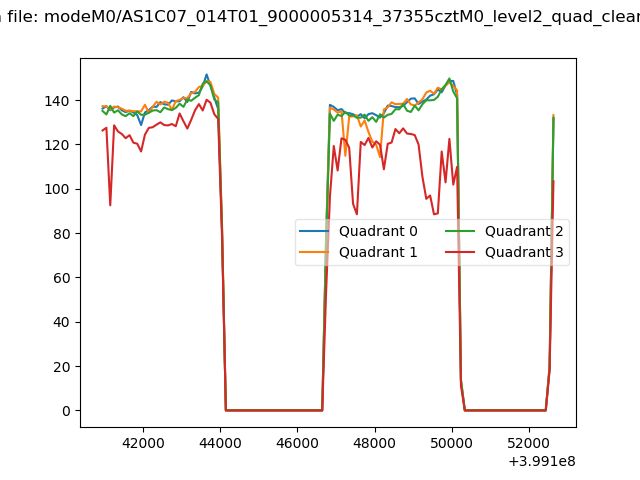
| Quadrant-wise count rates Data is divided into 100 sec bins |
 |
|
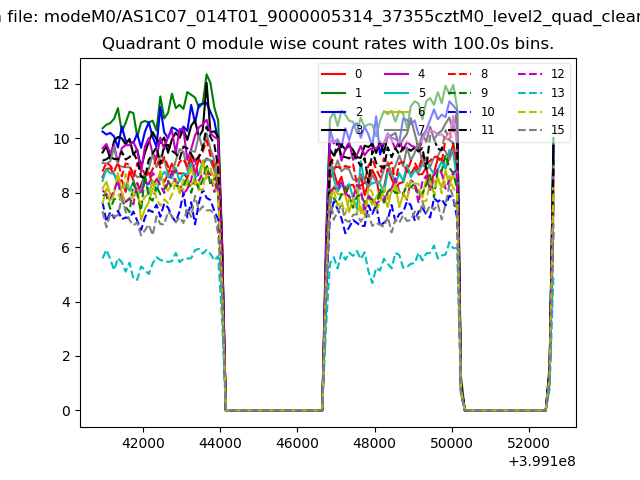
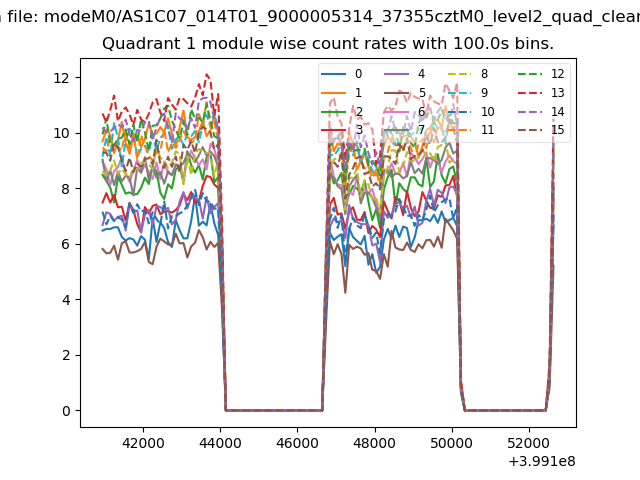
| Module-wise count rates for Quadrant A Data is divided into 100 sec bins |
 |
 |
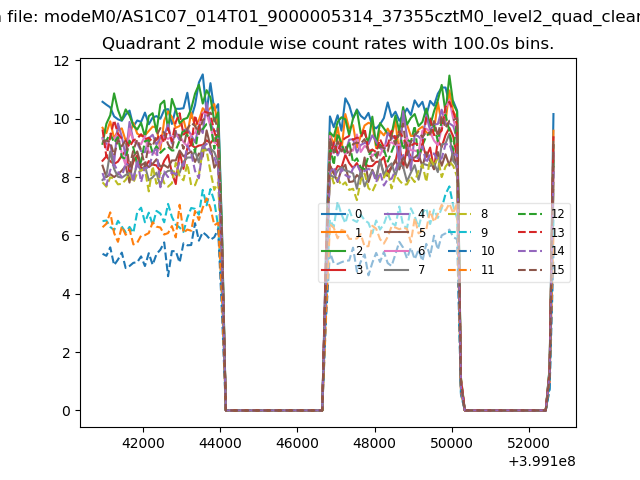
| Module-wise count rates for Quadrant B Data is divided into 100 sec bins |
 |
 |
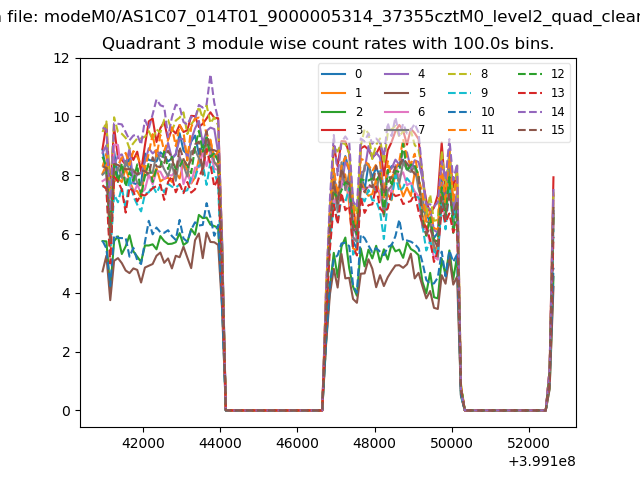
| Module-wise count rates for Quadrant C Data is divided into 100 sec bins |
 |
 |
| Module-wise count rates for Quadrant D Data is divided into 100 sec bins |
 |
 |
| Parameter | Plot |
|---|---|
| CZT HV Monitor | 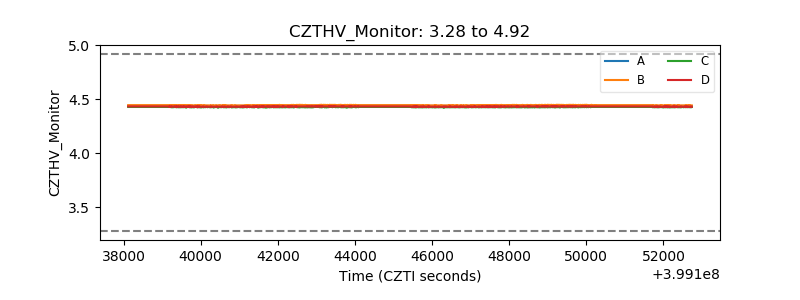 |
| D_VDD | 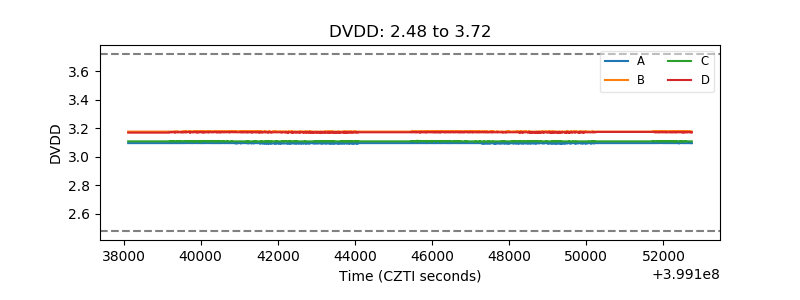 |
| Temperature 1 | 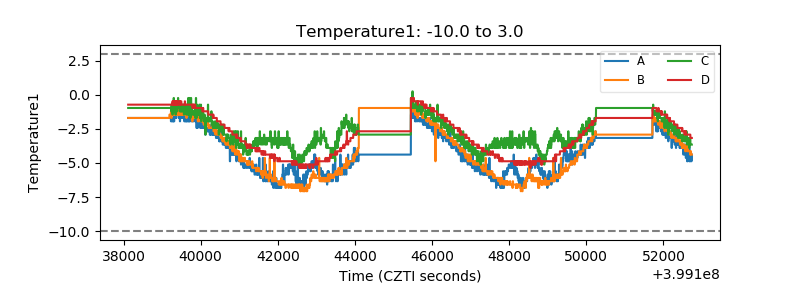 |
| Veto HV Monitor | 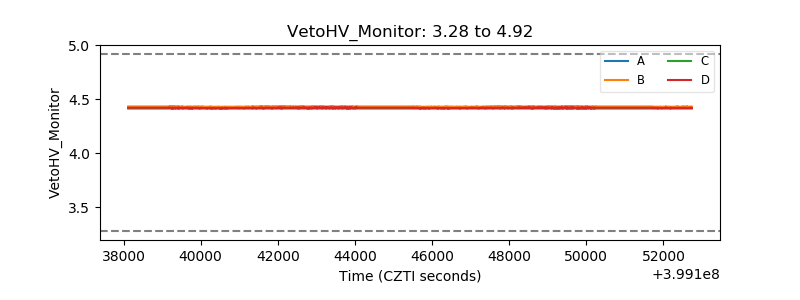 |
| Veto LLD | 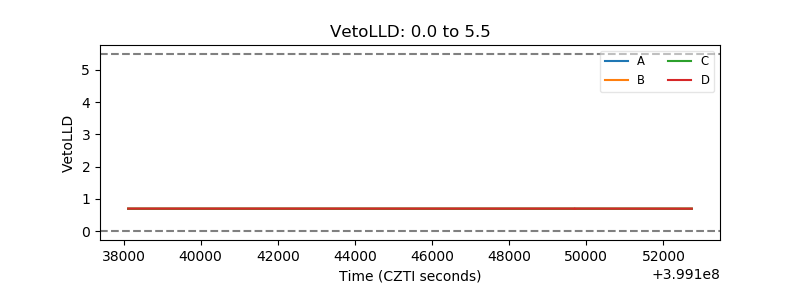 |
| Alpha Counter | 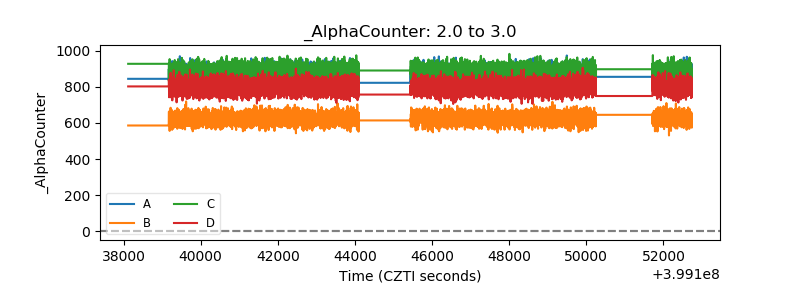 |
| _CPM_Rate | 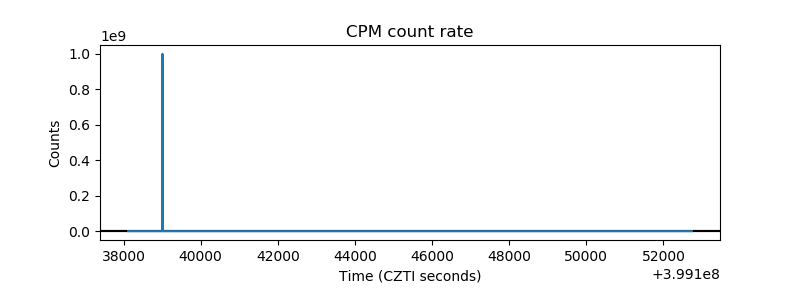 |
| CZT Counter | 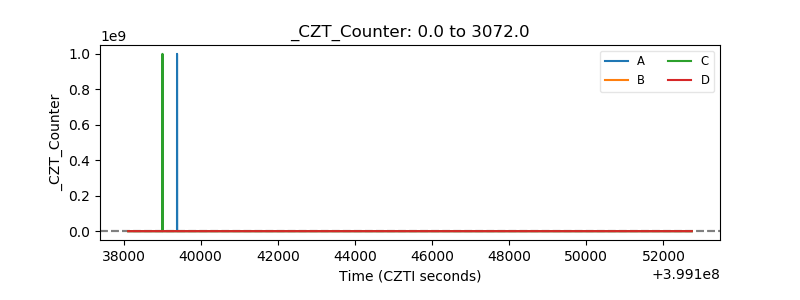 |
| +2.5 Volts monitor | 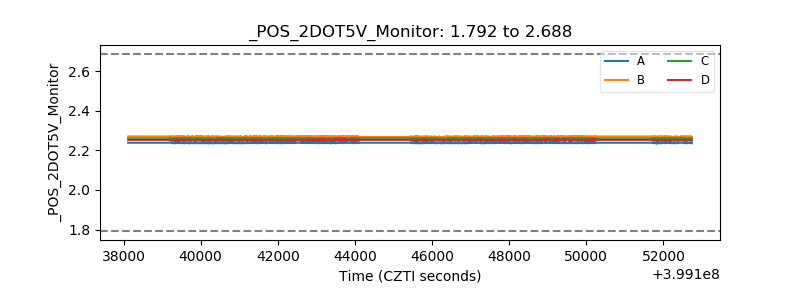 |
| +5 Volts monitor | 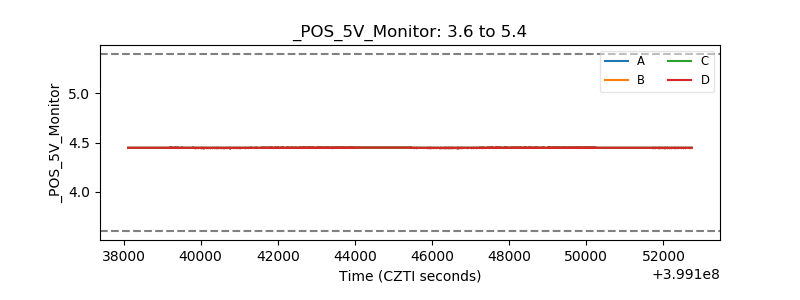 |
| _ROLL_ROT | 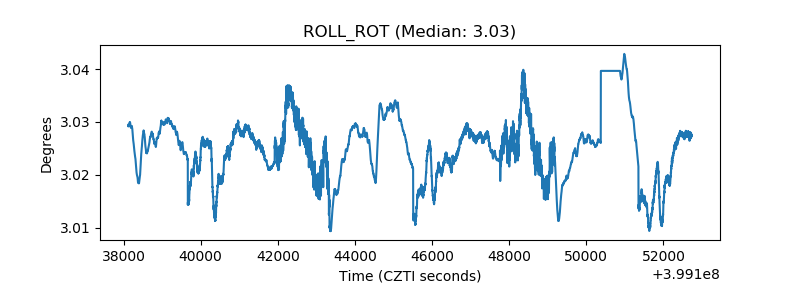 |
| _Roll_DEC | 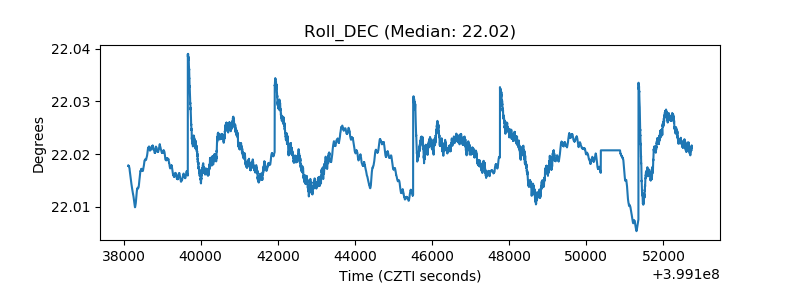 |
| _Roll_RA | 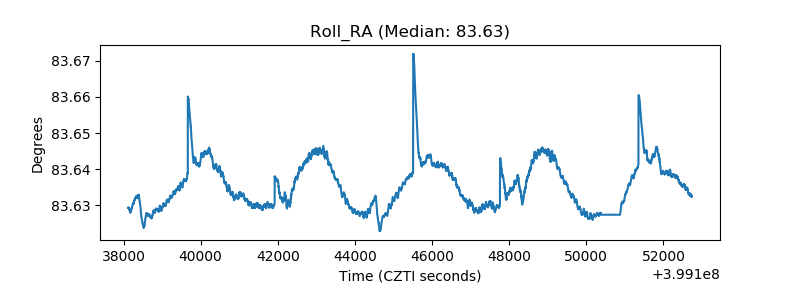 |
| Veto Counter | 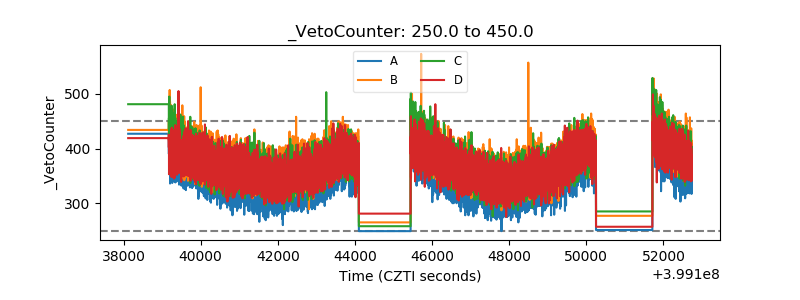 |