| Param | Original file | Final file |
|---|---|---|
| Filename | modeM0/AS1C07_014T01_9000005314_37356cztM0_level2.evt | modeM0/AS1C07_014T01_9000005314_37356cztM0_level2_quad_clean.evt |
| Size (bytes) | 567,852,480 | 85,150,080 |
| Size | 541.5 MB | 81.2 MB |
| Events in quadrant A | 3,123,491 | 563,742 |
| Events in quadrant B | 3,671,998 | 551,864 |
| Events in quadrant C | 3,064,068 | 560,599 |
| Events in quadrant D | 6,954,372 | 505,828 |
| Mode M0 | |||
|---|---|---|---|
| Quadrant | BADHDUFLAG | Total packets | Discarded packets |
| A | 0 | 12811 | 3 |
| B | 0 | 14560 | 2 |
| C | 0 | 12446 | 2 |
| D | 0 | 24575 | 2 |
| Mode M9 | |||
|---|---|---|---|
| Quadrant | BADHDUFLAG | Total packets | Discarded packets |
| A | 0 | 20 | 0 |
| B | 0 | 20 | 0 |
| C | 0 | 20 | 0 |
| D | 0 | 21 | 0 |
| Mode SS | |||
|---|---|---|---|
| Quadrant | BADHDUFLAG | Total packets | Discarded packets |
| A | 0 | 116 | 0 |
| B | 0 | 116 | 0 |
| C | 0 | 116 | 0 |
| D | 0 | 116 | 0 |
| Quadrant | Total seconds | Saturated seconds | Saturation percentage |
|---|---|---|---|
| A | 5665 | 68 | 1.200353% |
| B | 5665 | 300 | 5.295675% |
| C | 5665 | 78 | 1.376876% |
| D | 5665 | 885 | 15.622242% |
Noise dominated data is calculated using 1-second bins in cleaned event files. If a bin has >2000 counts, and if more than 50% of those come from <1% of pixels, then it is considered to be noise-dominated and hence unusable.
| Quadrant | # 1 sec bins | Bins with >0 counts | Bins with >2000 counts | High rate bins dominated by noise | Noise dominated (total time) | Noise dominated (detector-on time) | Marked lightcurve |
|---|---|---|---|---|---|---|---|
| A | 7249 | 5666 | 37 | 37 | 0.51% | 0.65% | 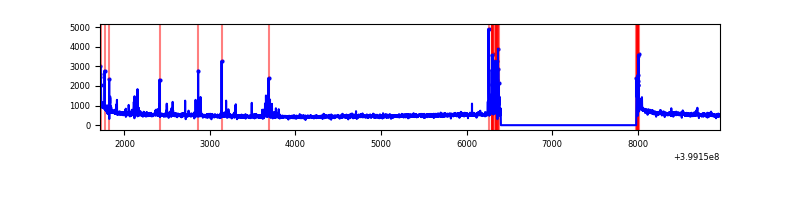 |
| B | 7249 | 5666 | 180 | 180 | 2.48% | 3.18% | 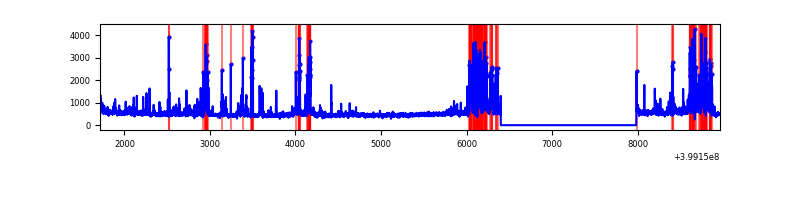 |
| C | 7249 | 5666 | 45 | 45 | 0.62% | 0.79% | 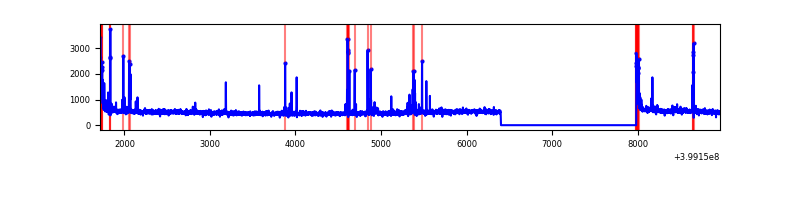 |
| D | 7249 | 5666 | 773 | 773 | 10.66% | 13.64% | 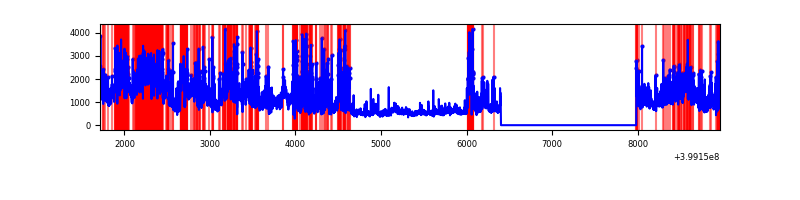 |
Top three noisy pixels from each quadrant. If the there are fewer than three noisy pixels in the level2.evt file, extra rows are filled as -1
| Pixel properties | Quadrant properties | ||||||
|---|---|---|---|---|---|---|---|
| Quadrant | DetID | PixID | Counts | Sigma | Mean | Median | Sigma |
| A | 10 | 83 | 298666 | 2170.95 | 669 | 658 | 137.3 |
| A | 15 | 237 | 116137 | 841.25 | 669 | 658 | 137.3 |
| A | 9 | 143 | 82278 | 594.59 | 669 | 658 | 137.3 |
| B | 5 | 255 | 512245 | 4039.41 | 656 | 641 | 126.7 |
| B | 5 | 172 | 349890 | 2757.53 | 656 | 641 | 126.7 |
| B | 0 | 190 | 67539 | 528.2 | 656 | 641 | 126.7 |
| C | 15 | 214 | 237144 | 1527.21 | 654 | 659 | 154.8 |
| C | 14 | 254 | 152708 | 981.93 | 654 | 659 | 154.8 |
| C | 0 | 10 | 103237 | 662.44 | 654 | 659 | 154.8 |
| D | 12 | 235 | 2317720 | 15226.73 | 620 | 603 | 152.2 |
| D | 12 | 227 | 1114788 | 7321.77 | 620 | 603 | 152.2 |
| D | 2 | 249 | 607203 | 3986.22 | 620 | 603 | 152.2 |
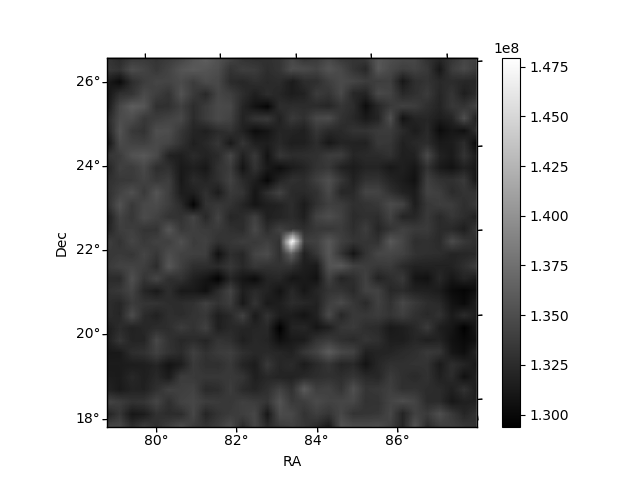
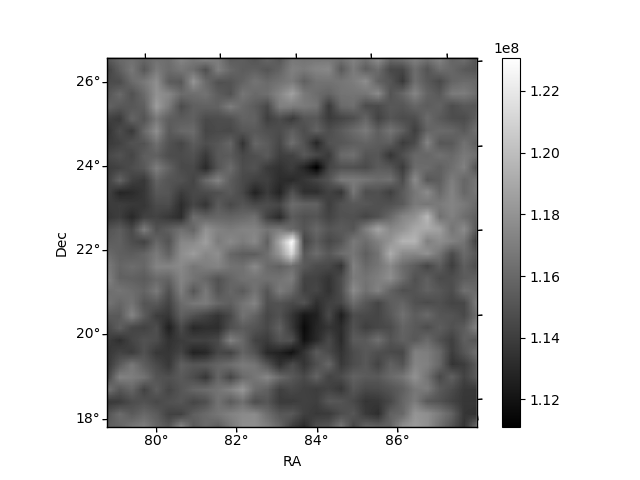
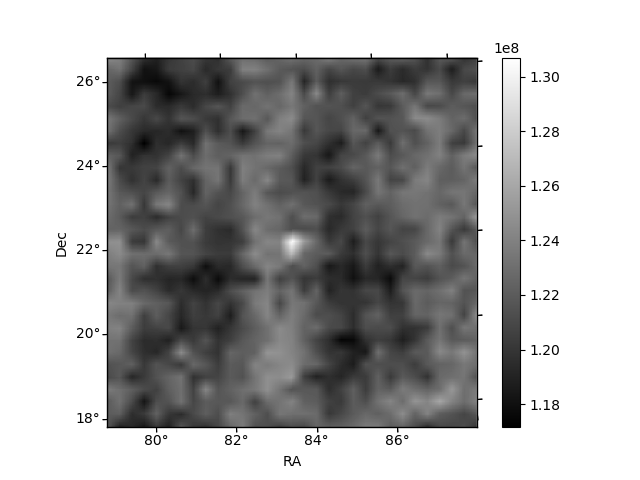
Histogram calculated using DETX and DETY for each event in the final _common_clean file
| Quadrant A | 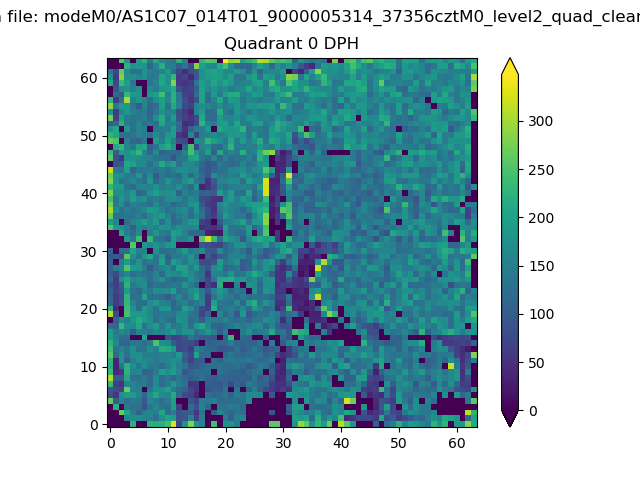 |
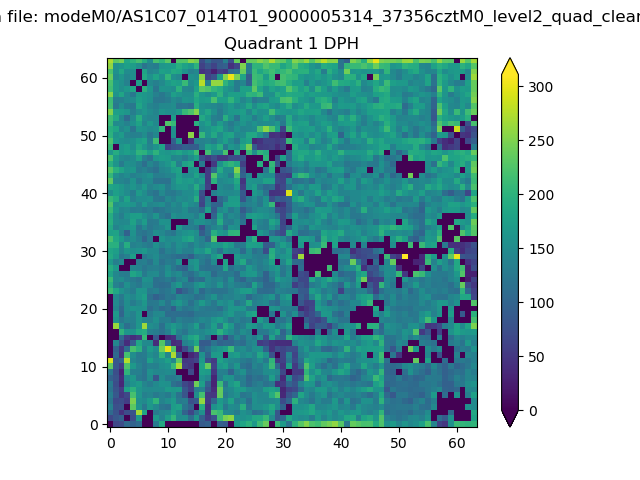 |
Quadrant B |
|---|---|---|---|
| Quadrant D | 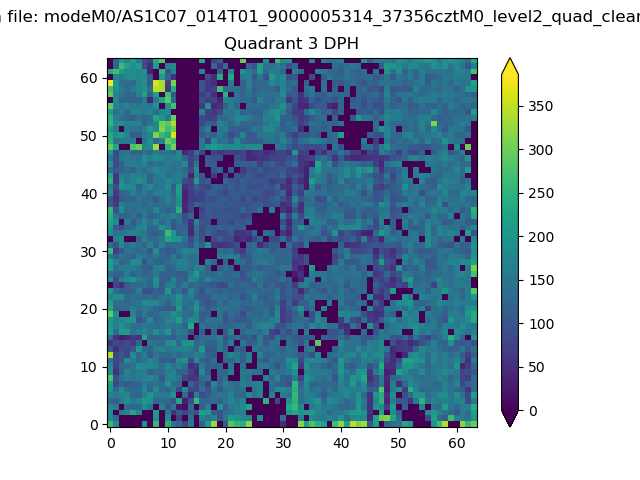 |
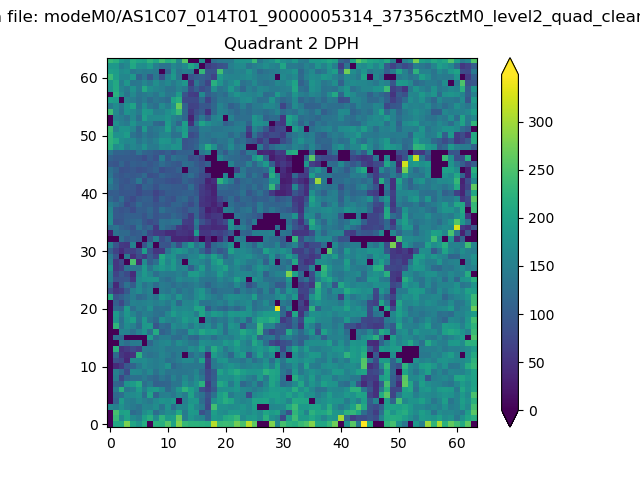 |
Quadrant C |
| Plot type | Count rate plots | Images |
|---|---|---|
| Comparison with Poisson distribution Blue bars denote a histogram of data divided into 1 sec bins. Red curve is a Poisson curve with rate = median count rate of data. |
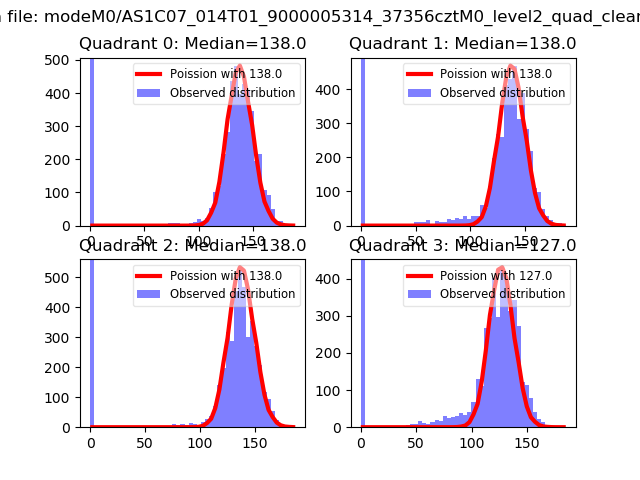 |
 |
| Quadrant-wise count rates Data is divided into 100 sec bins |
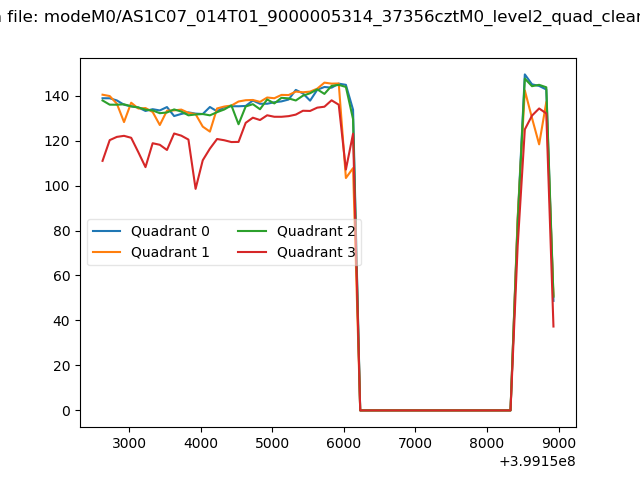 |
|
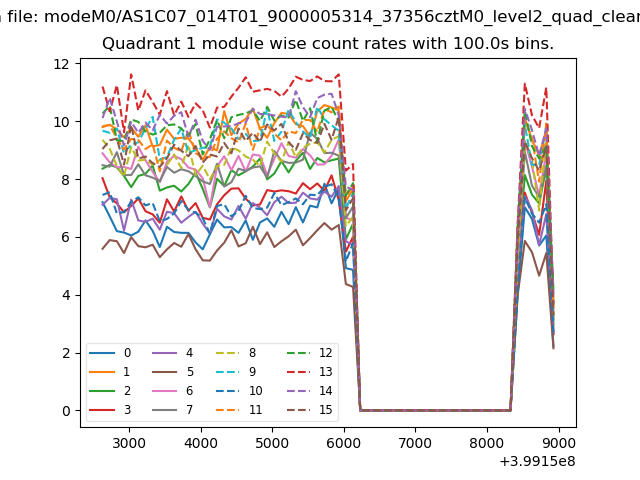
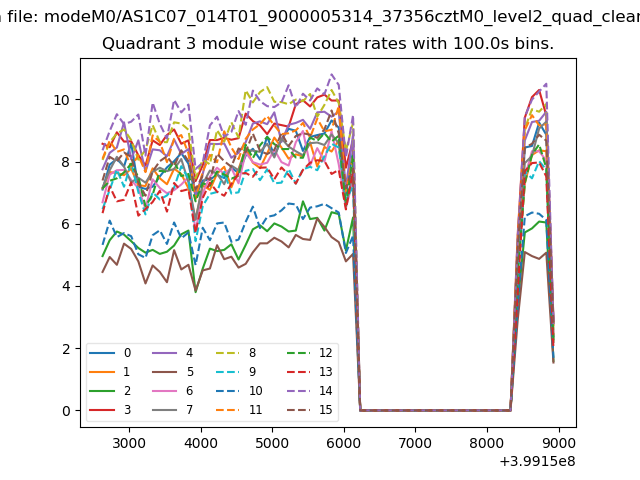
| Module-wise count rates for Quadrant A Data is divided into 100 sec bins |
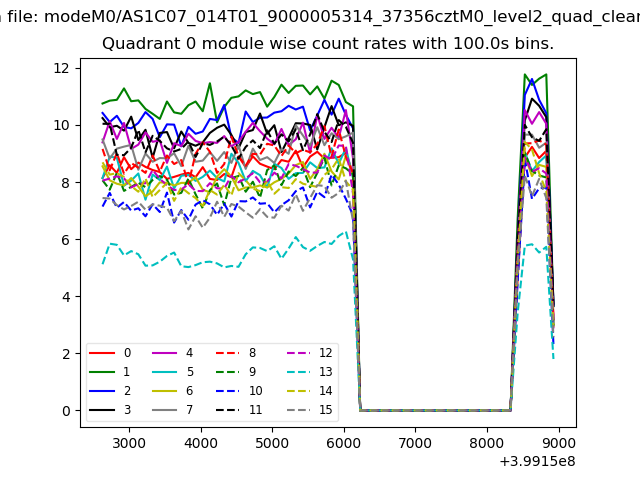 |
 |
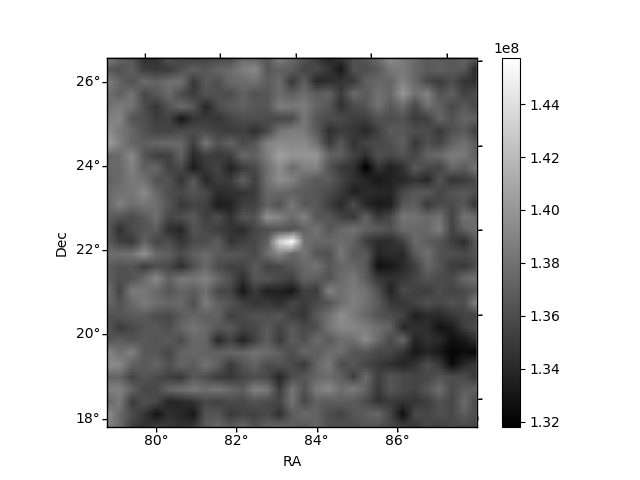
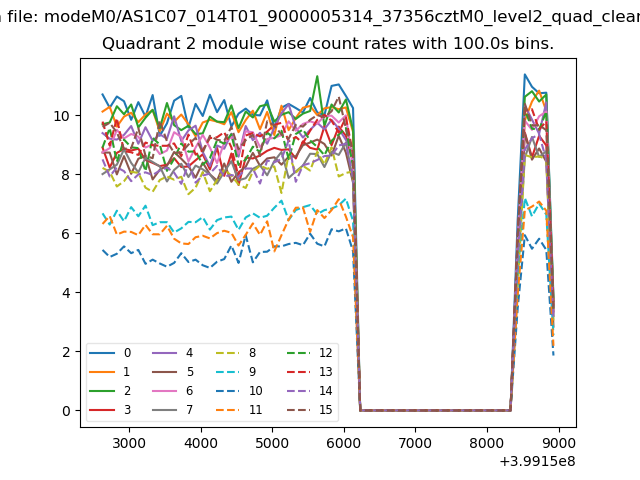
| Module-wise count rates for Quadrant B Data is divided into 100 sec bins |
 |
 |
| Module-wise count rates for Quadrant C Data is divided into 100 sec bins |
 |
 |
| Module-wise count rates for Quadrant D Data is divided into 100 sec bins |
 |
 |
| Parameter | Plot |
|---|---|
| CZT HV Monitor | 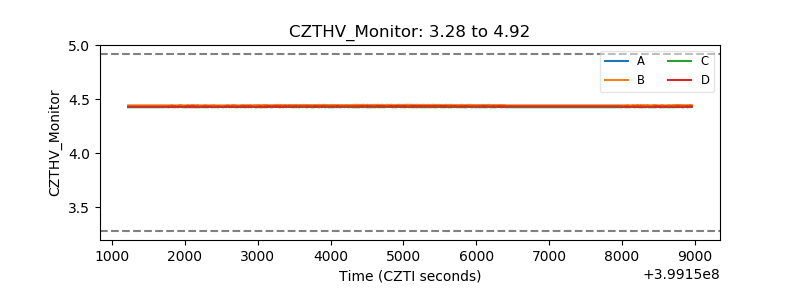 |
| D_VDD | 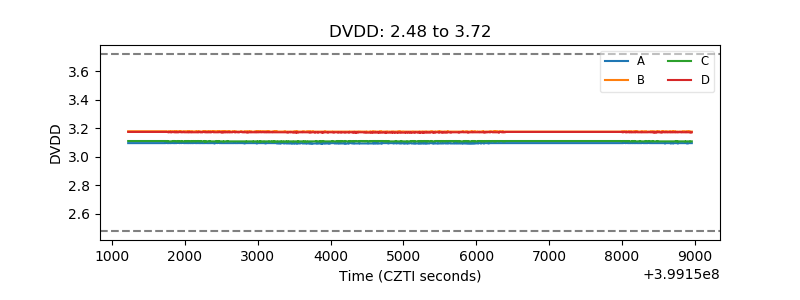 |
| Temperature 1 | 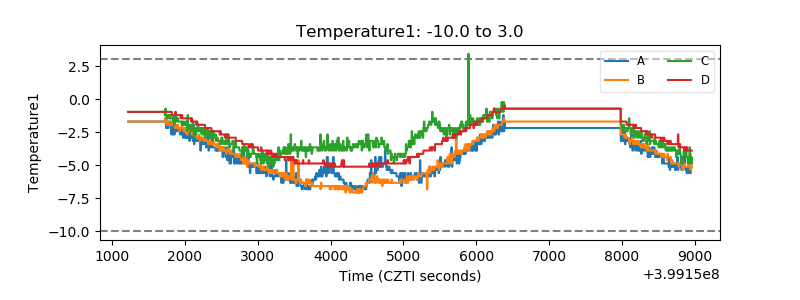 |
| Veto HV Monitor | 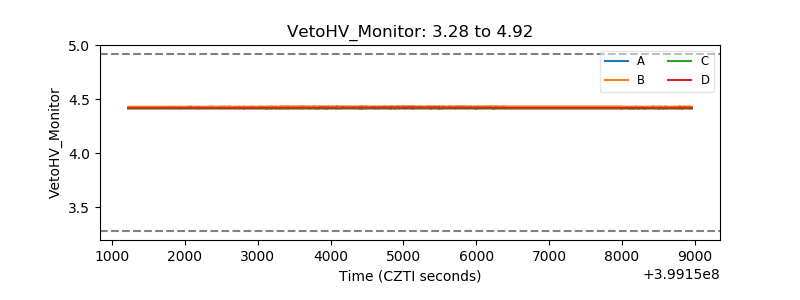 |
| Veto LLD | 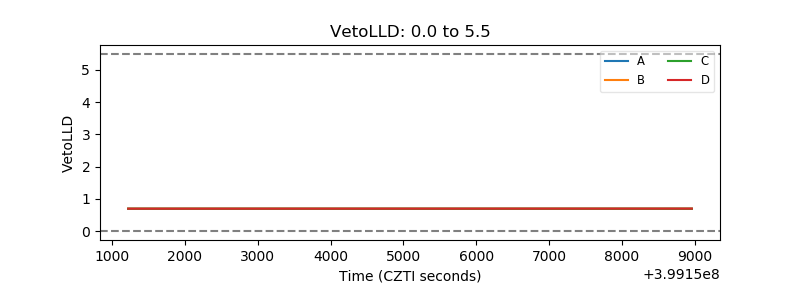 |
| Alpha Counter | 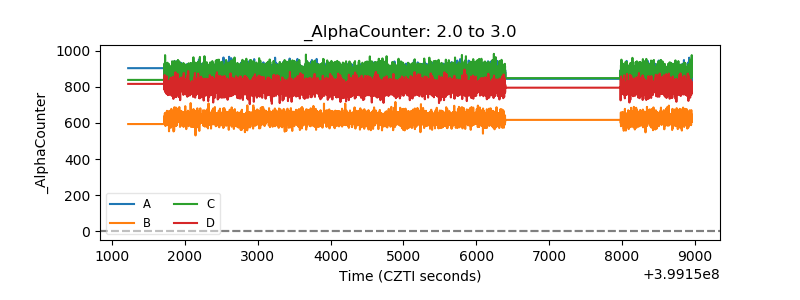 |
| _CPM_Rate | 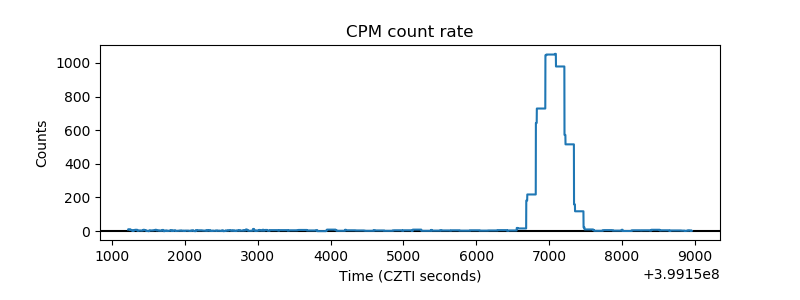 |
| CZT Counter | 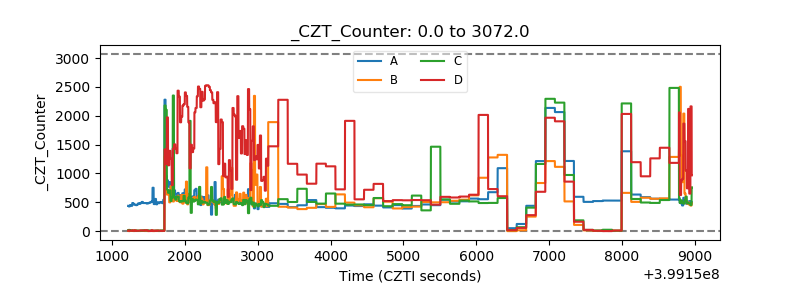 |
| +2.5 Volts monitor | 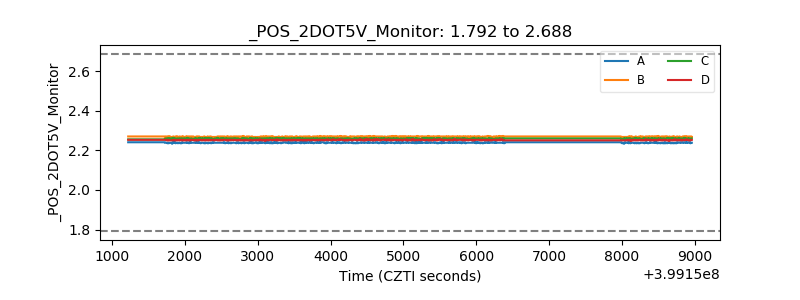 |
| +5 Volts monitor | 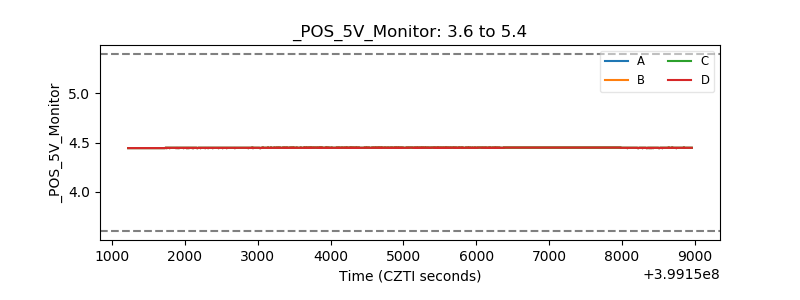 |
| _ROLL_ROT | 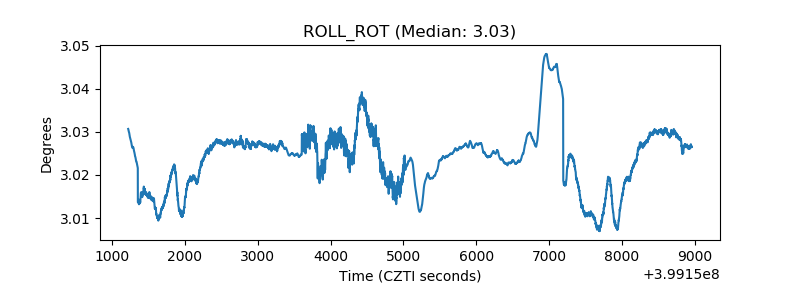 |
| _Roll_DEC | 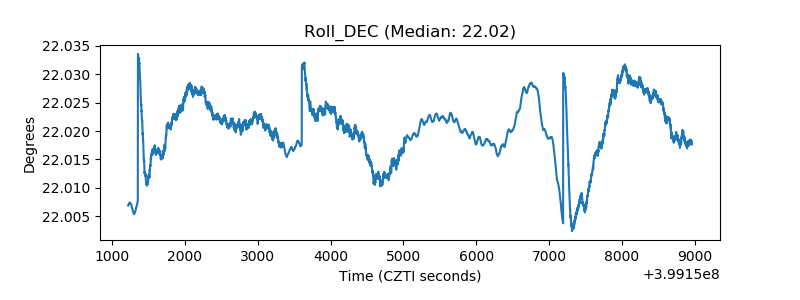 |
| _Roll_RA | 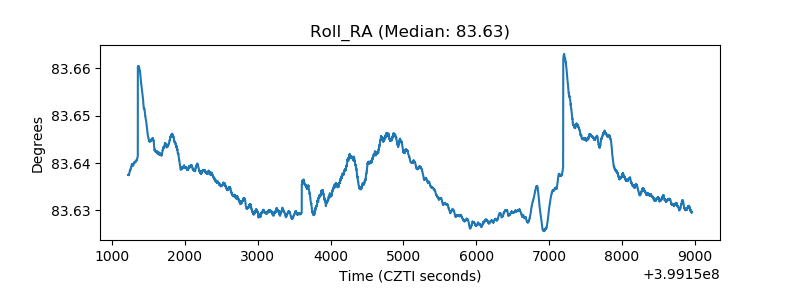 |
| Veto Counter | 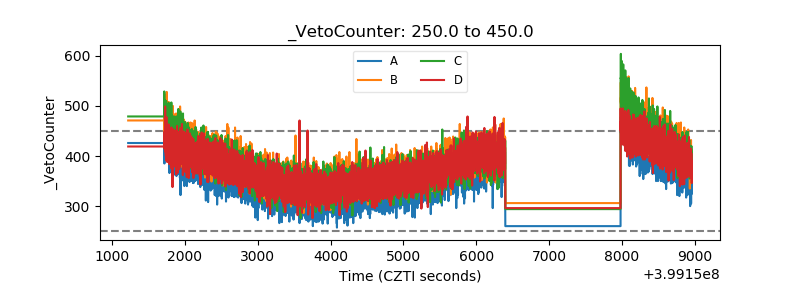 |