| Param | Original file | Final file |
|---|---|---|
| Filename | modeM0/AS1A10_094T20_9000005316cztM0_level2.fits | modeM0/AS1A10_094T20_9000005316cztM0_level2_quad_clean.evt |
| Size (bytes) | 186,488,640 | 188,631,360 |
| Size | 177.8 MB | 179.9 MB |
| Events in quadrant A | 1,186,080 | 1,274,896 |
| Events in quadrant B | 1,101,024 | 1,209,869 |
| Events in quadrant C | 1,188,374 | 1,279,506 |
| Events in quadrant D | 842,762 | 620,824 |
| Mode SS | |||
|---|---|---|---|
| Quadrant | BADHDUFLAG | Total packets | Discarded packets |
| A | 0 | 390 | 0 |
| B | 0 | 390 | 0 |
| C | 0 | 390 | 0 |
| D | 0 | 390 | 0 |
| Mode M0 | |||
|---|---|---|---|
| Quadrant | BADHDUFLAG | Total packets | Discarded packets |
| A | 0 | 40928 | 0 |
| B | 0 | 51419 | 0 |
| C | 0 | 45802 | 0 |
| D | 0 | 106568 | 0 |
| Mode M9 | |||
|---|---|---|---|
| Quadrant | BADHDUFLAG | Total packets | Discarded packets |
| A | 0 | 81 | 0 |
| B | 0 | 81 | 0 |
| C | 0 | 81 | 0 |
| D | 0 | 81 | 0 |
| Quadrant | Total seconds | Saturated seconds | Saturation percentage |
|---|---|---|---|
| A | 19263 | 59 | 0.306287% |
| B | 19261 | 1151 | 5.975806% |
| C | 19263 | 315 | 1.635259% |
| D | 19263 | 7031 | 36.500026% |
Noise dominated data is calculated using 1-second bins in cleaned event files. If a bin has >2000 counts, and if more than 50% of those come from <1% of pixels, then it is considered to be noise-dominated and hence unusable.
| Quadrant | # 1 sec bins | Bins with >0 counts | Bins with >2000 counts | High rate bins dominated by noise | Noise dominated (total time) | Noise dominated (detector-on time) | Marked lightcurve |
|---|---|---|---|---|---|---|---|
| A | 27275 | 19263 | 0 | 0 | 0.00% | 0.00% | 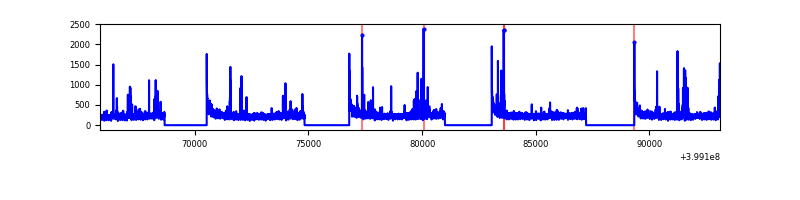 |
| B | 27275 | 19238 | 0 | 0 | 0.00% | 0.00% | 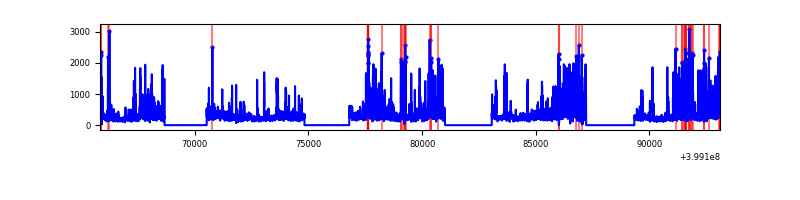 |
| C | 27275 | 19262 | 0 | 0 | 0.00% | 0.00% | 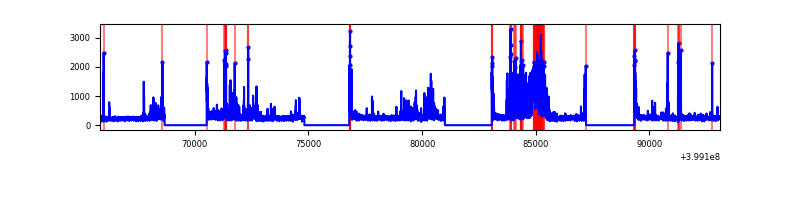 |
| D | 27275 | 19238 | 0 | 0 | 0.00% | 0.00% | 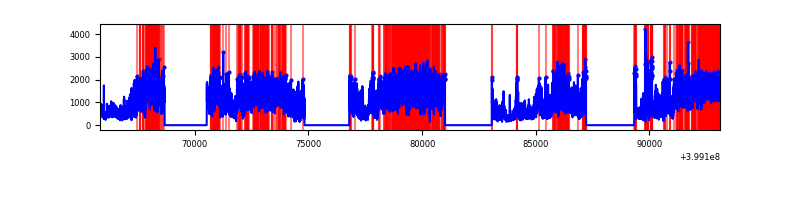 |
Top three noisy pixels from each quadrant. If the there are fewer than three noisy pixels in the level2.evt file, extra rows are filled as -1
| Pixel properties | Quadrant properties | ||||||
|---|---|---|---|---|---|---|---|
| Quadrant | DetID | PixID | Counts | Sigma | Mean | Median | Sigma |
| A | 9 | 19 | 968 | 8.69 | 310 | 294 | 77.6 |
| A | 7 | 110 | 961 | 8.6 | 310 | 294 | 77.6 |
| A | 14 | 95 | 937 | 8.29 | 310 | 294 | 77.6 |
| B | 2 | 9 | 989 | 12.06 | 292 | 280 | 58.8 |
| B | 3 | 80 | 861 | 9.88 | 292 | 280 | 58.8 |
| B | 2 | 8 | 809 | 9.0 | 292 | 280 | 58.8 |
| C | 1 | 81 | 1040 | 9.14 | 313 | 297 | 81.3 |
| C | 1 | 80 | 991 | 8.53 | 313 | 297 | 81.3 |
| C | 3 | 203 | 943 | 7.94 | 313 | 297 | 81.3 |
| D | 10 | 189 | 653 | 6.62 | 241 | 221 | 65.2 |
| D | 10 | 113 | 625 | 6.19 | 241 | 221 | 65.2 |
| D | 6 | 67 | 622 | 6.15 | 241 | 221 | 65.2 |
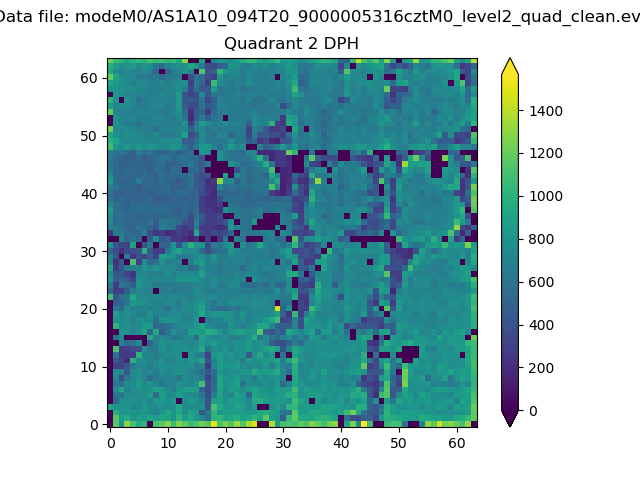
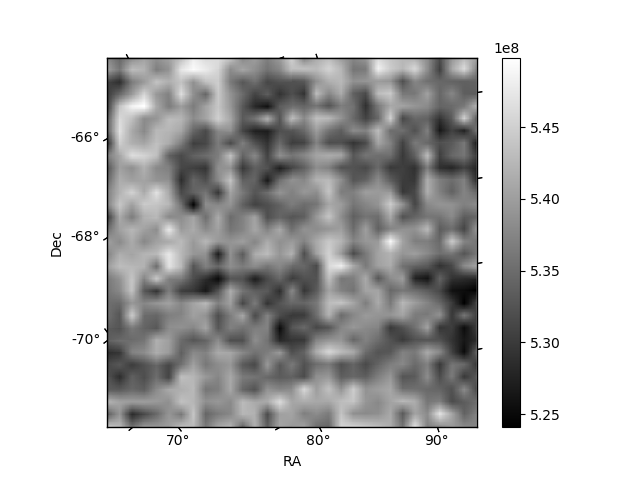
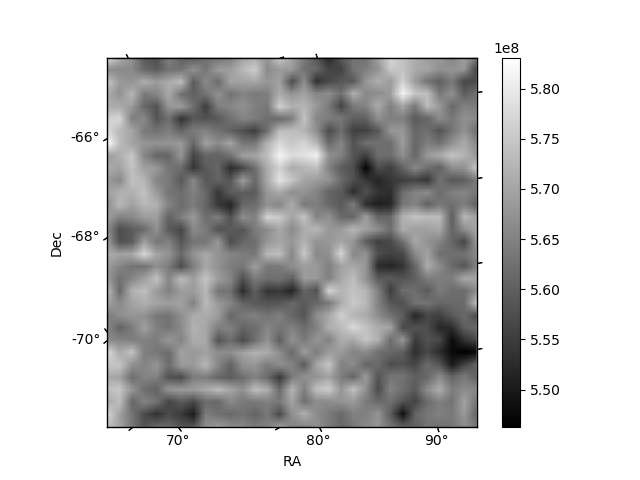
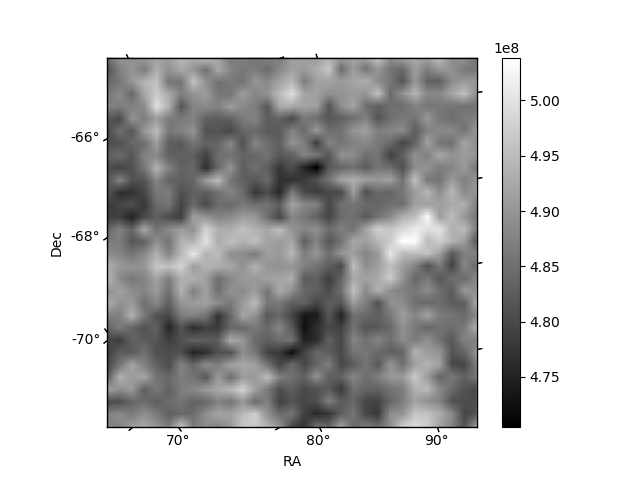
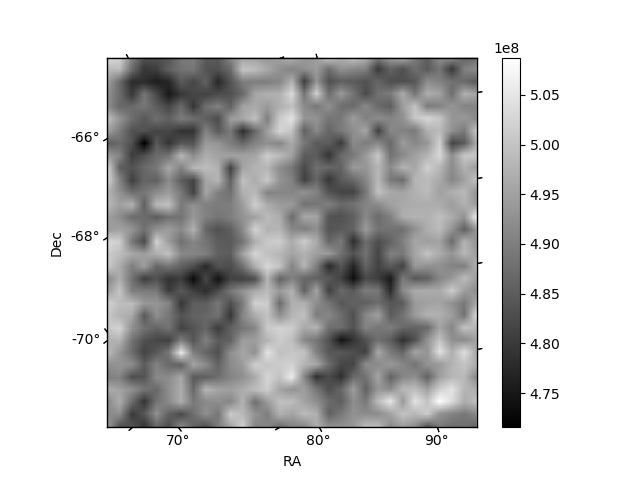
Histogram calculated using DETX and DETY for each event in the final _common_clean file
| Quadrant A | 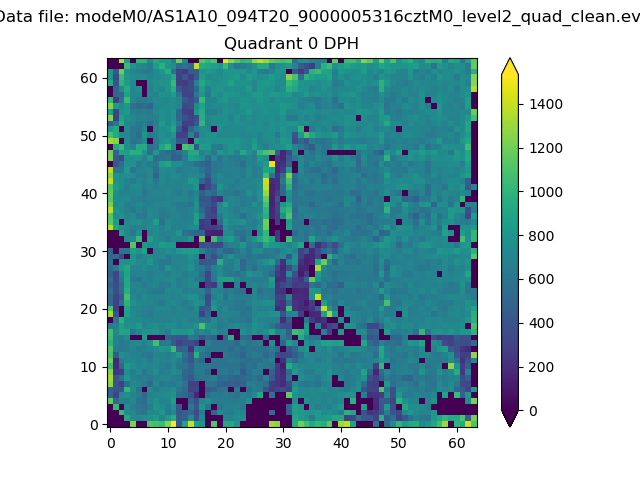 |
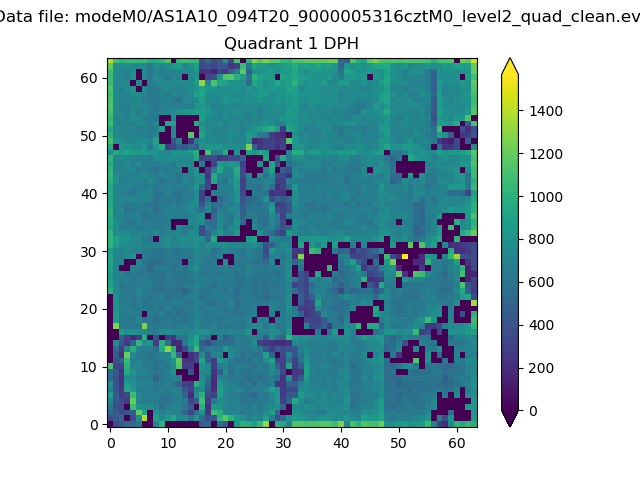 |
Quadrant B |
|---|---|---|---|
| Quadrant D | 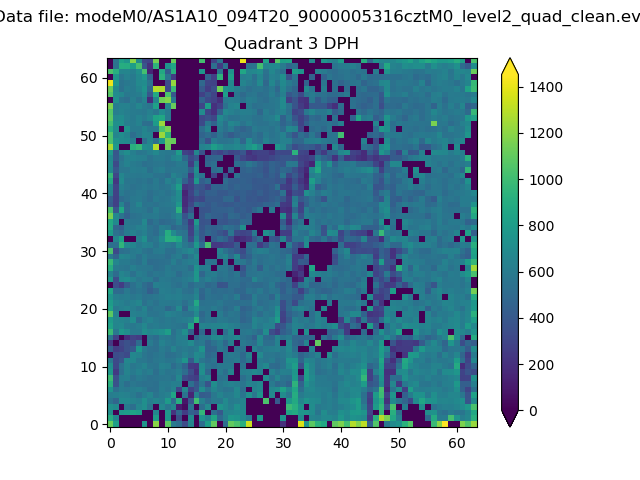 |
 |
Quadrant C |
| Plot type | Count rate plots | Images |
|---|---|---|
| Comparison with Poisson distribution Blue bars denote a histogram of data divided into 1 sec bins. Red curve is a Poisson curve with rate = median count rate of data. |
 |
 |
| Quadrant-wise count rates Data is divided into 100 sec bins |
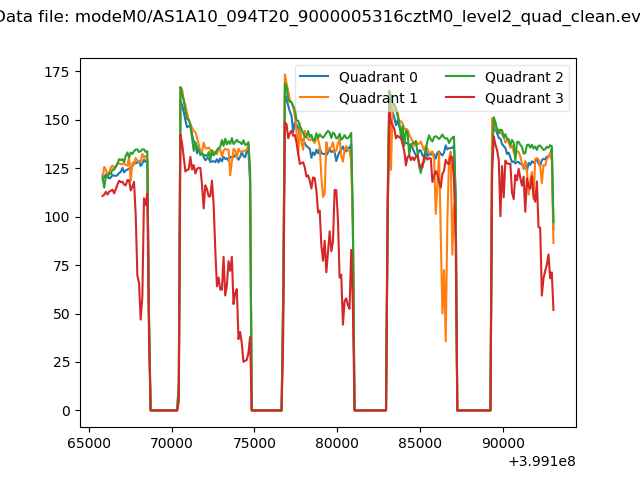 |
|
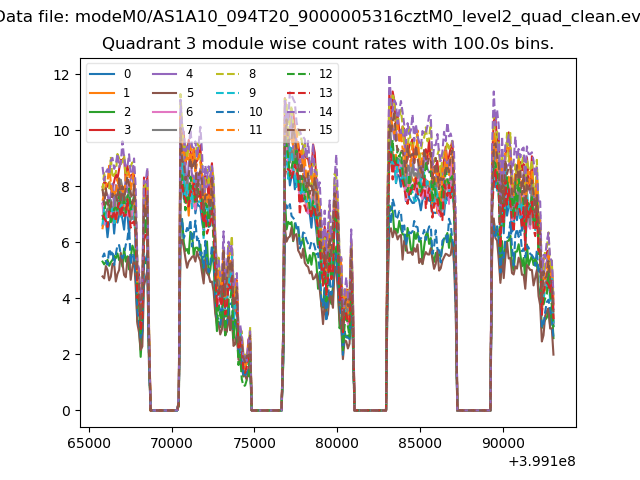
| Module-wise count rates for Quadrant A Data is divided into 100 sec bins |
 |
 |
| Module-wise count rates for Quadrant B Data is divided into 100 sec bins |
 |
 |
| Module-wise count rates for Quadrant C Data is divided into 100 sec bins |
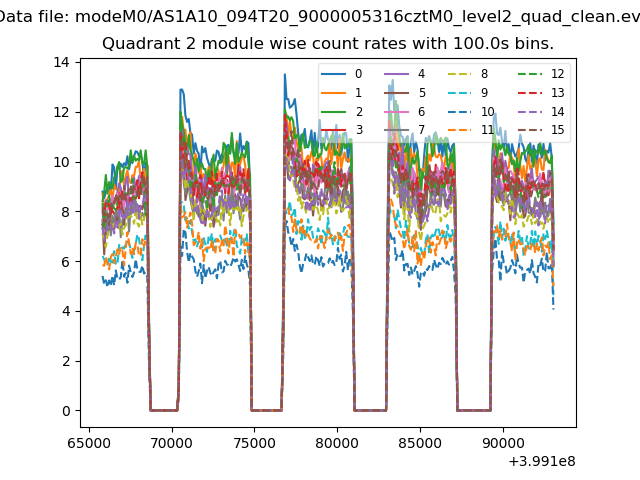 |
 |
| Module-wise count rates for Quadrant D Data is divided into 100 sec bins |
 |
 |
| Parameter | Plot |
|---|---|
| CZT HV Monitor |  |
| D_VDD | 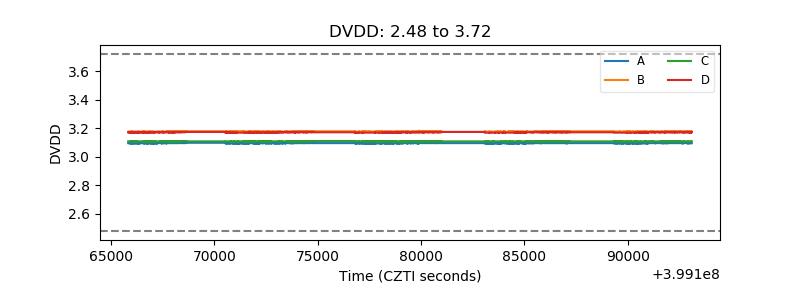 |
| Temperature 1 | 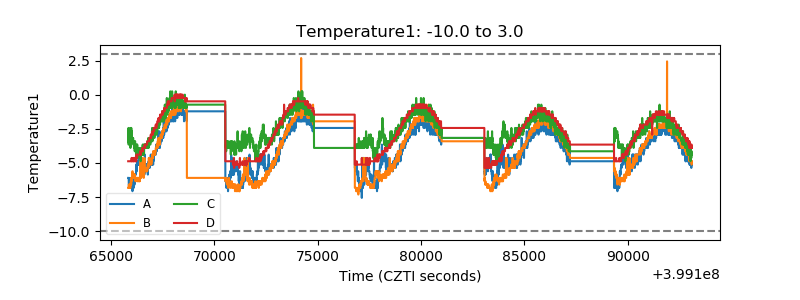 |
| Veto HV Monitor | 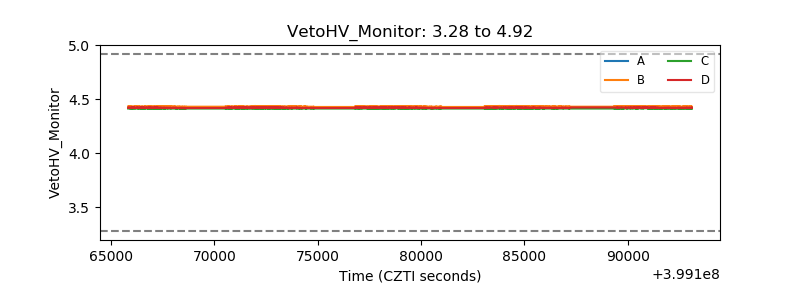 |
| Veto LLD | 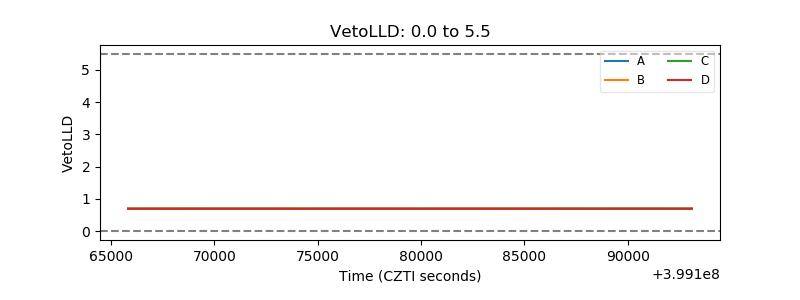 |
| Alpha Counter |  |
| _CPM_Rate | 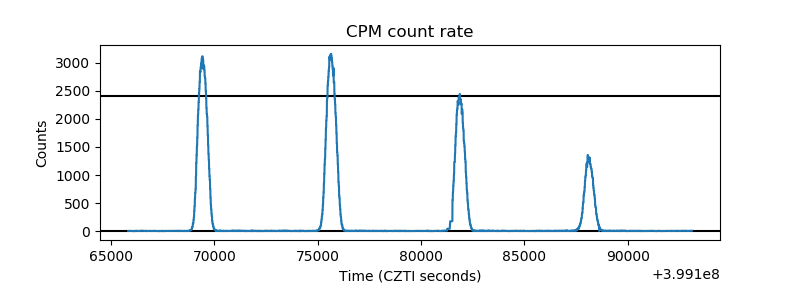 |
| CZT Counter | 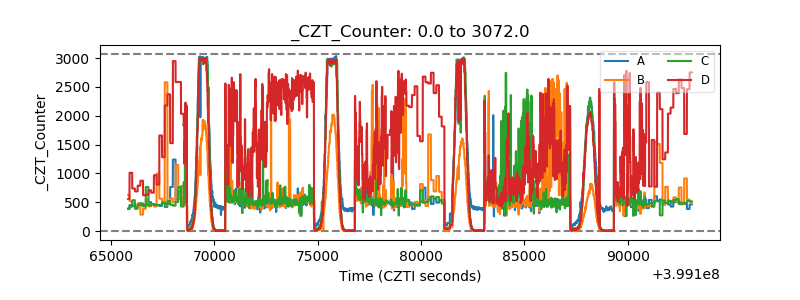 |
| +2.5 Volts monitor |  |
| +5 Volts monitor |  |
| _ROLL_ROT | 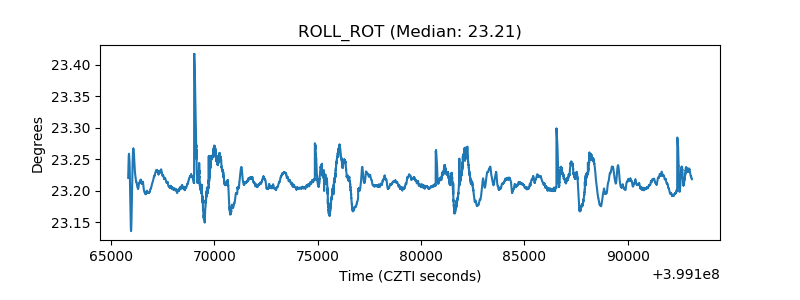 |
| _Roll_DEC | 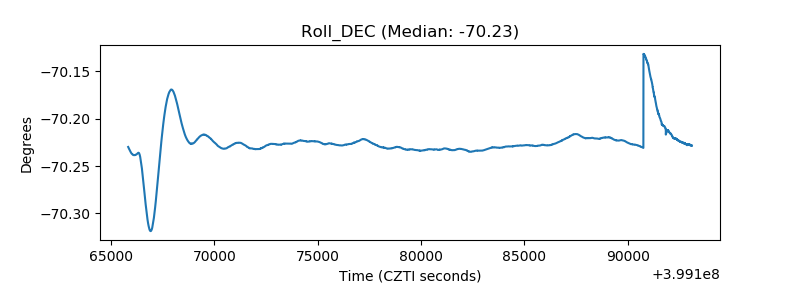 |
| _Roll_RA | 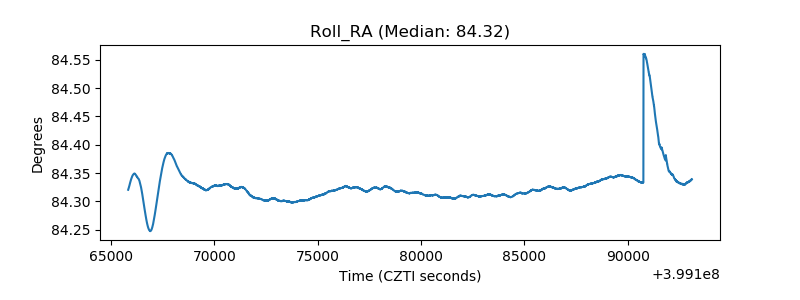 |
| Veto Counter |  |