| Param | Original file | Final file |
|---|---|---|
| Filename | modeM0/AS1A10_094T20_9000005316_37359cztM0_level2.evt | modeM0/AS1A10_094T20_9000005316_37359cztM0_level2_quad_clean.evt |
| Size (bytes) | 398,502,720 | 75,363,840 |
| Size | 380.0 MB | 71.9 MB |
| Events in quadrant A | 1,995,129 | 511,552 |
| Events in quadrant B | 2,228,897 | 526,672 |
| Events in quadrant C | 2,127,407 | 527,476 |
| Events in quadrant D | 5,451,019 | 439,686 |
| Mode SS | |||
|---|---|---|---|
| Quadrant | BADHDUFLAG | Total packets | Discarded packets |
| A | 0 | 78 | 0 |
| B | 0 | 78 | 0 |
| C | 0 | 78 | 0 |
| D | 0 | 78 | 0 |
| Mode M0 | |||
|---|---|---|---|
| Quadrant | BADHDUFLAG | Total packets | Discarded packets |
| A | 0 | 8380 | 2 |
| B | 0 | 9190 | 1 |
| C | 0 | 8631 | 1 |
| D | 0 | 18955 | 1 |
| Mode M9 | |||
|---|---|---|---|
| Quadrant | BADHDUFLAG | Total packets | Discarded packets |
| A | 0 | 19 | 0 |
| B | 0 | 19 | 0 |
| C | 0 | 19 | 0 |
| D | 0 | 19 | 0 |
| Quadrant | Total seconds | Saturated seconds | Saturation percentage |
|---|---|---|---|
| A | 3924 | 5 | 0.127421% |
| B | 3924 | 55 | 1.401631% |
| C | 3924 | 29 | 0.739042% |
| D | 3924 | 879 | 22.400612% |
Noise dominated data is calculated using 1-second bins in cleaned event files. If a bin has >2000 counts, and if more than 50% of those come from <1% of pixels, then it is considered to be noise-dominated and hence unusable.
| Quadrant | # 1 sec bins | Bins with >0 counts | Bins with >2000 counts | High rate bins dominated by noise | Noise dominated (total time) | Noise dominated (detector-on time) | Marked lightcurve |
|---|---|---|---|---|---|---|---|
| A | 5778 | 3925 | 2 | 2 | 0.03% | 0.05% | 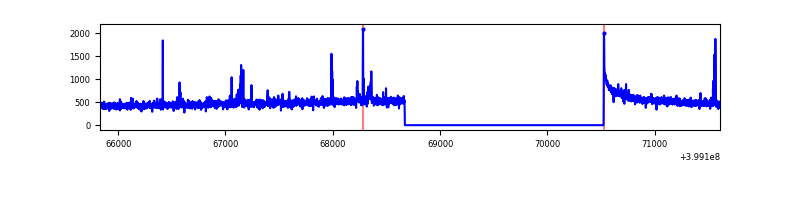 |
| B | 5778 | 3925 | 30 | 30 | 0.52% | 0.76% | 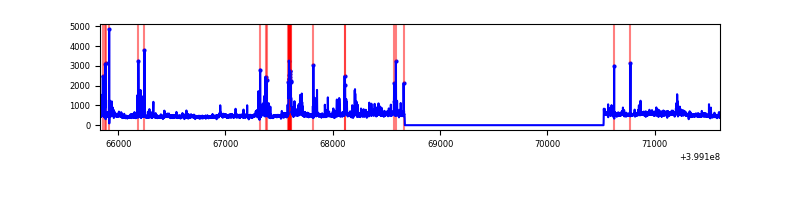 |
| C | 5778 | 3925 | 23 | 23 | 0.40% | 0.59% | 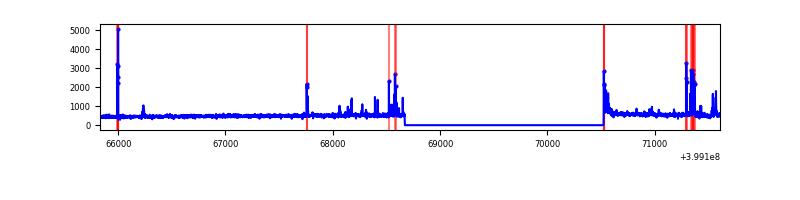 |
| D | 5778 | 3925 | 803 | 803 | 13.90% | 20.46% | 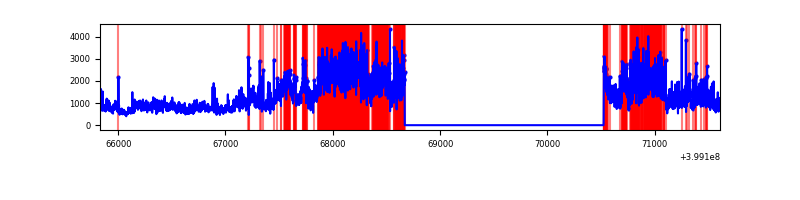 |
Top three noisy pixels from each quadrant. If the there are fewer than three noisy pixels in the level2.evt file, extra rows are filled as -1
| Pixel properties | Quadrant properties | ||||||
|---|---|---|---|---|---|---|---|
| Quadrant | DetID | PixID | Counts | Sigma | Mean | Median | Sigma |
| A | 10 | 83 | 175291 | 1915.69 | 453 | 443 | 91.3 |
| A | 15 | 223 | 25907 | 278.99 | 453 | 443 | 91.3 |
| A | 9 | 143 | 23701 | 254.82 | 453 | 443 | 91.3 |
| B | 0 | 190 | 119895 | 1396.32 | 453 | 441 | 85.5 |
| B | 5 | 172 | 73787 | 857.36 | 453 | 441 | 85.5 |
| B | 12 | 18 | 61015 | 708.06 | 453 | 441 | 85.5 |
| C | 15 | 214 | 163499 | 1545.34 | 454 | 458 | 105.5 |
| C | 1 | 23 | 81473 | 767.88 | 454 | 458 | 105.5 |
| C | 14 | 254 | 71076 | 669.33 | 454 | 458 | 105.5 |
| D | 12 | 235 | 2717696 | 26580.4 | 416 | 404 | 102.2 |
| D | 12 | 227 | 709382 | 6935.18 | 416 | 404 | 102.2 |
| D | 2 | 249 | 197444 | 1927.43 | 416 | 404 | 102.2 |
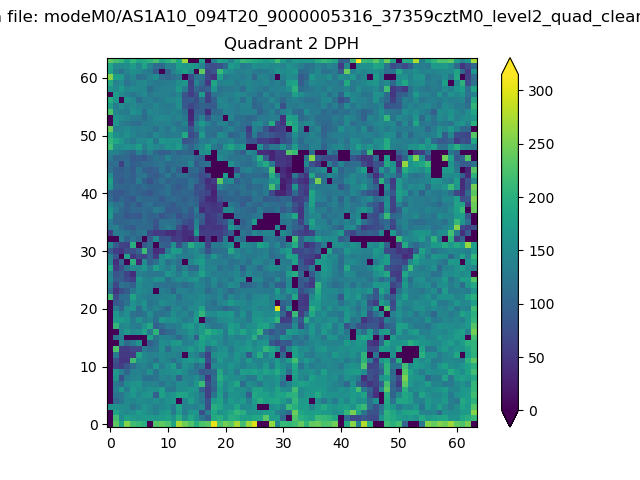
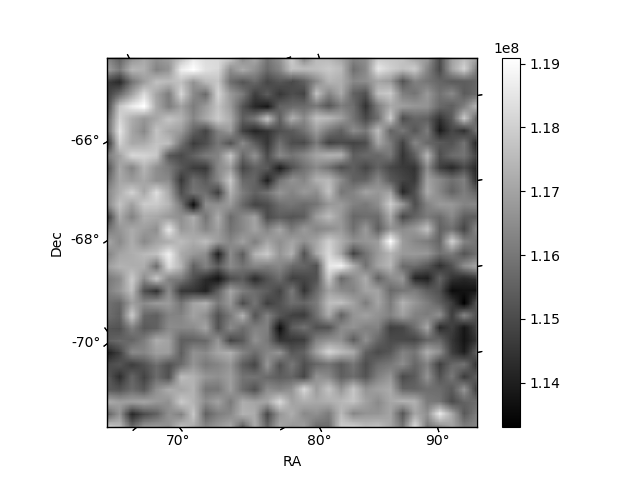
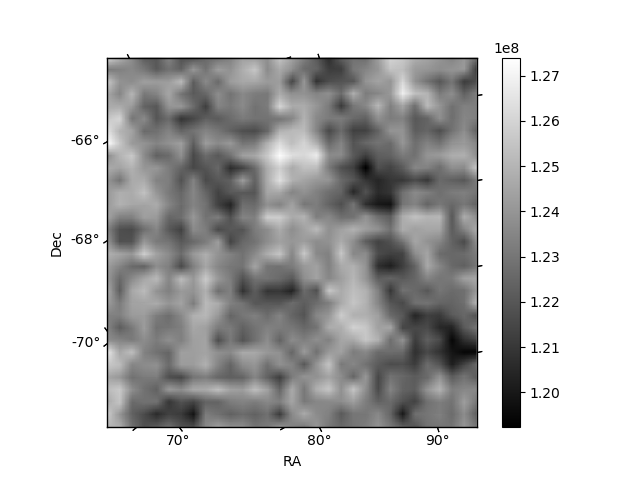
Histogram calculated using DETX and DETY for each event in the final _common_clean file
| Quadrant A | 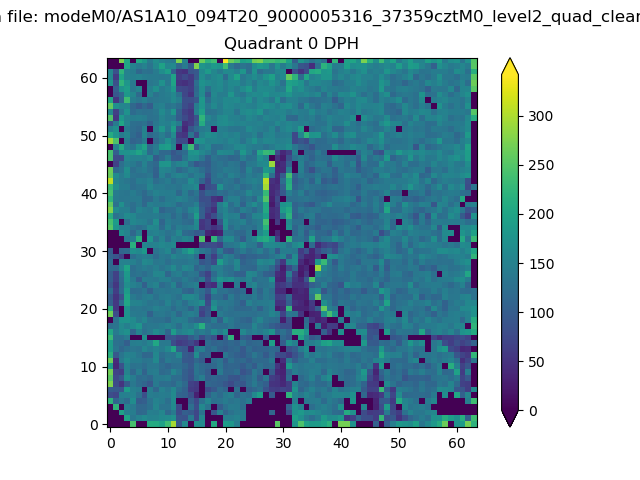 |
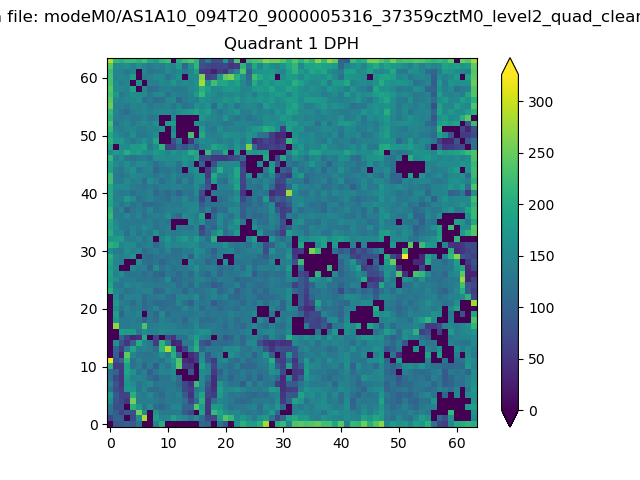 |
Quadrant B |
|---|---|---|---|
| Quadrant D | 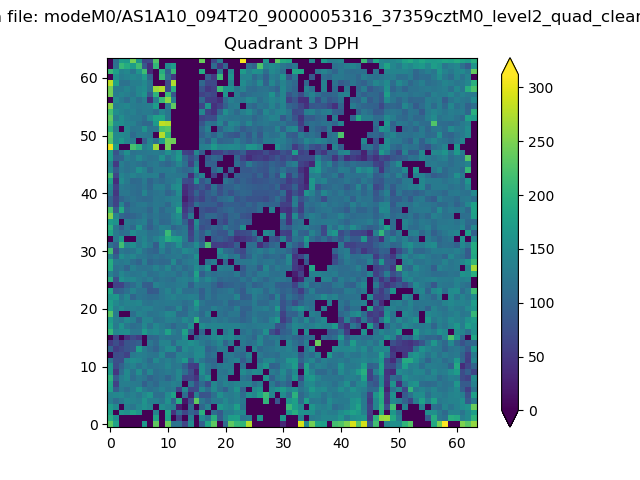 |
 |
Quadrant C |
| Plot type | Count rate plots | Images |
|---|---|---|
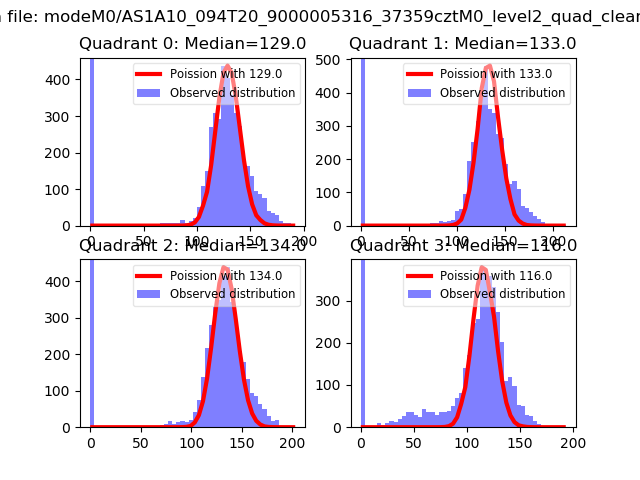
| Comparison with Poisson distribution Blue bars denote a histogram of data divided into 1 sec bins. Red curve is a Poisson curve with rate = median count rate of data. |
 |
 |
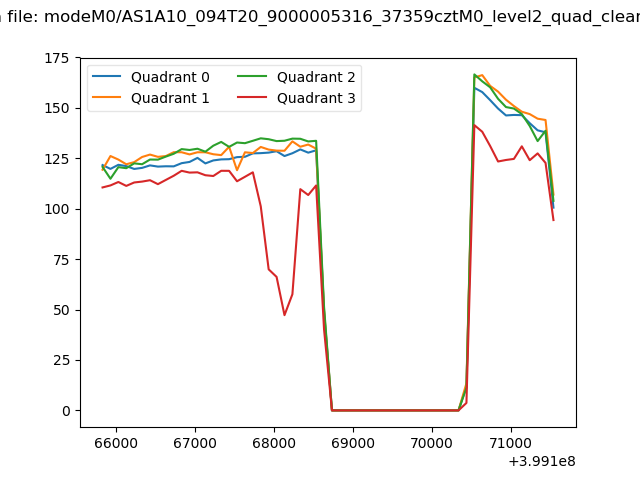
| Quadrant-wise count rates Data is divided into 100 sec bins |
 |
|
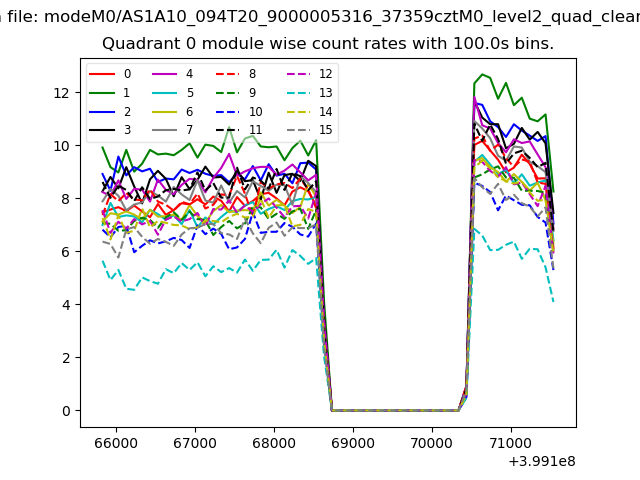
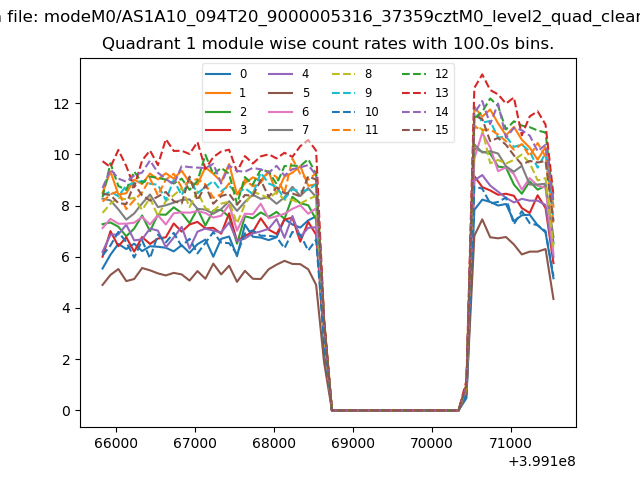
| Module-wise count rates for Quadrant A Data is divided into 100 sec bins |
 |
 |
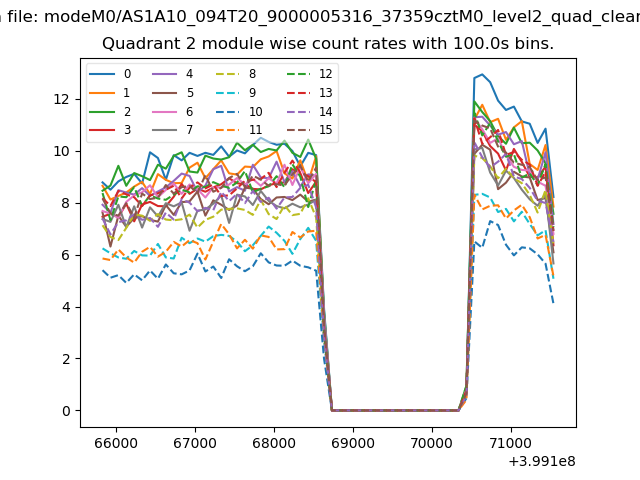
| Module-wise count rates for Quadrant B Data is divided into 100 sec bins |
 |
 |
| Module-wise count rates for Quadrant C Data is divided into 100 sec bins |
 |
 |
| Module-wise count rates for Quadrant D Data is divided into 100 sec bins |
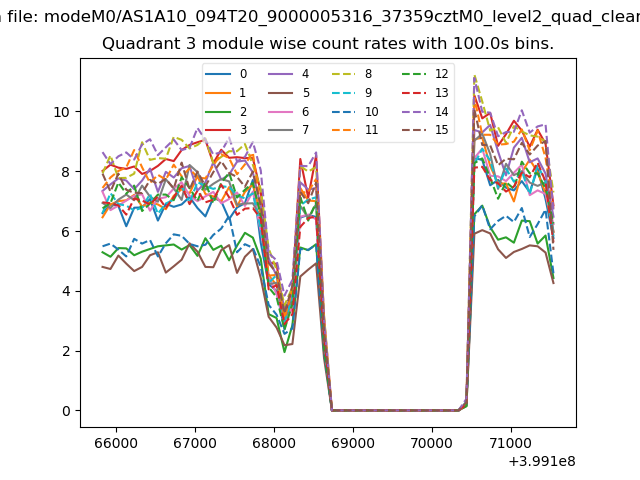 |
 |
| Parameter | Plot |
|---|---|
| CZT HV Monitor | 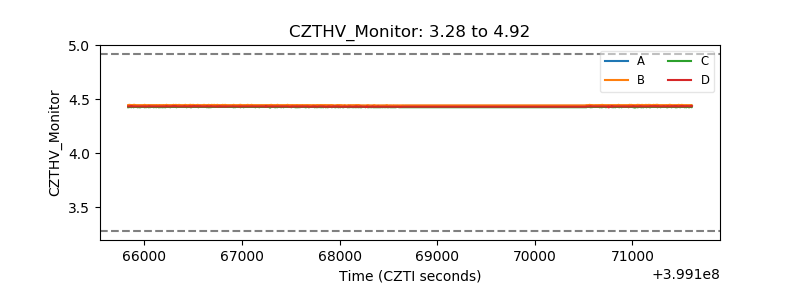 |
| D_VDD | 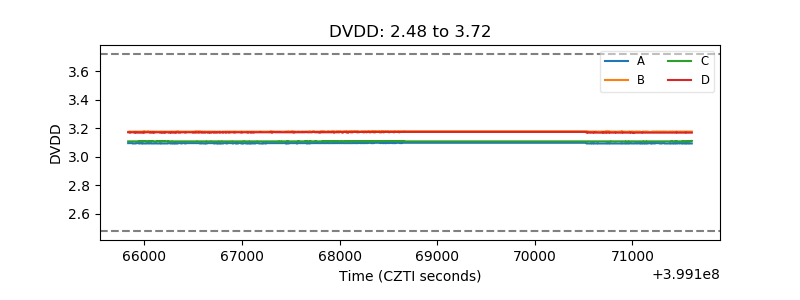 |
| Temperature 1 | 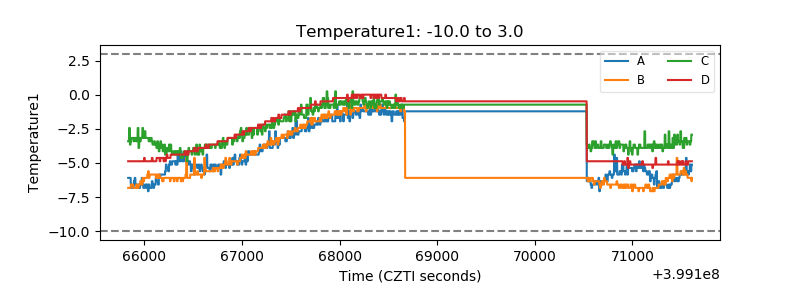 |
| Veto HV Monitor | 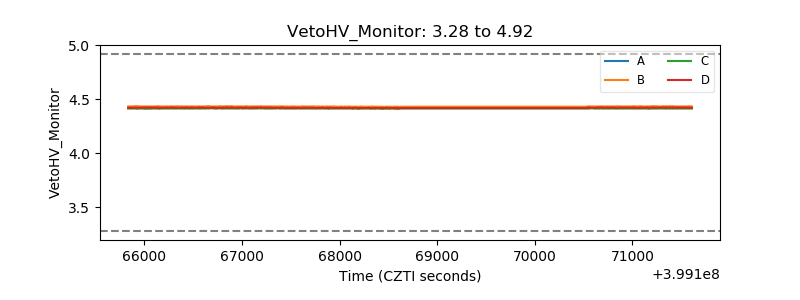 |
| Veto LLD | 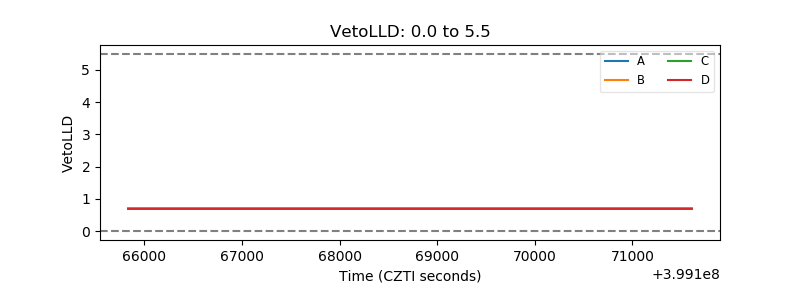 |
| Alpha Counter | 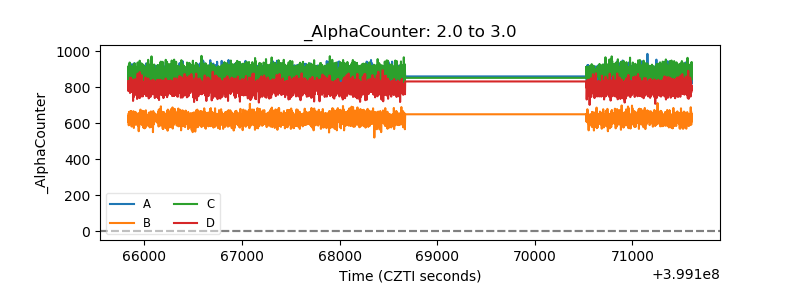 |
| _CPM_Rate | 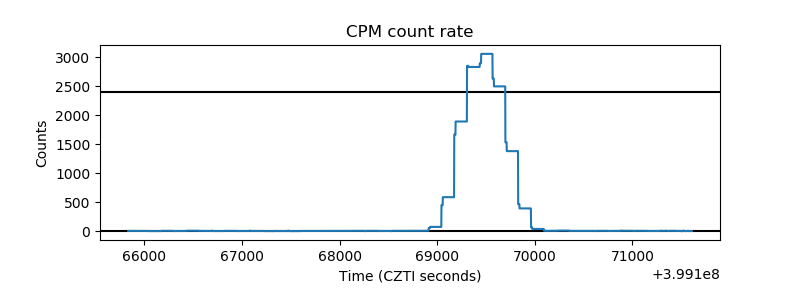 |
| CZT Counter | 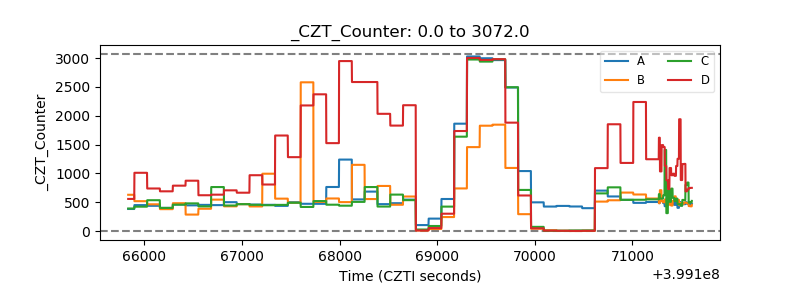 |
| +2.5 Volts monitor |  |
| +5 Volts monitor | 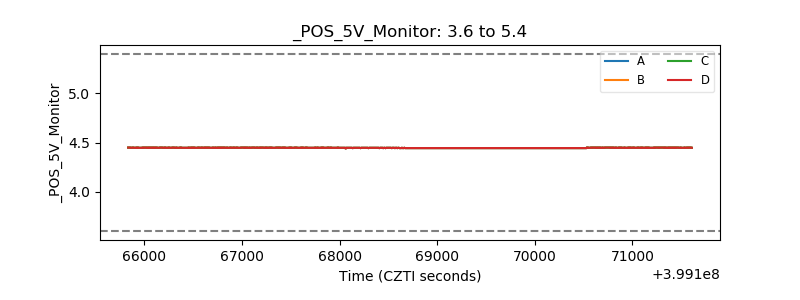 |
| _ROLL_ROT | 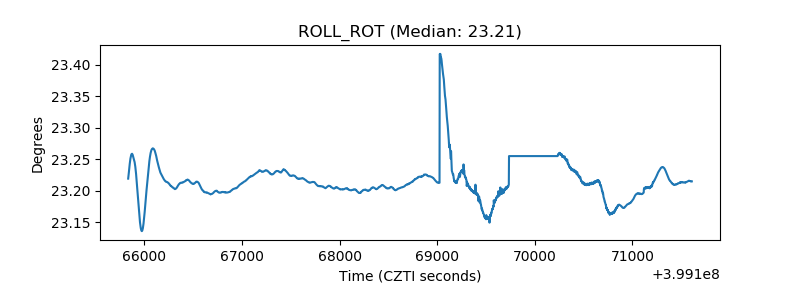 |
| _Roll_DEC | 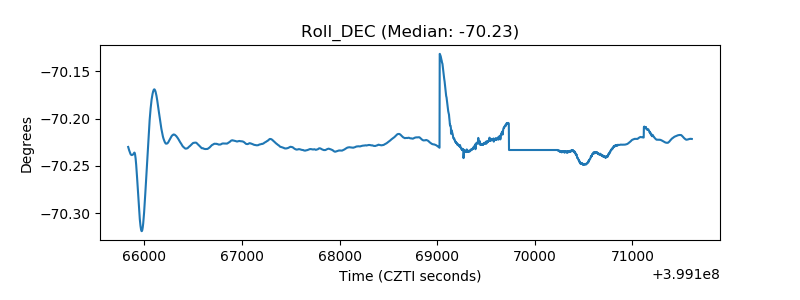 |
| _Roll_RA | 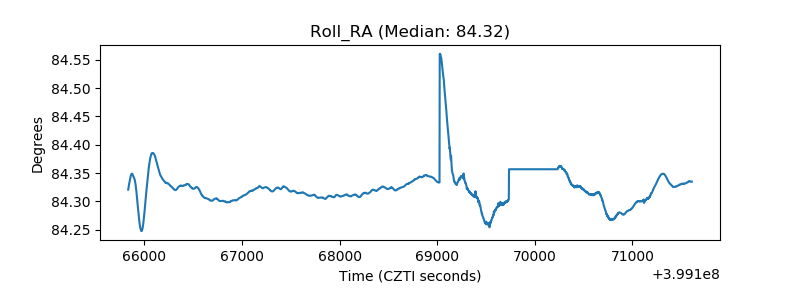 |
| Veto Counter | 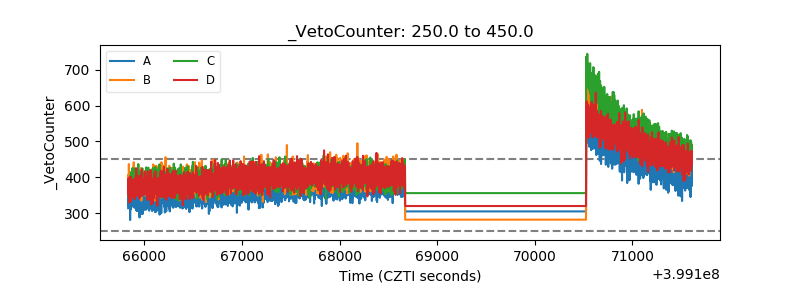 |