| Param | Original file | Final file |
|---|---|---|
| Filename | modeM0/AS1A10_094T20_9000005316_37360cztM0_level2.evt | modeM0/AS1A10_094T20_9000005316_37360cztM0_level2_quad_clean.evt |
| Size (bytes) | 617,129,280 | 100,851,840 |
| Size | 588.5 MB | 96.2 MB |
| Events in quadrant A | 2,724,380 | 714,845 |
| Events in quadrant B | 2,939,417 | 736,414 |
| Events in quadrant C | 2,971,132 | 738,060 |
| Events in quadrant D | 9,704,336 | 501,071 |
| Mode SS | |||
|---|---|---|---|
| Quadrant | BADHDUFLAG | Total packets | Discarded packets |
| A | 0 | 106 | 0 |
| B | 0 | 106 | 0 |
| C | 0 | 106 | 0 |
| D | 0 | 106 | 0 |
| Mode M0 | |||
|---|---|---|---|
| Quadrant | BADHDUFLAG | Total packets | Discarded packets |
| A | 0 | 11216 | 3 |
| B | 0 | 11928 | 3 |
| C | 0 | 11794 | 2 |
| D | 0 | 32370 | 2 |
| Mode M9 | |||
|---|---|---|---|
| Quadrant | BADHDUFLAG | Total packets | Discarded packets |
| A | 0 | 33 | 0 |
| B | 0 | 33 | 0 |
| C | 0 | 33 | 0 |
| D | 0 | 34 | 0 |
| Quadrant | Total seconds | Saturated seconds | Saturation percentage |
|---|---|---|---|
| A | 5179 | 14 | 0.270322% |
| B | 5178 | 103 | 1.989185% |
| C | 5179 | 39 | 0.753041% |
| D | 5179 | 2630 | 50.782004% |
Noise dominated data is calculated using 1-second bins in cleaned event files. If a bin has >2000 counts, and if more than 50% of those come from <1% of pixels, then it is considered to be noise-dominated and hence unusable.
| Quadrant | # 1 sec bins | Bins with >0 counts | Bins with >2000 counts | High rate bins dominated by noise | Noise dominated (total time) | Noise dominated (detector-on time) | Marked lightcurve |
|---|---|---|---|---|---|---|---|
| A | 7151 | 5180 | 6 | 6 | 0.08% | 0.12% | 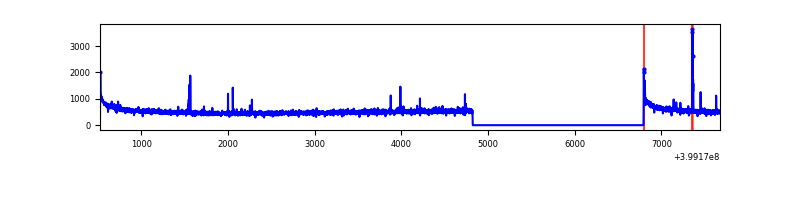 |
| B | 7151 | 5180 | 57 | 57 | 0.80% | 1.10% | 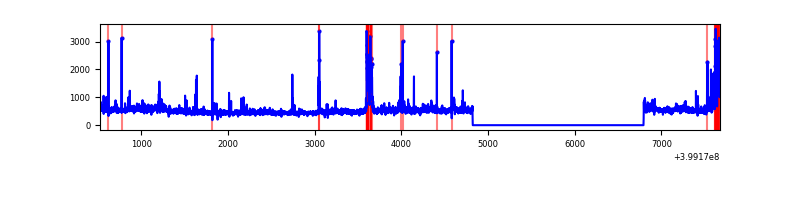 |
| C | 7151 | 5180 | 32 | 32 | 0.45% | 0.62% | 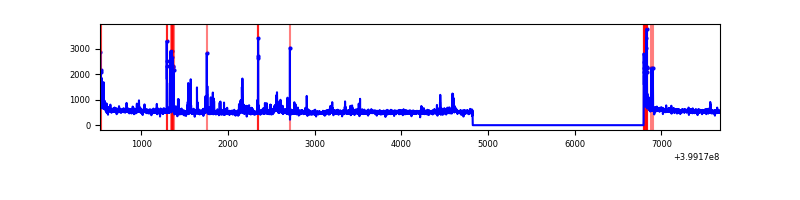 |
| D | 7151 | 5179 | 2396 | 2396 | 33.51% | 46.26% | 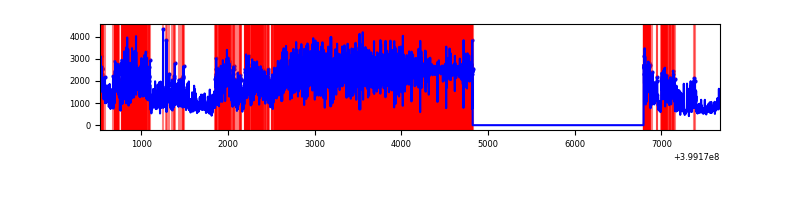 |
Top three noisy pixels from each quadrant. If the there are fewer than three noisy pixels in the level2.evt file, extra rows are filled as -1
| Pixel properties | Quadrant properties | ||||||
|---|---|---|---|---|---|---|---|
| Quadrant | DetID | PixID | Counts | Sigma | Mean | Median | Sigma |
| A | 10 | 83 | 274211 | 2202.44 | 616 | 604 | 124.2 |
| A | 9 | 143 | 43619 | 346.26 | 616 | 604 | 124.2 |
| A | 13 | 248 | 9042 | 67.92 | 616 | 604 | 124.2 |
| B | 5 | 255 | 145454 | 1250.22 | 617 | 599 | 115.9 |
| B | 12 | 18 | 90903 | 779.4 | 617 | 599 | 115.9 |
| B | 0 | 190 | 68916 | 589.63 | 617 | 599 | 115.9 |
| C | 1 | 23 | 221968 | 1561.42 | 621 | 626 | 141.8 |
| C | 15 | 214 | 220016 | 1547.65 | 621 | 626 | 141.8 |
| C | 0 | 10 | 70910 | 495.81 | 621 | 626 | 141.8 |
| D | 12 | 235 | 7515977 | 65440.54 | 473 | 461 | 114.8 |
| D | 12 | 227 | 151250 | 1312.98 | 473 | 461 | 114.8 |
| D | 2 | 249 | 72838 | 630.21 | 473 | 461 | 114.8 |
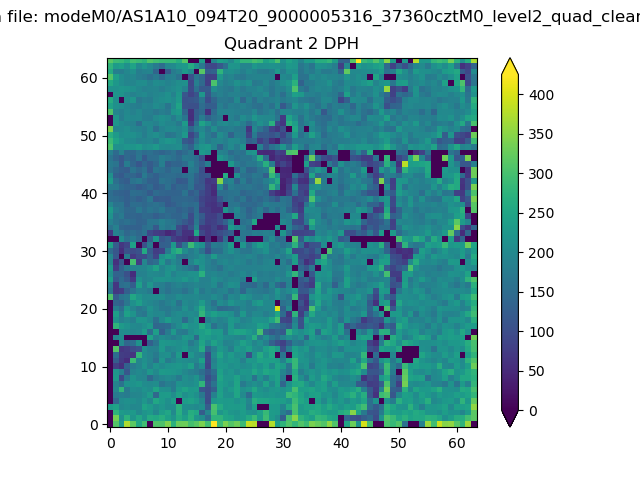
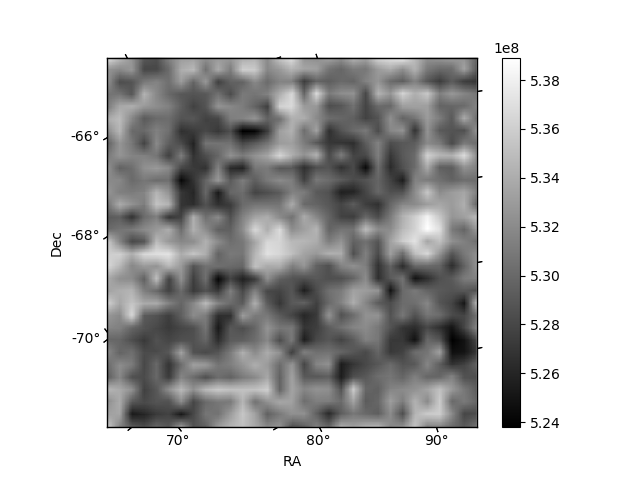
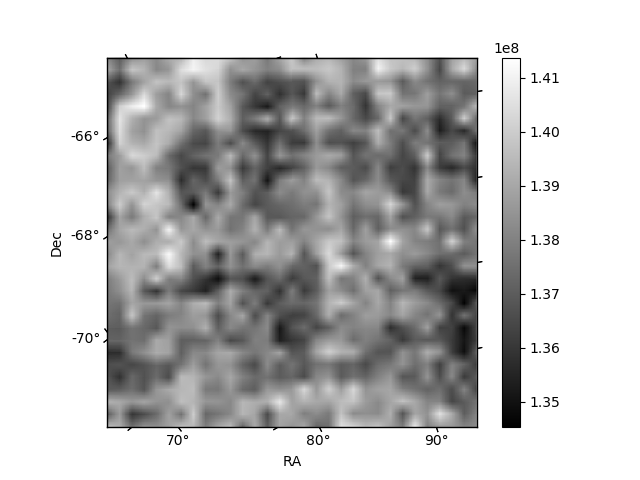
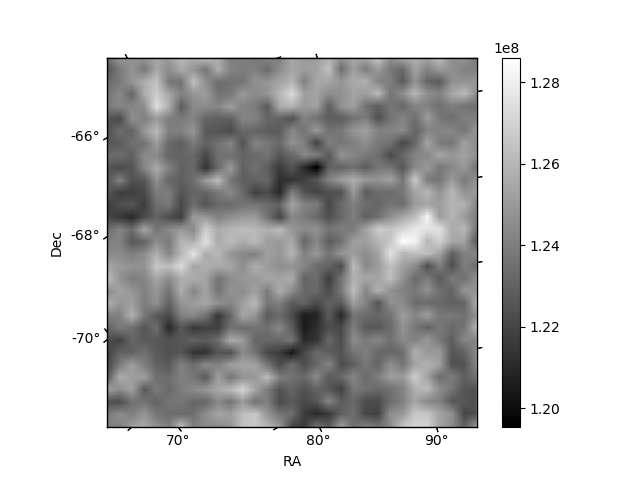
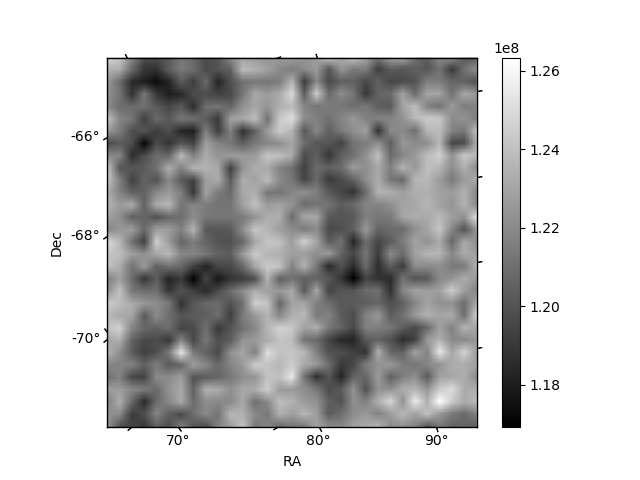
Histogram calculated using DETX and DETY for each event in the final _common_clean file
| Quadrant A | 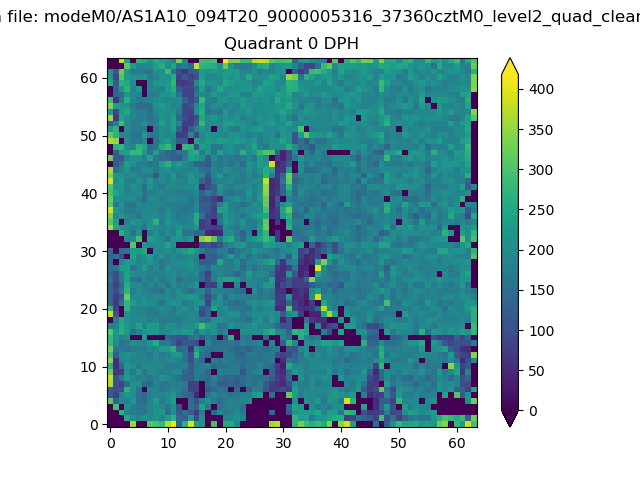 |
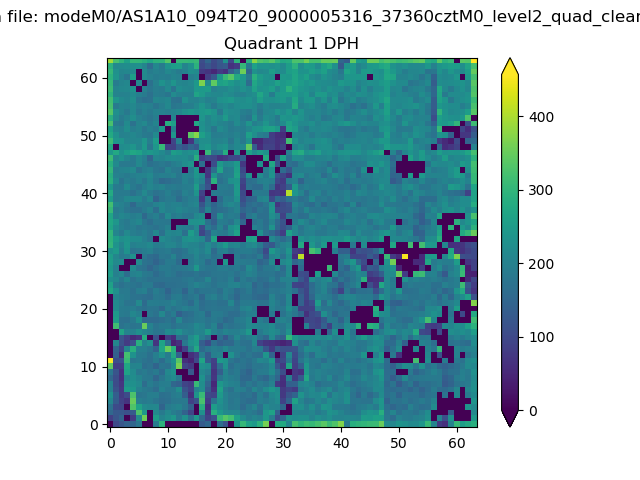 |
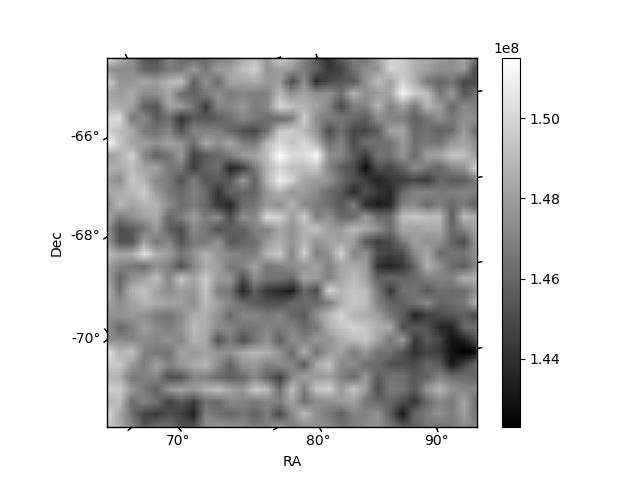
Quadrant B |
|---|---|---|---|
| Quadrant D | 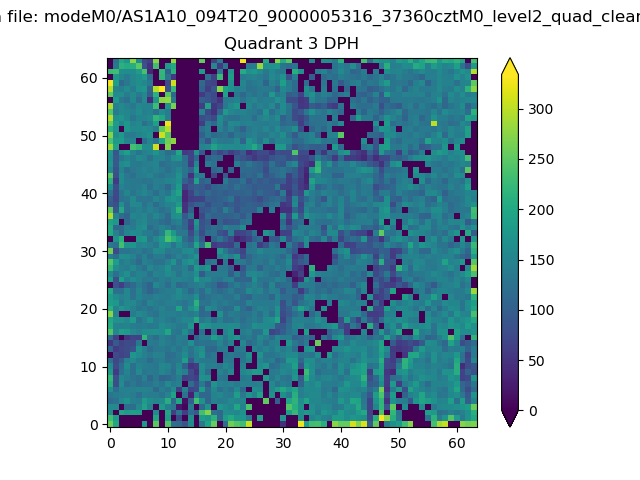 |
 |
Quadrant C |
| Plot type | Count rate plots | Images |
|---|---|---|
| Comparison with Poisson distribution Blue bars denote a histogram of data divided into 1 sec bins. Red curve is a Poisson curve with rate = median count rate of data. |
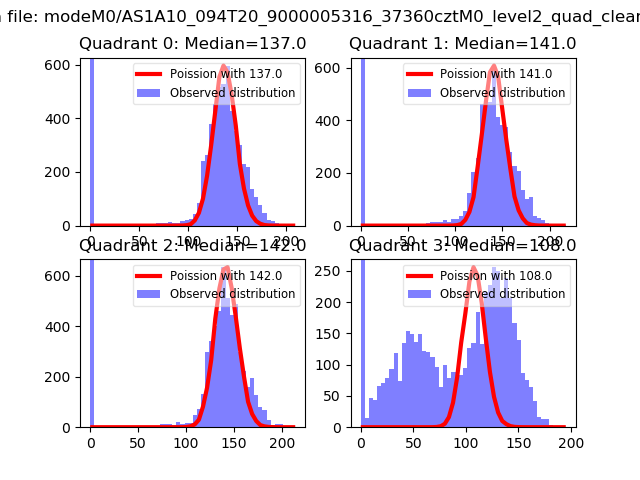 |
 |
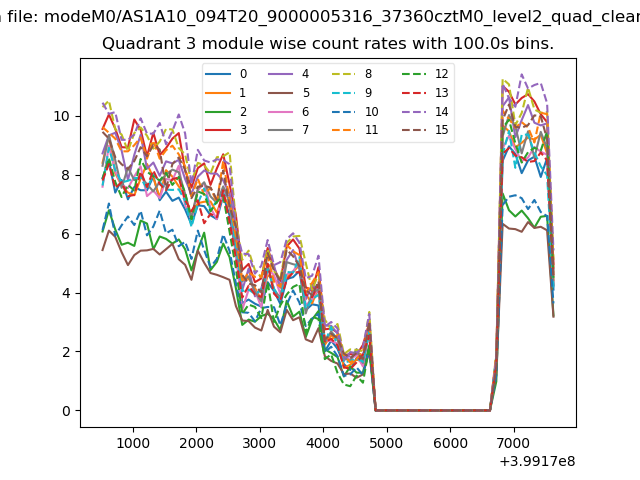
| Quadrant-wise count rates Data is divided into 100 sec bins |
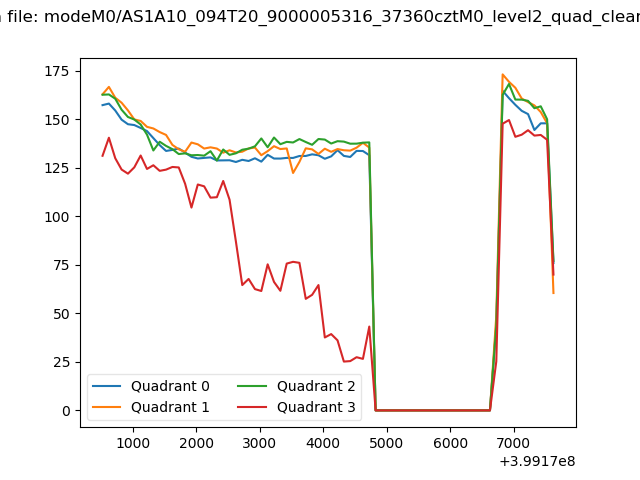 |
|
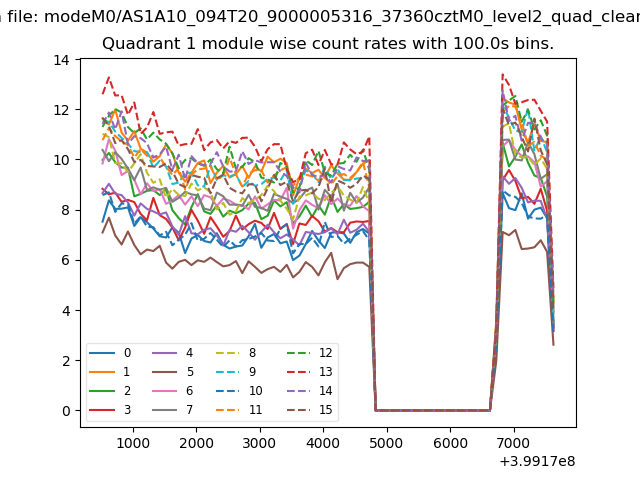
| Module-wise count rates for Quadrant A Data is divided into 100 sec bins |
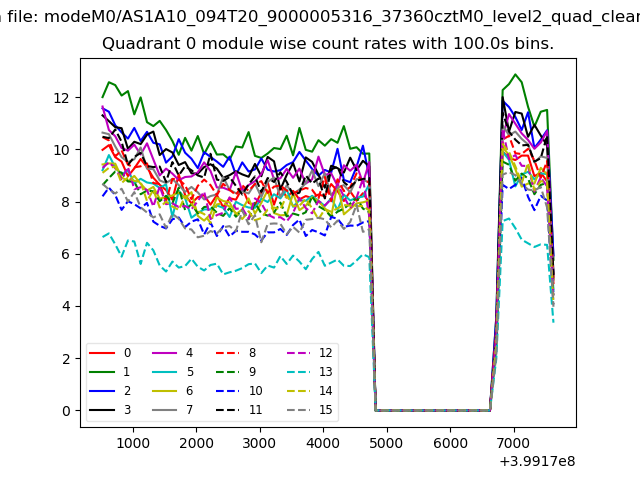 |
 |
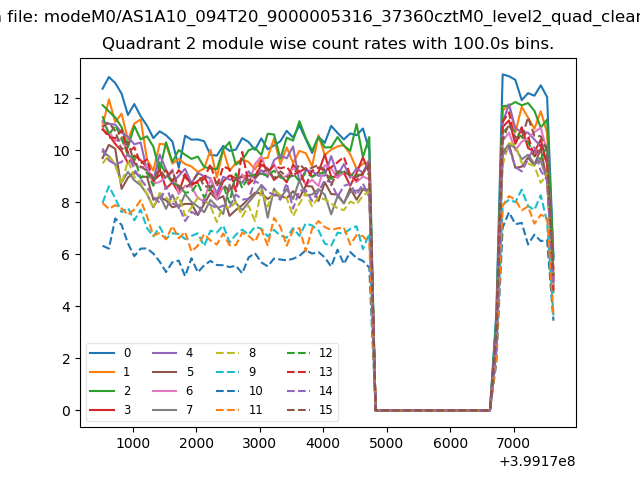
| Module-wise count rates for Quadrant B Data is divided into 100 sec bins |
 |
 |
| Module-wise count rates for Quadrant C Data is divided into 100 sec bins |
 |
 |
| Module-wise count rates for Quadrant D Data is divided into 100 sec bins |
 |
 |
| Parameter | Plot |
|---|---|
| CZT HV Monitor | 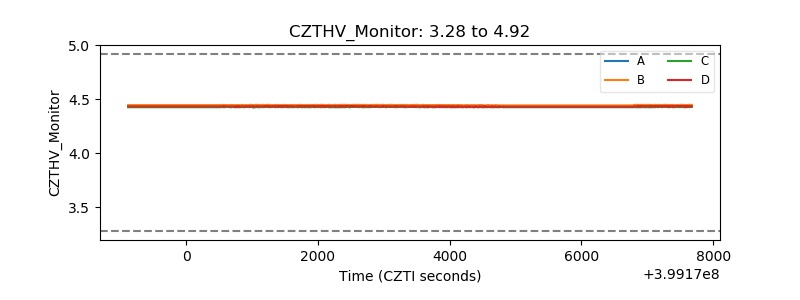 |
| D_VDD | 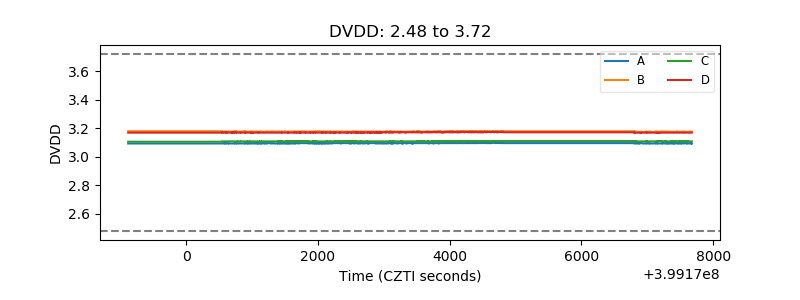 |
| Temperature 1 | 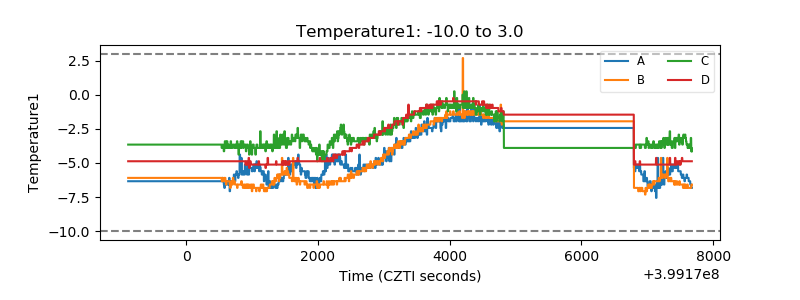 |
| Veto HV Monitor | 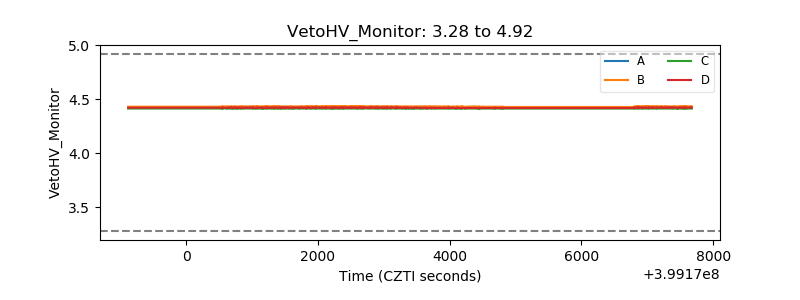 |
| Veto LLD | 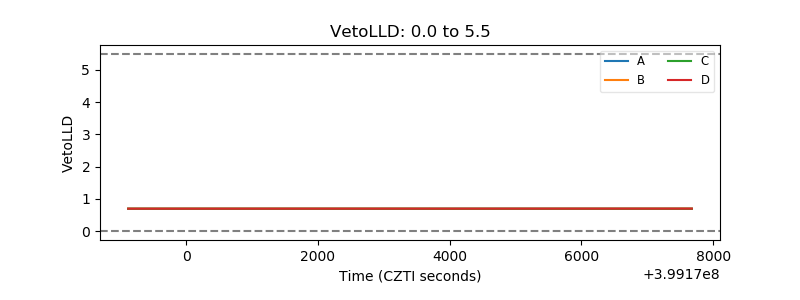 |
| Alpha Counter | 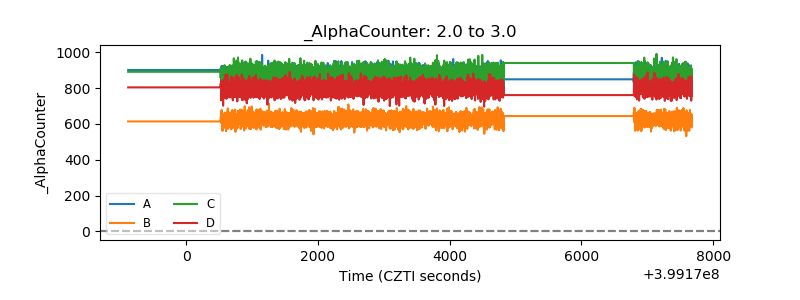 |
| _CPM_Rate | 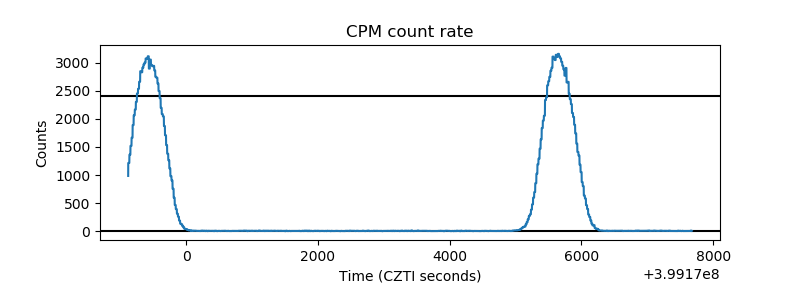 |
| CZT Counter | 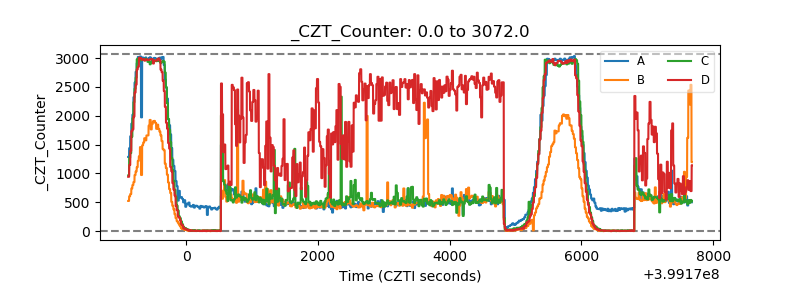 |
| +2.5 Volts monitor | 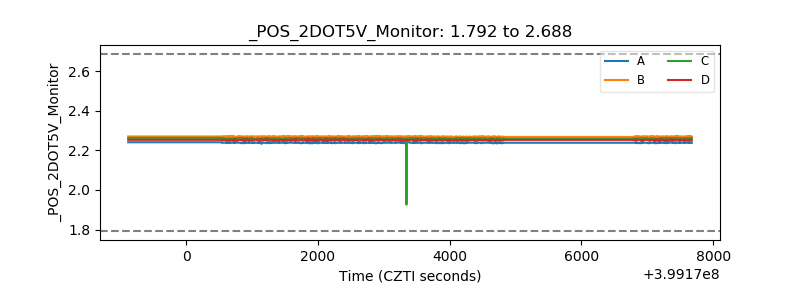 |
| +5 Volts monitor | 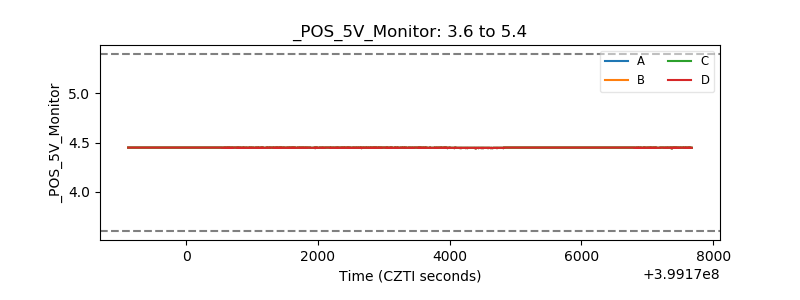 |
| _ROLL_ROT | 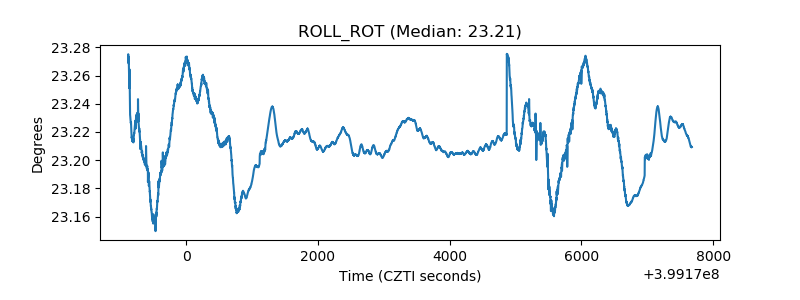 |
| _Roll_DEC | 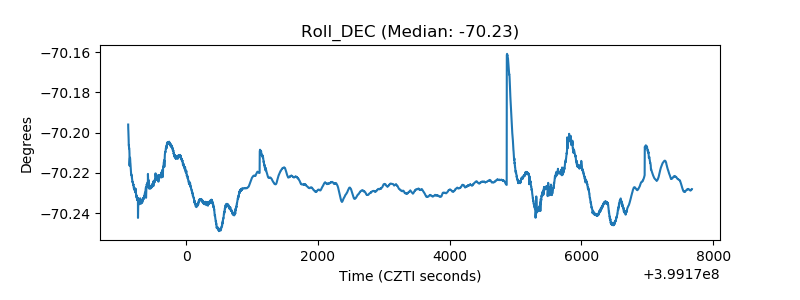 |
| _Roll_RA | 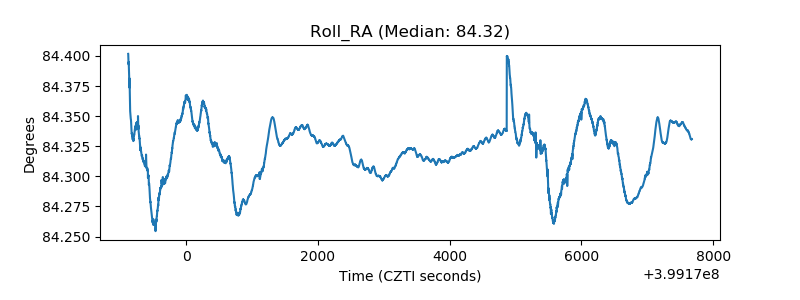 |
| Veto Counter | 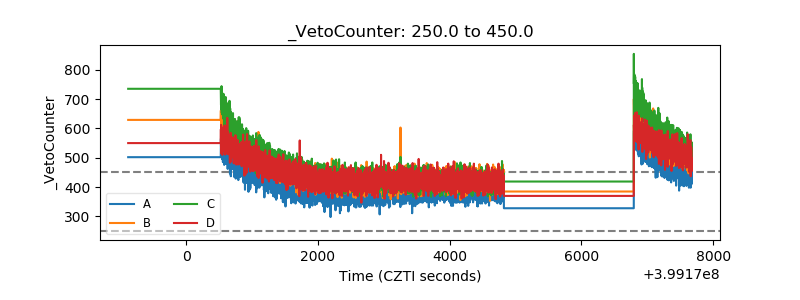 |