| Param | Original file | Final file |
|---|---|---|
| Filename | modeM0/AS1A10_094T20_9000005316_37362cztM0_level2.evt | modeM0/AS1A10_094T20_9000005316_37362cztM0_level2_quad_clean.evt |
| Size (bytes) | 537,612,480 | 99,527,040 |
| Size | 512.7 MB | 94.9 MB |
| Events in quadrant A | 2,597,291 | 682,144 |
| Events in quadrant B | 3,910,219 | 648,192 |
| Events in quadrant C | 3,928,546 | 698,102 |
| Events in quadrant D | 5,513,438 | 640,677 |
| Mode SS | |||
|---|---|---|---|
| Quadrant | BADHDUFLAG | Total packets | Discarded packets |
| A | 0 | 98 | 0 |
| B | 0 | 98 | 0 |
| C | 0 | 98 | 0 |
| D | 0 | 98 | 0 |
| Mode M0 | |||
|---|---|---|---|
| Quadrant | BADHDUFLAG | Total packets | Discarded packets |
| A | 0 | 10591 | 3 |
| B | 0 | 14695 | 2 |
| C | 0 | 14609 | 2 |
| D | 0 | 19843 | 2 |
| Mode M9 | |||
|---|---|---|---|
| Quadrant | BADHDUFLAG | Total packets | Discarded packets |
| A | 0 | 31 | 0 |
| B | 0 | 31 | 0 |
| C | 0 | 31 | 0 |
| D | 0 | 32 | 0 |
| Quadrant | Total seconds | Saturated seconds | Saturation percentage |
|---|---|---|---|
| A | 4920 | 16 | 0.325203% |
| B | 4920 | 611 | 12.418699% |
| C | 4920 | 235 | 4.776423% |
| D | 4920 | 434 | 8.821138% |
Noise dominated data is calculated using 1-second bins in cleaned event files. If a bin has >2000 counts, and if more than 50% of those come from <1% of pixels, then it is considered to be noise-dominated and hence unusable.
| Quadrant | # 1 sec bins | Bins with >0 counts | Bins with >2000 counts | High rate bins dominated by noise | Noise dominated (total time) | Noise dominated (detector-on time) | Marked lightcurve |
|---|---|---|---|---|---|---|---|
| A | 7043 | 4921 | 7 | 7 | 0.10% | 0.14% | 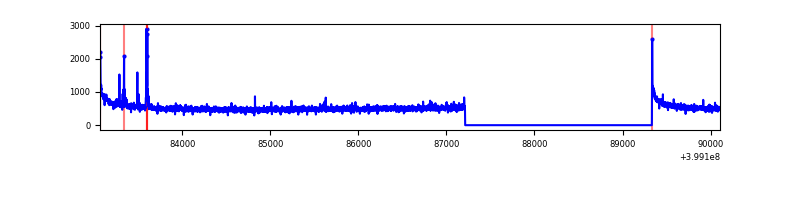 |
| B | 7043 | 4921 | 458 | 458 | 6.50% | 9.31% | 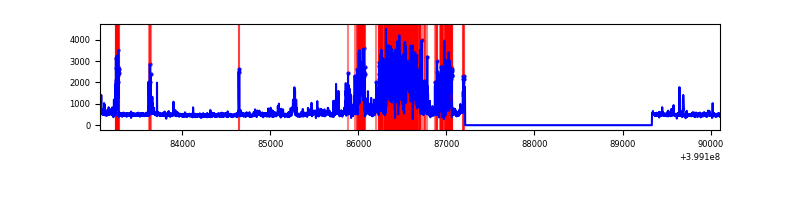 |
| C | 7043 | 4921 | 277 | 277 | 3.93% | 5.63% | 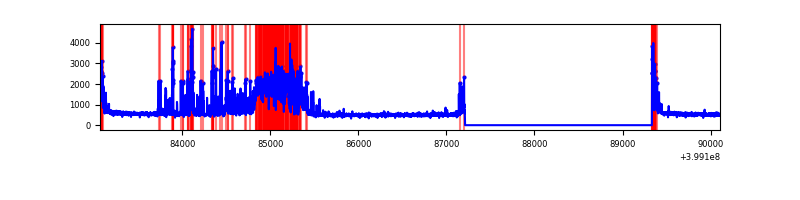 |
| D | 7043 | 4921 | 439 | 439 | 6.23% | 8.92% | 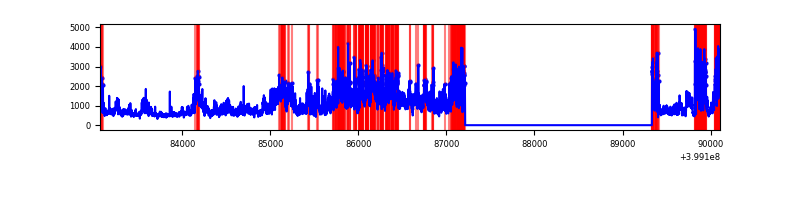 |
Top three noisy pixels from each quadrant. If the there are fewer than three noisy pixels in the level2.evt file, extra rows are filled as -1
| Pixel properties | Quadrant properties | ||||||
|---|---|---|---|---|---|---|---|
| Quadrant | DetID | PixID | Counts | Sigma | Mean | Median | Sigma |
| A | 10 | 83 | 266181 | 2248.74 | 588 | 576 | 118.1 |
| A | 9 | 143 | 38850 | 324.05 | 588 | 576 | 118.1 |
| A | 13 | 6 | 11182 | 89.8 | 588 | 576 | 118.1 |
| B | 5 | 255 | 1382538 | 13450.22 | 543 | 528 | 102.7 |
| B | 5 | 172 | 288036 | 2798.13 | 543 | 528 | 102.7 |
| B | 15 | 85 | 27218 | 259.75 | 543 | 528 | 102.7 |
| C | 15 | 208 | 1236570 | 9260.66 | 582 | 586 | 133.5 |
| C | 15 | 214 | 210552 | 1573.18 | 582 | 586 | 133.5 |
| C | 0 | 10 | 162420 | 1212.55 | 582 | 586 | 133.5 |
| D | 12 | 235 | 2727692 | 19597.42 | 574 | 558 | 139.2 |
| D | 10 | 253 | 300651 | 2156.49 | 574 | 558 | 139.2 |
| D | 1 | 47 | 48446 | 344.13 | 574 | 558 | 139.2 |
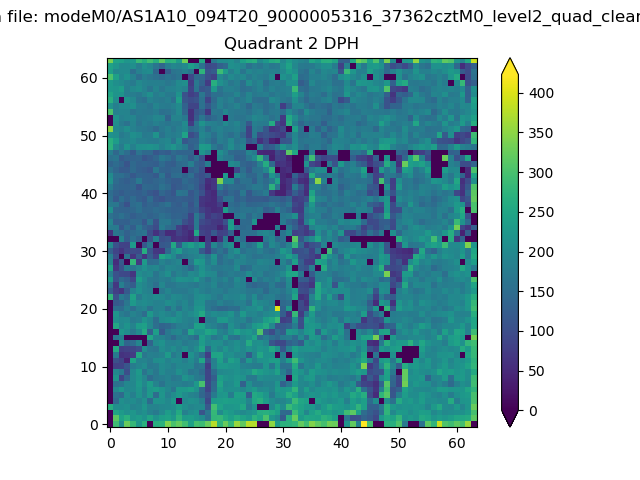
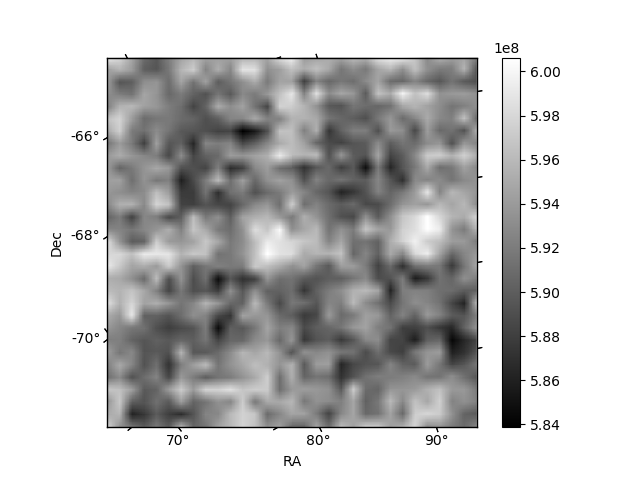
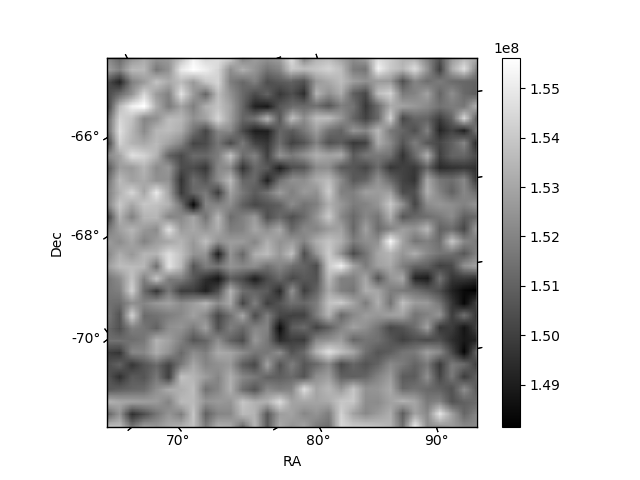
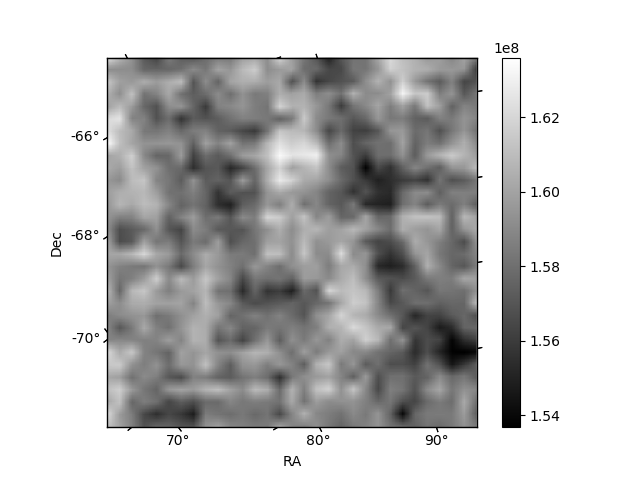
Histogram calculated using DETX and DETY for each event in the final _common_clean file
| Quadrant A | 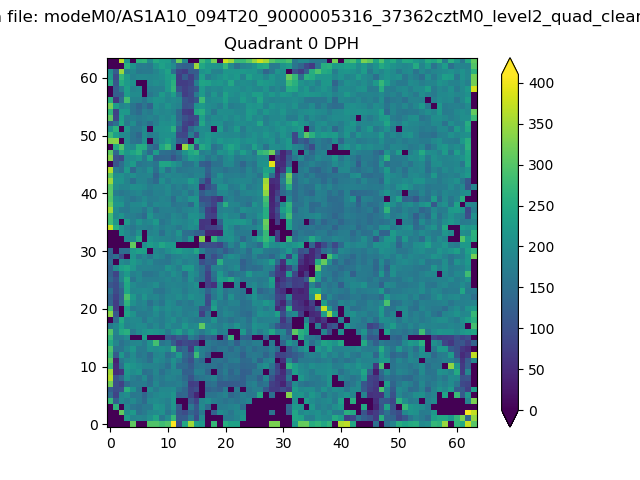 |
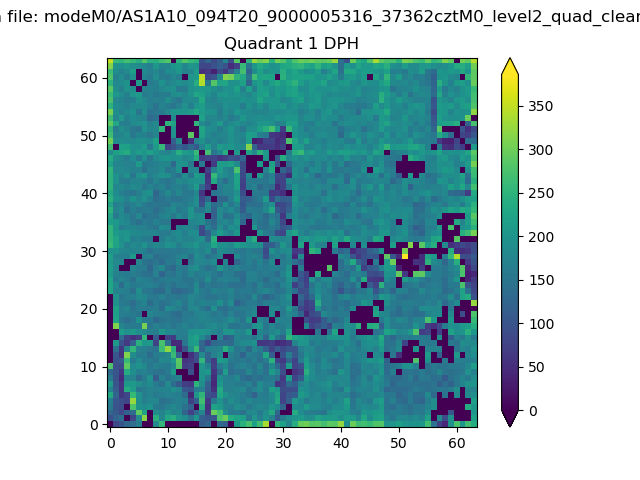 |
Quadrant B |
|---|---|---|---|
| Quadrant D | 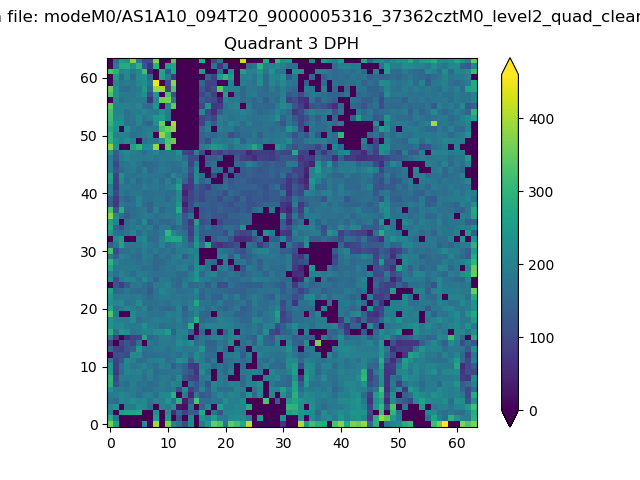 |
 |
Quadrant C |
| Plot type | Count rate plots | Images |
|---|---|---|
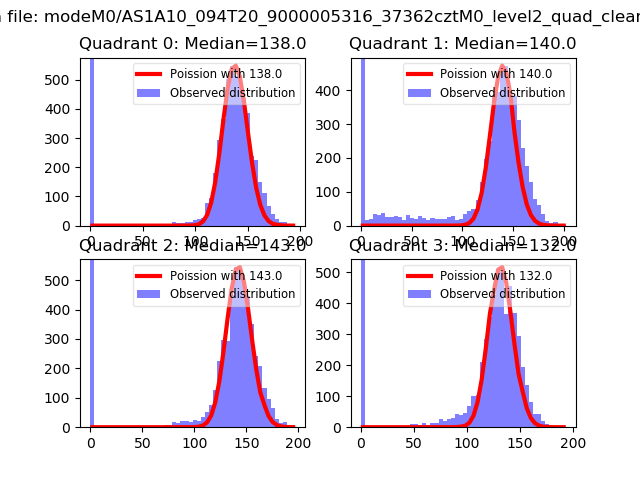
| Comparison with Poisson distribution Blue bars denote a histogram of data divided into 1 sec bins. Red curve is a Poisson curve with rate = median count rate of data. |
 |
 |
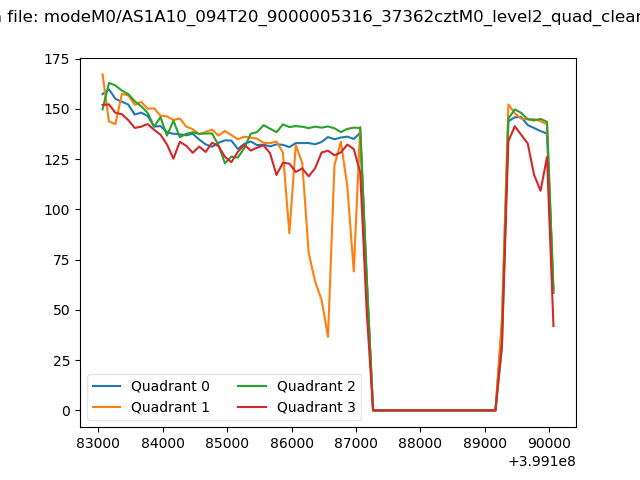
| Quadrant-wise count rates Data is divided into 100 sec bins |
 |
|
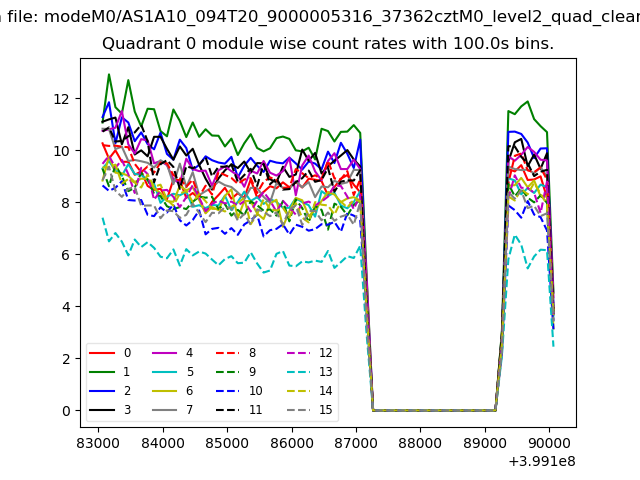
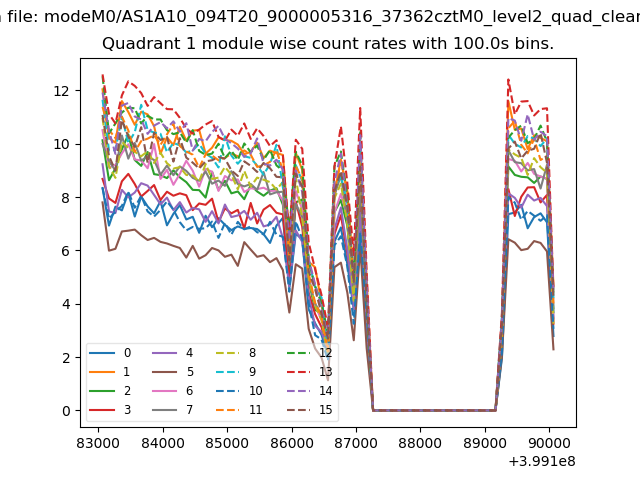
| Module-wise count rates for Quadrant A Data is divided into 100 sec bins |
 |
 |
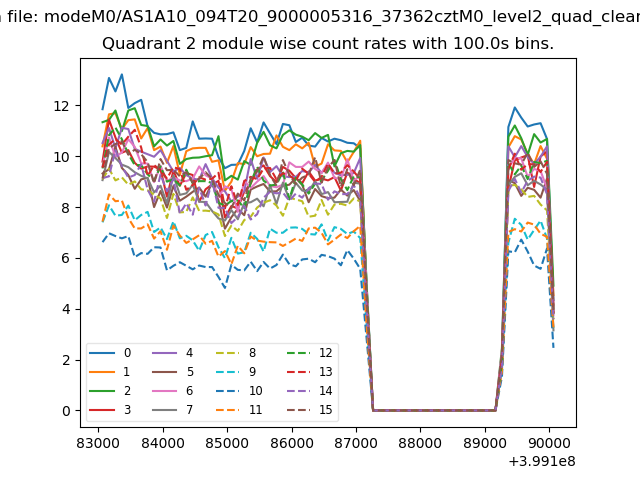
| Module-wise count rates for Quadrant B Data is divided into 100 sec bins |
 |
 |
| Module-wise count rates for Quadrant C Data is divided into 100 sec bins |
 |
 |
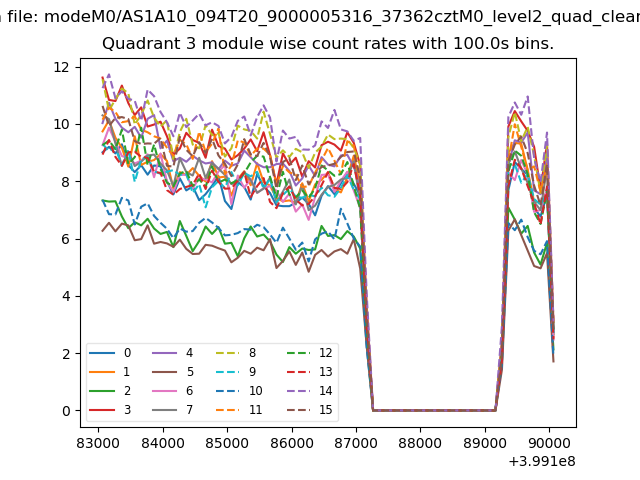
| Module-wise count rates for Quadrant D Data is divided into 100 sec bins |
 |
 |
| Parameter | Plot |
|---|---|
| CZT HV Monitor | 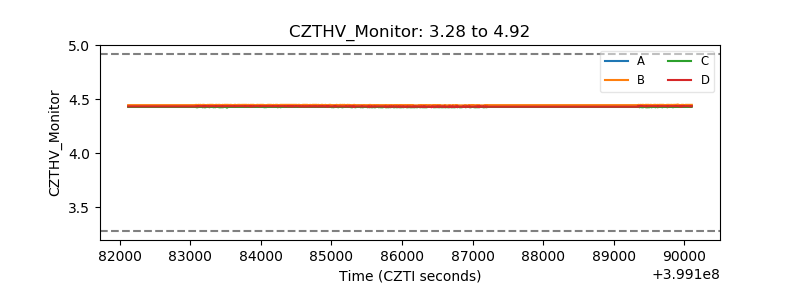 |
| D_VDD | 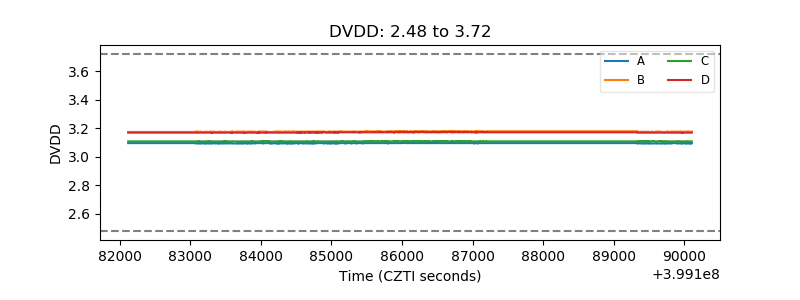 |
| Temperature 1 | 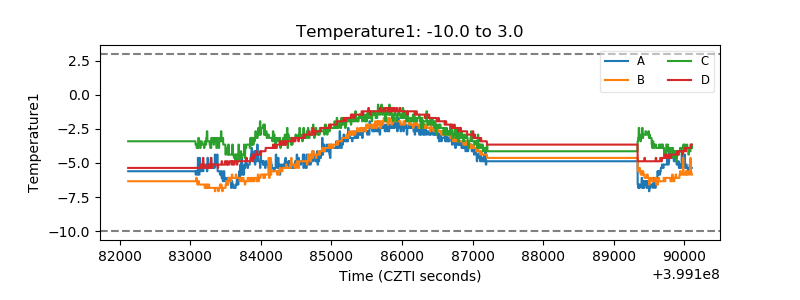 |
| Veto HV Monitor | 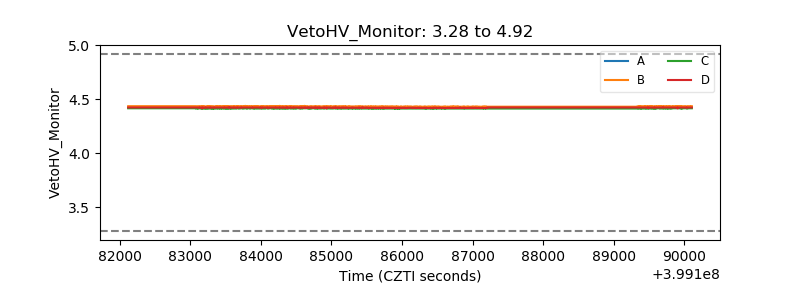 |
| Veto LLD | 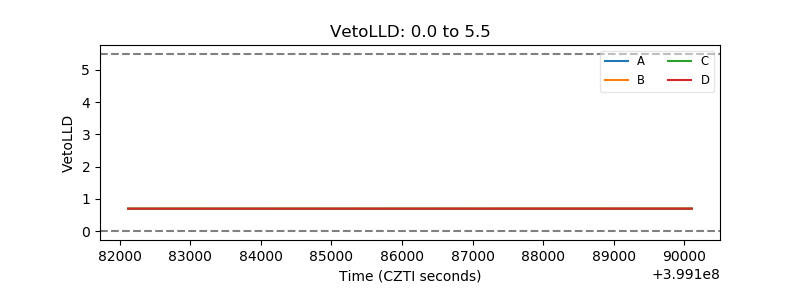 |
| Alpha Counter | 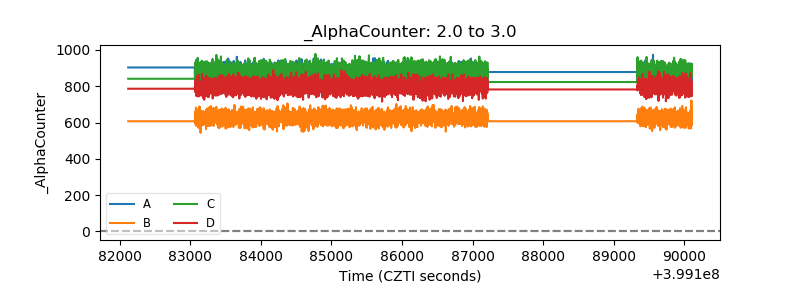 |
| _CPM_Rate | 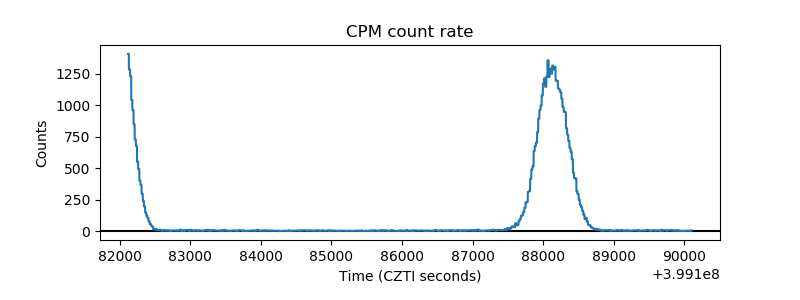 |
| CZT Counter | 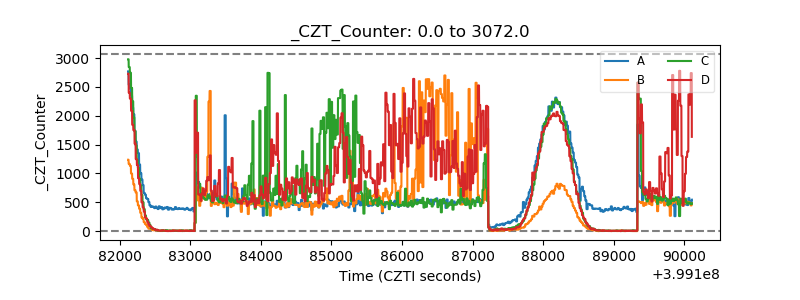 |
| +2.5 Volts monitor |  |
| +5 Volts monitor | 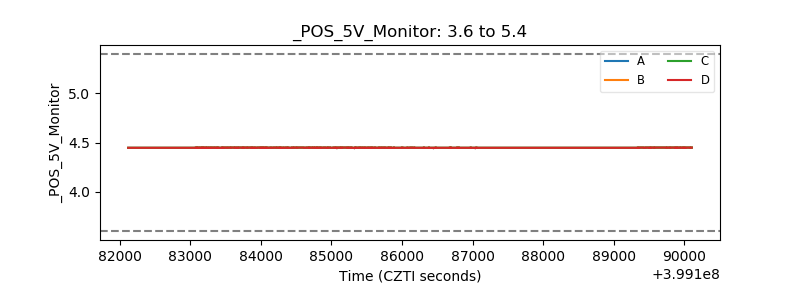 |
| _ROLL_ROT | 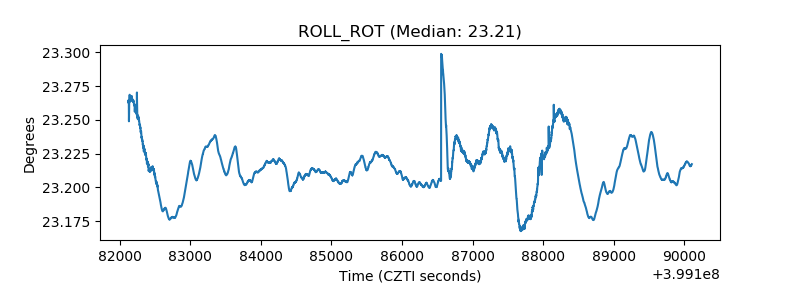 |
| _Roll_DEC | 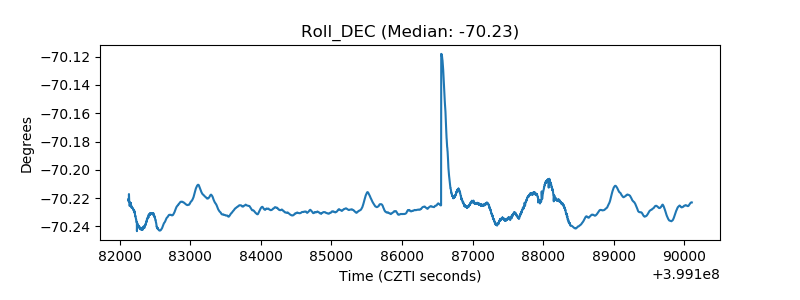 |
| _Roll_RA | 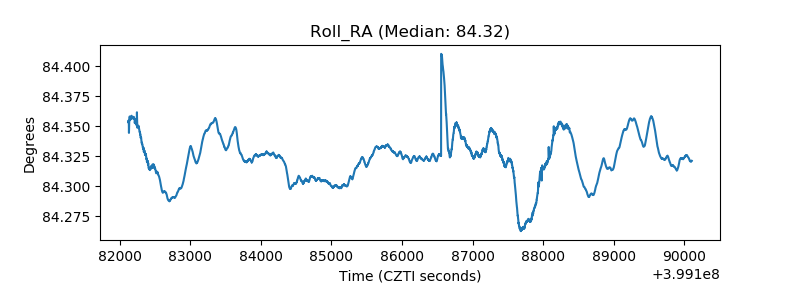 |
| Veto Counter | 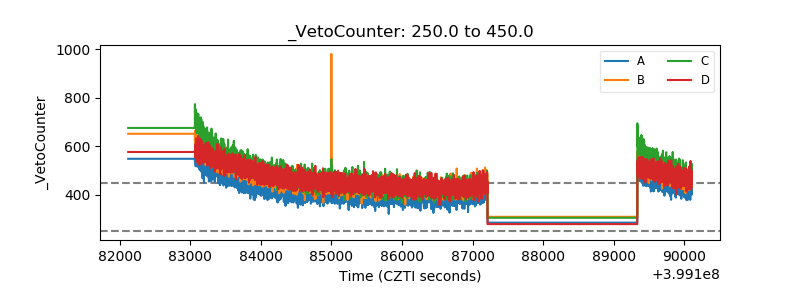 |