| Param | Original file | Final file |
|---|---|---|
| Filename | modeM0/AS1A10_094T20_9000005316_37363cztM0_level2.evt | modeM0/AS1A10_094T20_9000005316_37363cztM0_level2_quad_clean.evt |
| Size (bytes) | 439,390,080 | 72,437,760 |
| Size | 419.0 MB | 69.1 MB |
| Events in quadrant A | 1,969,639 | 496,717 |
| Events in quadrant B | 2,664,326 | 498,114 |
| Events in quadrant C | 2,027,821 | 520,437 |
| Events in quadrant D | 6,389,498 | 411,469 |
| Mode SS | |||
|---|---|---|---|
| Quadrant | BADHDUFLAG | Total packets | Discarded packets |
| A | 0 | 74 | 0 |
| B | 0 | 74 | 0 |
| C | 0 | 74 | 0 |
| D | 0 | 74 | 0 |
| Mode M0 | |||
|---|---|---|---|
| Quadrant | BADHDUFLAG | Total packets | Discarded packets |
| A | 0 | 8153 | 1 |
| B | 0 | 10361 | 1 |
| C | 0 | 8176 | 1 |
| D | 0 | 21597 | 1 |
| Mode M9 | |||
|---|---|---|---|
| Quadrant | BADHDUFLAG | Total packets | Discarded packets |
| A | 0 | 1 | 0 |
| B | 0 | 1 | 0 |
| C | 0 | 1 | 0 |
| D | 0 | 2 | 0 |
| Quadrant | Total seconds | Saturated seconds | Saturation percentage |
|---|---|---|---|
| A | 3771 | 19 | 0.503845% |
| B | 3771 | 175 | 4.640679% |
| C | 3771 | 56 | 1.485017% |
| D | 3771 | 1415 | 37.523203% |
Noise dominated data is calculated using 1-second bins in cleaned event files. If a bin has >2000 counts, and if more than 50% of those come from <1% of pixels, then it is considered to be noise-dominated and hence unusable.
| Quadrant | # 1 sec bins | Bins with >0 counts | Bins with >2000 counts | High rate bins dominated by noise | Noise dominated (total time) | Noise dominated (detector-on time) | Marked lightcurve |
|---|---|---|---|---|---|---|---|
| A | 3771 | 3771 | 11 | 11 | 0.29% | 0.29% | 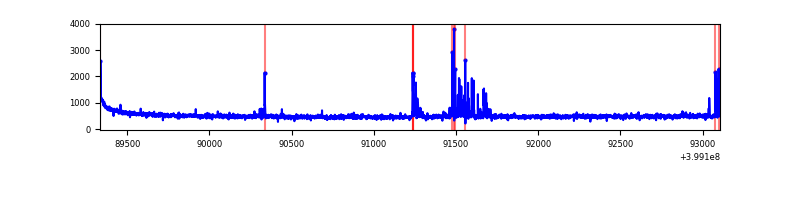 |
| B | 3771 | 3771 | 135 | 135 | 3.58% | 3.58% | 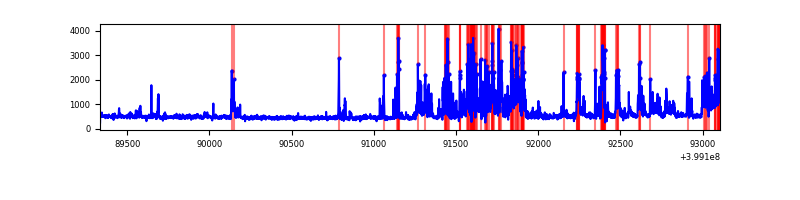 |
| C | 3771 | 3771 | 41 | 41 | 1.09% | 1.09% | 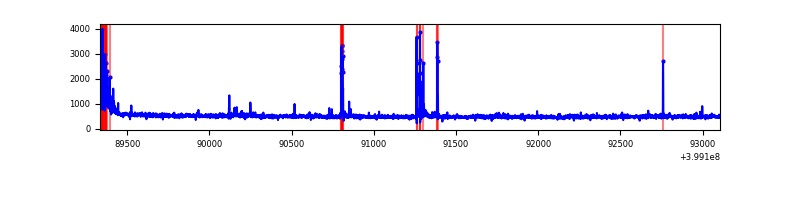 |
| D | 3771 | 3771 | 1398 | 1398 | 37.07% | 37.07% | 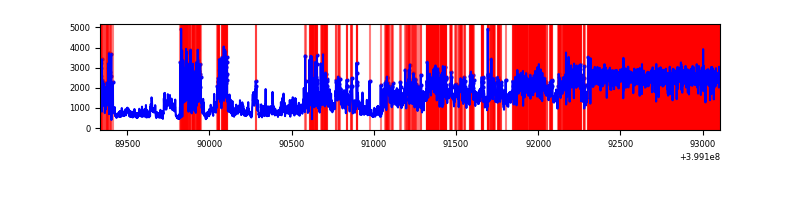 |
Top three noisy pixels from each quadrant. If the there are fewer than three noisy pixels in the level2.evt file, extra rows are filled as -1
| Pixel properties | Quadrant properties | ||||||
|---|---|---|---|---|---|---|---|
| Quadrant | DetID | PixID | Counts | Sigma | Mean | Median | Sigma |
| A | 10 | 83 | 171155 | 1950.88 | 434 | 426 | 87.5 |
| A | 13 | 248 | 98935 | 1125.64 | 434 | 426 | 87.5 |
| A | 9 | 143 | 16860 | 187.79 | 434 | 426 | 87.5 |
| B | 5 | 255 | 843453 | 10551.3 | 423 | 413 | 79.9 |
| B | 15 | 85 | 62111 | 772.2 | 423 | 413 | 79.9 |
| B | 0 | 213 | 36760 | 454.91 | 423 | 413 | 79.9 |
| C | 15 | 214 | 159073 | 1597.65 | 430 | 433 | 99.3 |
| C | 0 | 10 | 89733 | 899.33 | 430 | 433 | 99.3 |
| C | 15 | 208 | 43063 | 429.32 | 430 | 433 | 99.3 |
| D | 12 | 235 | 4154440 | 44493.1 | 381 | 371 | 93.4 |
| D | 10 | 253 | 441060 | 4720.1 | 381 | 371 | 93.4 |
| D | 2 | 249 | 141899 | 1515.87 | 381 | 371 | 93.4 |
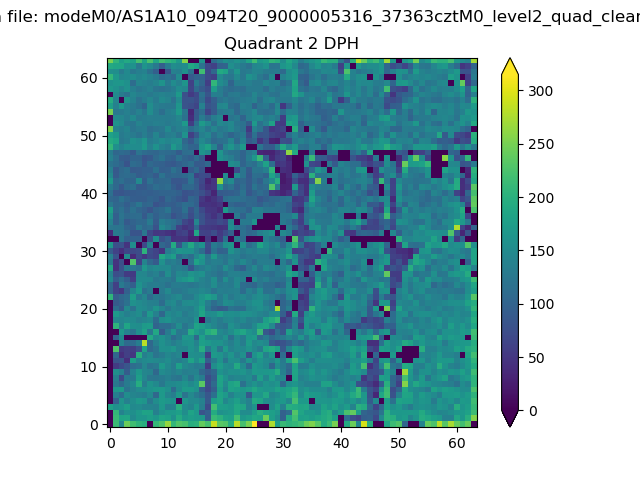
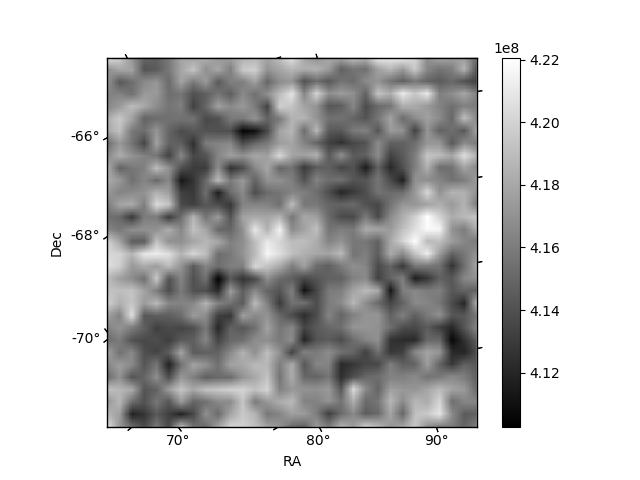
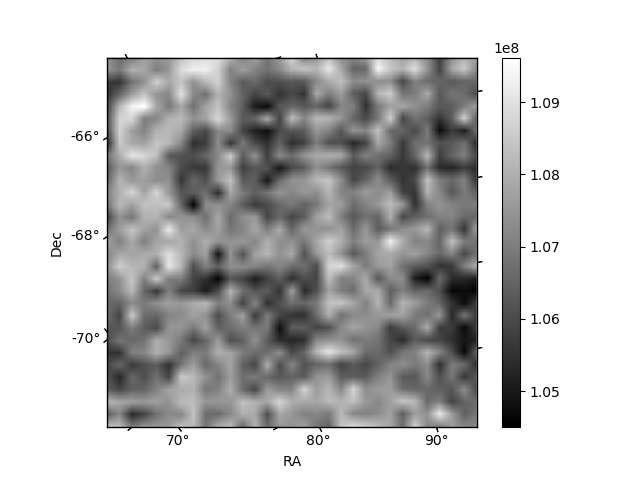
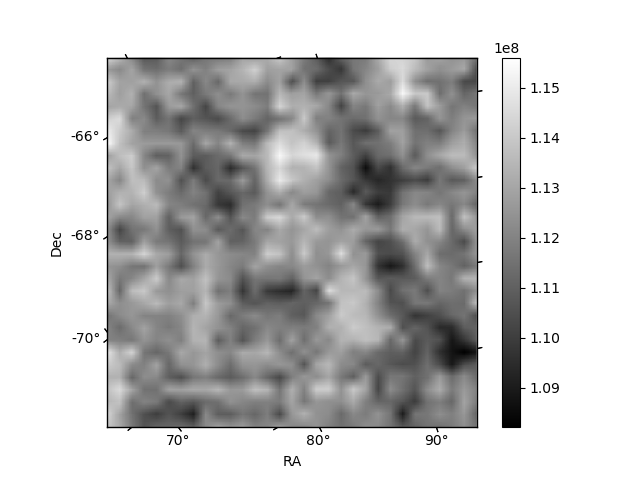
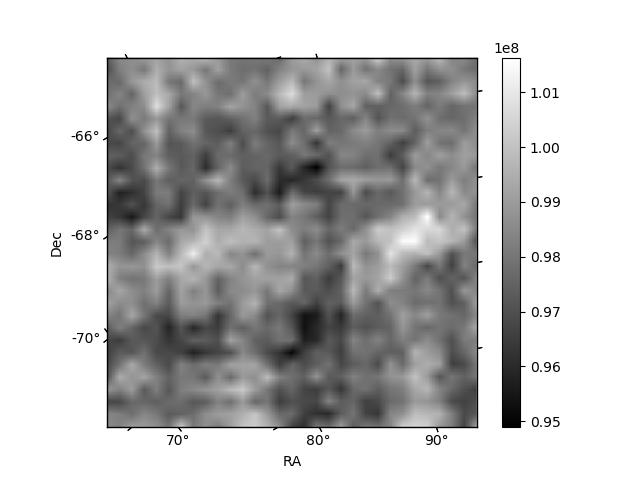
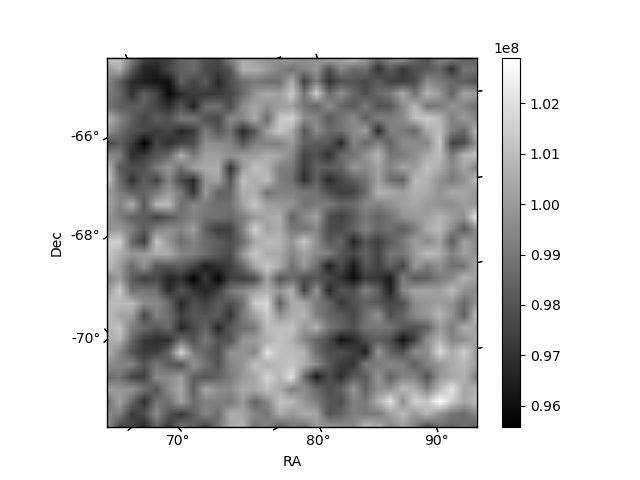
Histogram calculated using DETX and DETY for each event in the final _common_clean file
| Quadrant A | 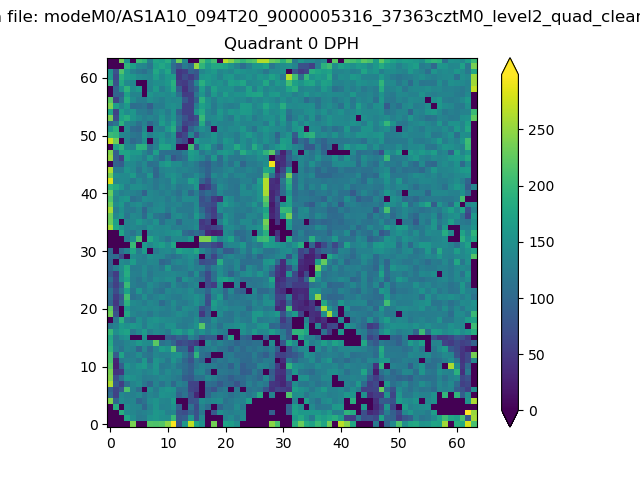 |
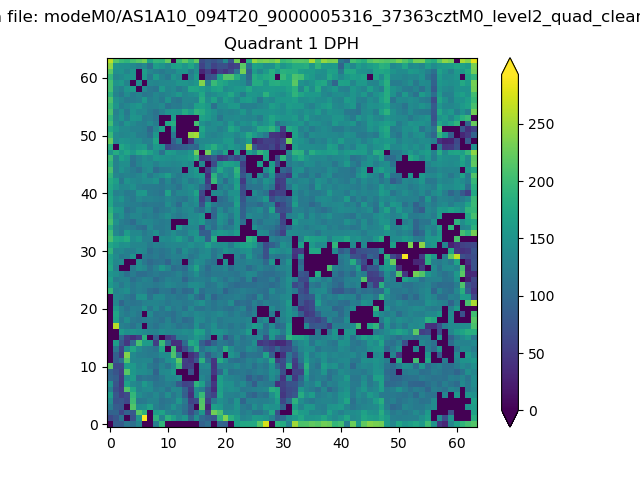 |
Quadrant B |
|---|---|---|---|
| Quadrant D | 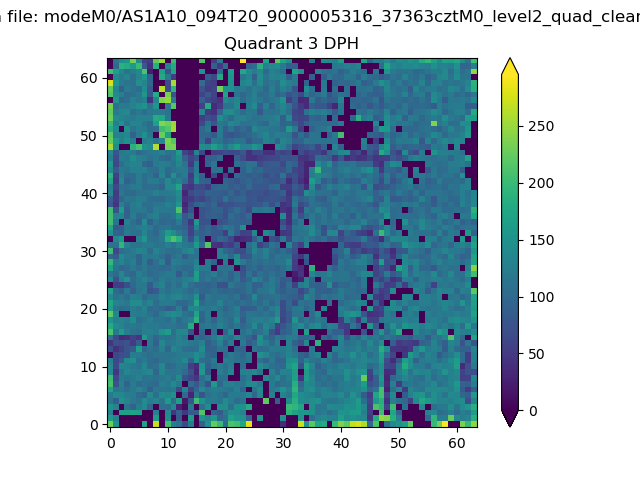 |
 |
Quadrant C |
| Plot type | Count rate plots | Images |
|---|---|---|
| Comparison with Poisson distribution Blue bars denote a histogram of data divided into 1 sec bins. Red curve is a Poisson curve with rate = median count rate of data. |
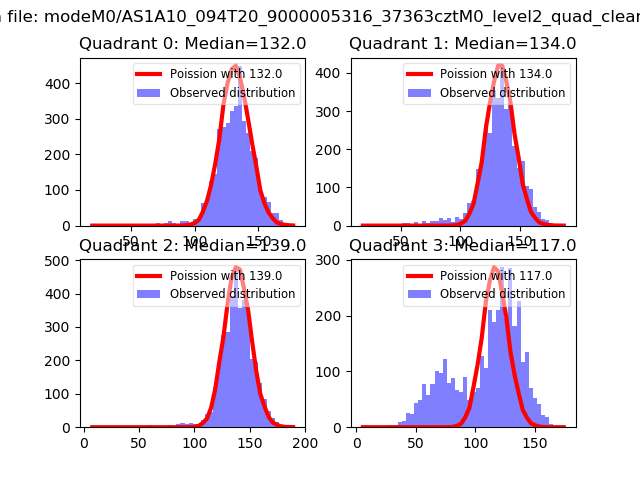 |
 |
| Quadrant-wise count rates Data is divided into 100 sec bins |
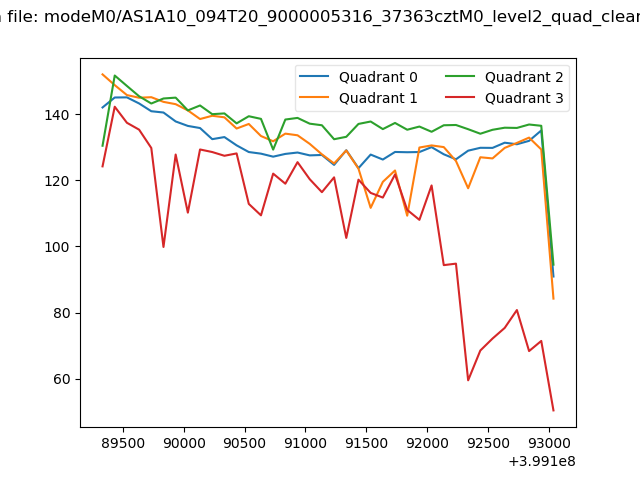 |
|
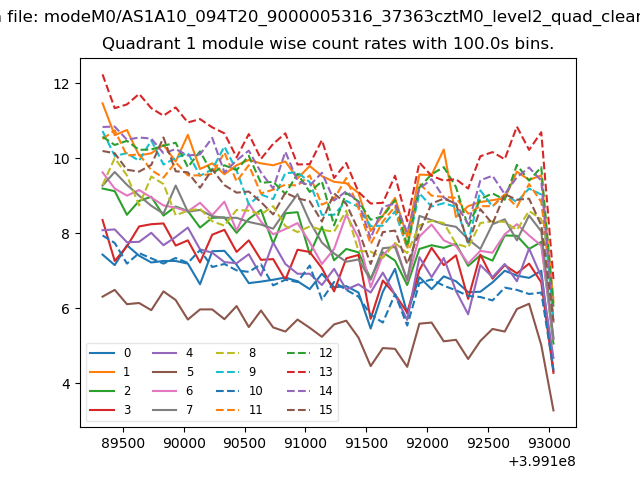
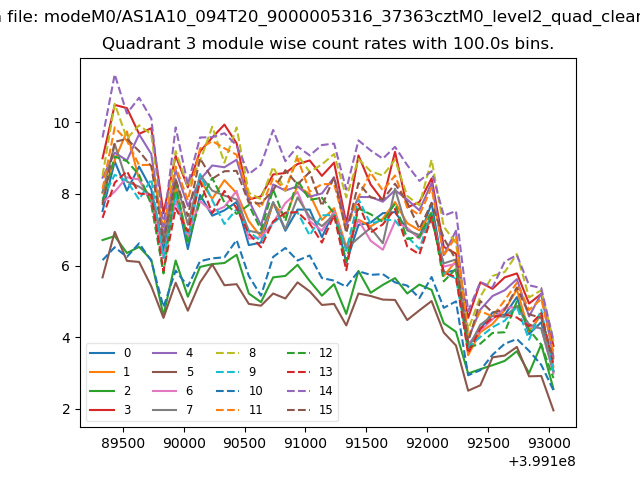
| Module-wise count rates for Quadrant A Data is divided into 100 sec bins |
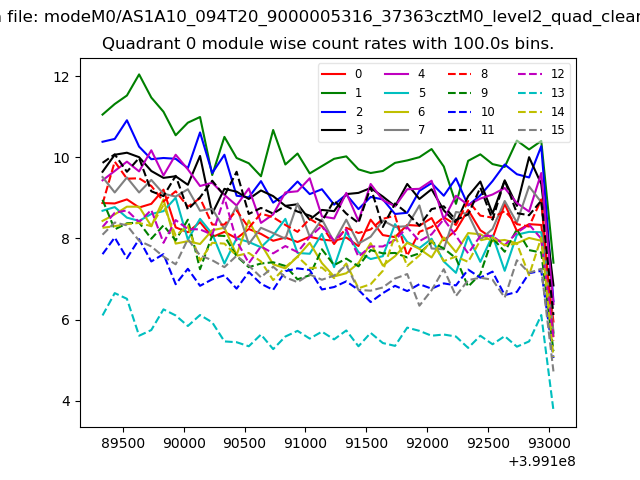 |
 |
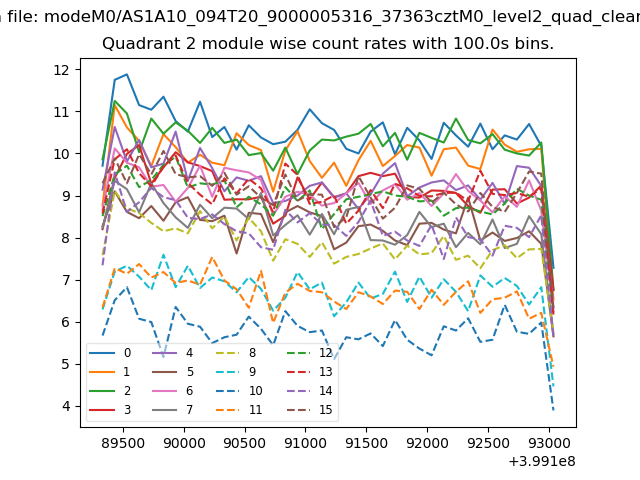
| Module-wise count rates for Quadrant B Data is divided into 100 sec bins |
 |
 |
| Module-wise count rates for Quadrant C Data is divided into 100 sec bins |
 |
 |
| Module-wise count rates for Quadrant D Data is divided into 100 sec bins |
 |
 |
| Parameter | Plot |
|---|---|
| CZT HV Monitor | 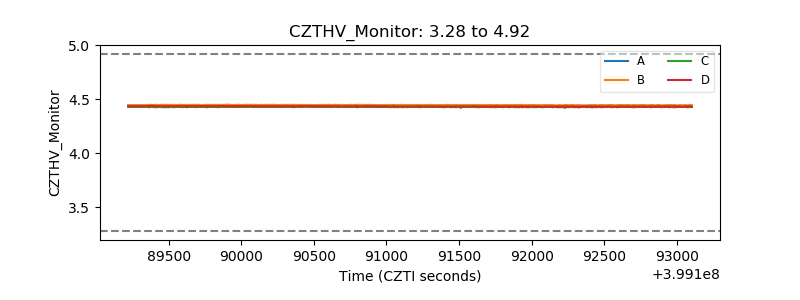 |
| D_VDD | 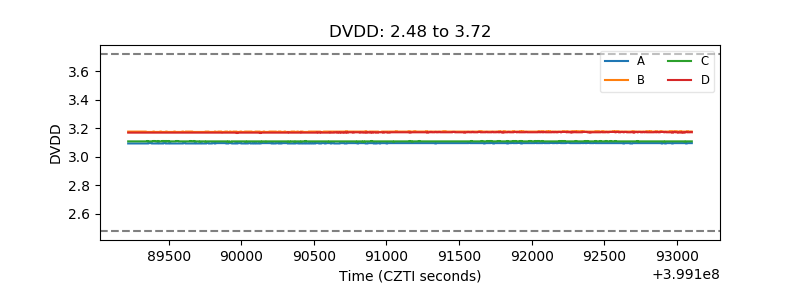 |
| Temperature 1 | 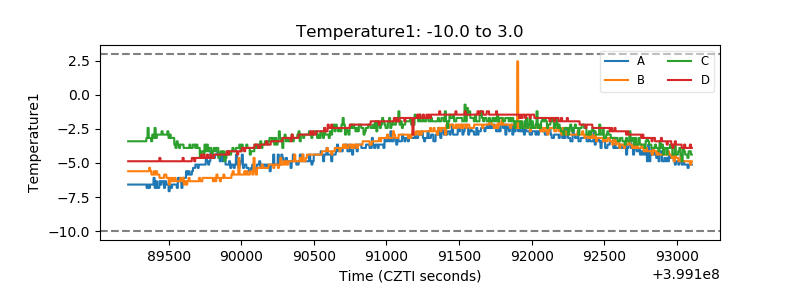 |
| Veto HV Monitor | 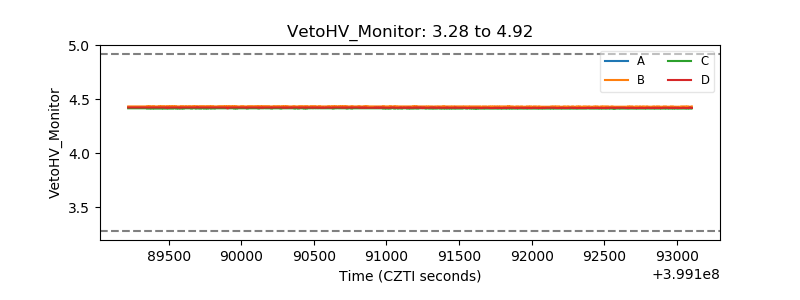 |
| Veto LLD | 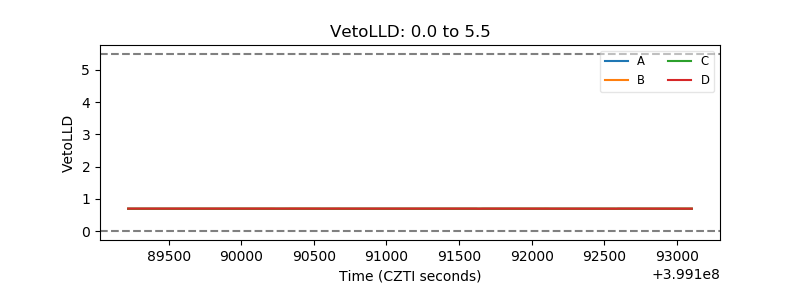 |
| Alpha Counter | 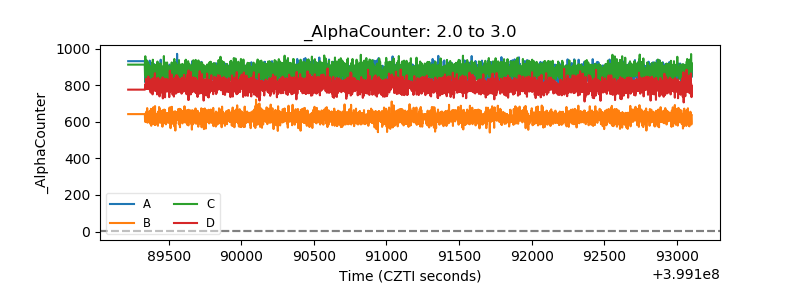 |
| _CPM_Rate | 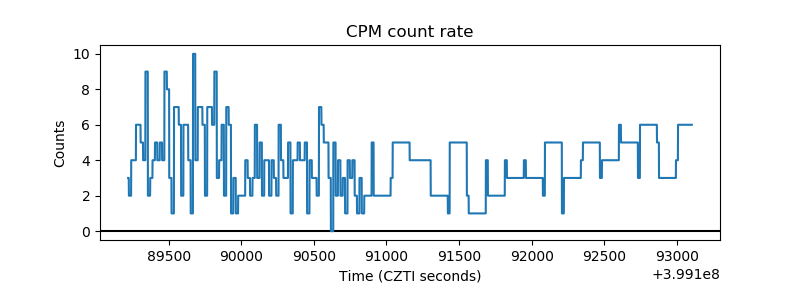 |
| CZT Counter | 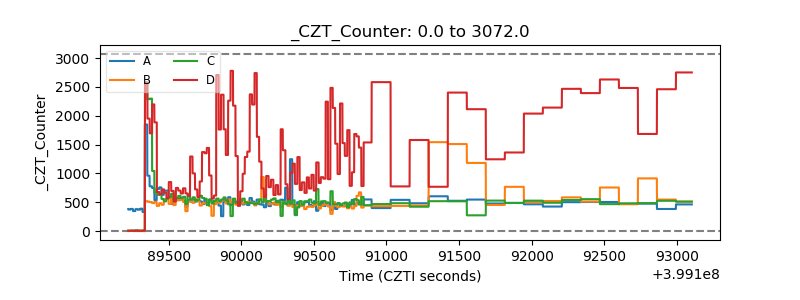 |
| +2.5 Volts monitor | 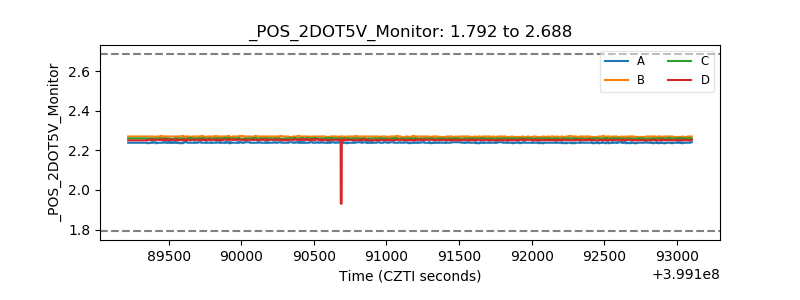 |
| +5 Volts monitor | 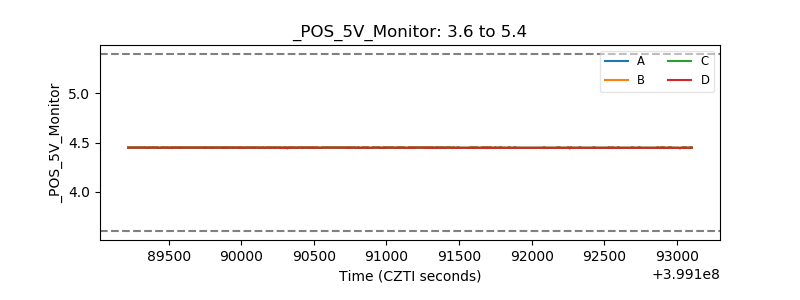 |
| _ROLL_ROT | 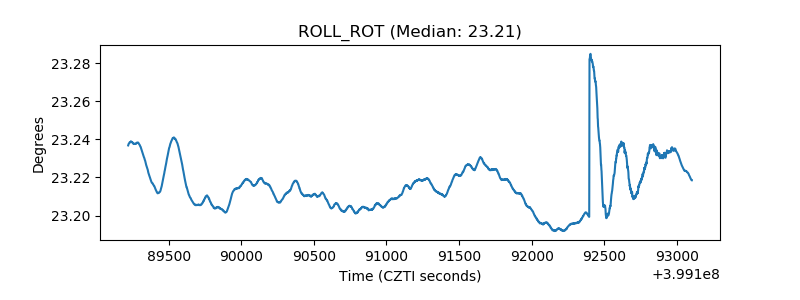 |
| _Roll_DEC | 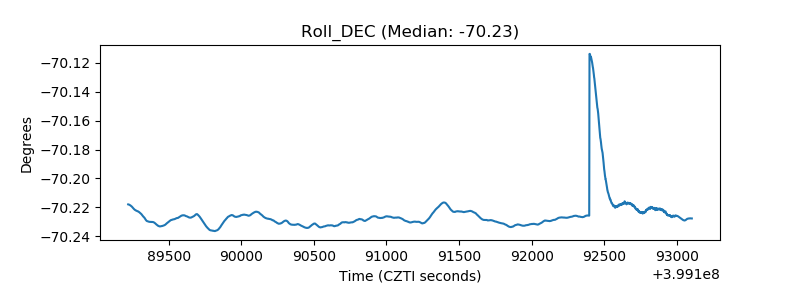 |
| _Roll_RA | 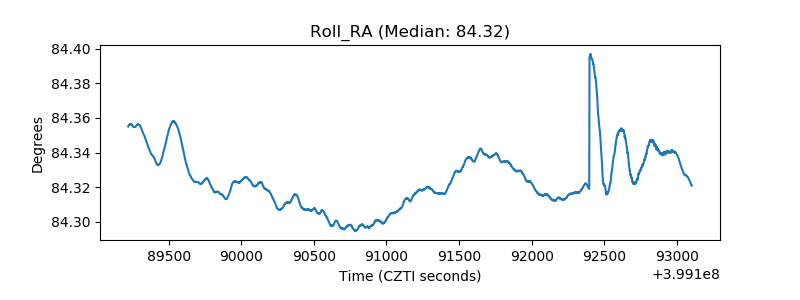 |
| Veto Counter | 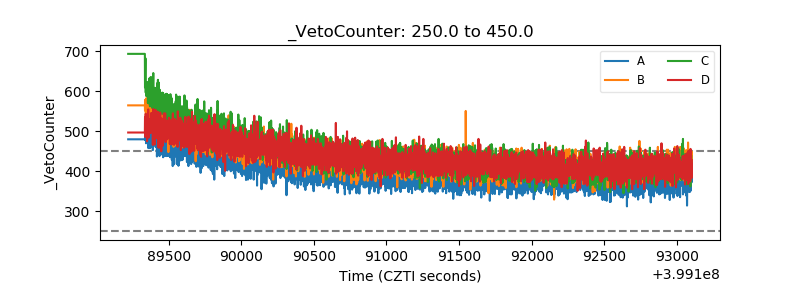 |