| Param | Original file | Final file |
|---|---|---|
| Filename | modeM0/AS1T05_048T01_9000005318cztM0_level2.fits | modeM0/AS1T05_048T01_9000005318cztM0_level2_quad_clean.evt |
| Size (bytes) | 735,828,480 | 748,632,960 |
| Size | 701.7 MB | 714.0 MB |
| Events in quadrant A | 4,549,642 | 4,864,457 |
| Events in quadrant B | 4,307,590 | 4,815,797 |
| Events in quadrant C | 4,489,770 | 4,760,991 |
| Events in quadrant D | 3,433,076 | 2,735,861 |
| Mode M0 | |||
|---|---|---|---|
| Quadrant | BADHDUFLAG | Total packets | Discarded packets |
| A | 0 | 168954 | 0 |
| B | 0 | 191195 | 0 |
| C | 0 | 175798 | 0 |
| D | 0 | 400647 | 0 |
| Mode SS | |||
|---|---|---|---|
| Quadrant | BADHDUFLAG | Total packets | Discarded packets |
| A | 0 | 1640 | 0 |
| B | 0 | 1640 | 0 |
| C | 0 | 1640 | 0 |
| D | 0 | 1640 | 0 |
| Mode M9 | |||
|---|---|---|---|
| Quadrant | BADHDUFLAG | Total packets | Discarded packets |
| A | 0 | 302 | 0 |
| B | 0 | 302 | 0 |
| C | 0 | 302 | 0 |
| D | 0 | 302 | 0 |
| Quadrant | Total seconds | Saturated seconds | Saturation percentage |
|---|---|---|---|
| A | 80122 | 202 | 0.252116% |
| B | 80124 | 2553 | 3.186311% |
| C | 80121 | 841 | 1.049662% |
| D | 80125 | 21284 | 26.563495% |
Noise dominated data is calculated using 1-second bins in cleaned event files. If a bin has >2000 counts, and if more than 50% of those come from <1% of pixels, then it is considered to be noise-dominated and hence unusable.
| Quadrant | # 1 sec bins | Bins with >0 counts | Bins with >2000 counts | High rate bins dominated by noise | Noise dominated (total time) | Noise dominated (detector-on time) | Marked lightcurve |
|---|---|---|---|---|---|---|---|
| A | 108896 | 80126 | 0 | 0 | 0.00% | 0.00% |  |
| B | 108896 | 80076 | 0 | 0 | 0.00% | 0.00% | 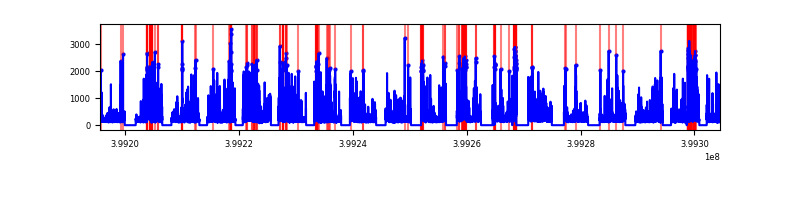 |
| C | 108896 | 80117 | 0 | 0 | 0.00% | 0.00% |  |
| D | 108896 | 80069 | 0 | 0 | 0.00% | 0.00% |  |
Top three noisy pixels from each quadrant. If the there are fewer than three noisy pixels in the level2.evt file, extra rows are filled as -1
| Pixel properties | Quadrant properties | ||||||
|---|---|---|---|---|---|---|---|
| Quadrant | DetID | PixID | Counts | Sigma | Mean | Median | Sigma |
| A | 7 | 110 | 3855 | 9.32 | 1188 | 1116 | 293.8 |
| A | 9 | 19 | 3615 | 8.5 | 1188 | 1116 | 293.8 |
| A | 0 | 29 | 3564 | 8.33 | 1188 | 1116 | 293.8 |
| B | 2 | 9 | 3648 | 11.32 | 1144 | 1095 | 225.5 |
| B | 3 | 80 | 3316 | 9.85 | 1144 | 1095 | 225.5 |
| B | 5 | 128 | 3076 | 8.79 | 1144 | 1095 | 225.5 |
| C | 3 | 203 | 3745 | 8.65 | 1187 | 1114 | 304.2 |
| C | 3 | 202 | 3684 | 8.45 | 1187 | 1114 | 304.2 |
| C | 1 | 81 | 3641 | 8.31 | 1187 | 1114 | 304.2 |
| D | 7 | 3 | 2620 | 6.53 | 983 | 897 | 264.0 |
| D | 10 | 189 | 2548 | 6.25 | 983 | 897 | 264.0 |
| D | 4 | 160 | 2528 | 6.18 | 983 | 897 | 264.0 |
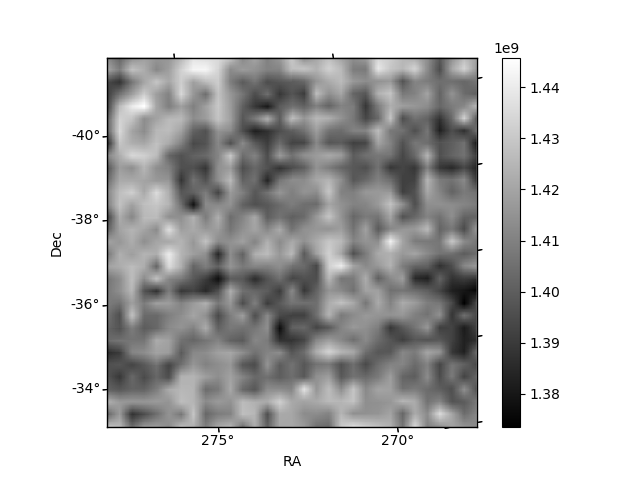
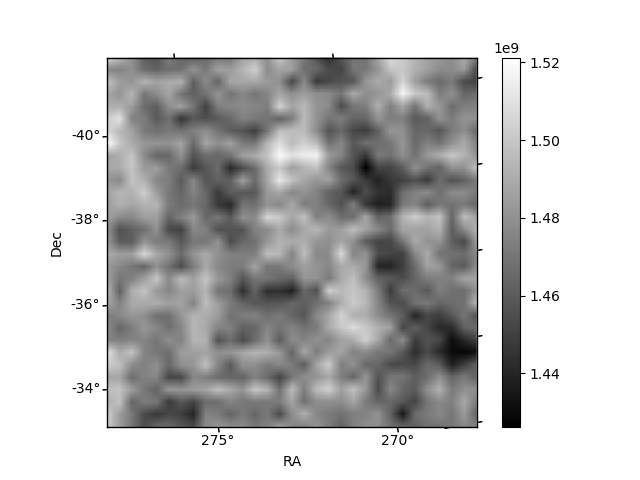
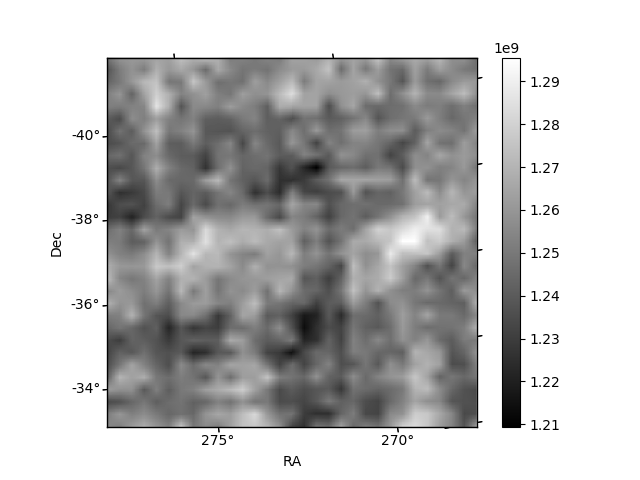
Histogram calculated using DETX and DETY for each event in the final _common_clean file
| Quadrant A |  |
 |
Quadrant B |
|---|---|---|---|
| Quadrant D |  |
 |
Quadrant C |
| Plot type | Count rate plots | Images |
|---|---|---|
| Comparison with Poisson distribution Blue bars denote a histogram of data divided into 1 sec bins. Red curve is a Poisson curve with rate = median count rate of data. |
 |
 |
| Quadrant-wise count rates Data is divided into 100 sec bins |
 |
|
| Module-wise count rates for Quadrant A Data is divided into 100 sec bins |
 |
 |
| Module-wise count rates for Quadrant B Data is divided into 100 sec bins |
 |
 |
| Module-wise count rates for Quadrant C Data is divided into 100 sec bins |
 |
 |
| Module-wise count rates for Quadrant D Data is divided into 100 sec bins |
 |
 |
| Parameter | Plot |
|---|---|
| CZT HV Monitor |  |
| D_VDD | 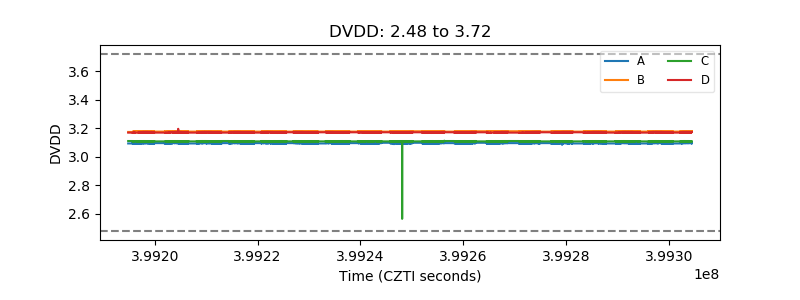 |
| Temperature 1 | 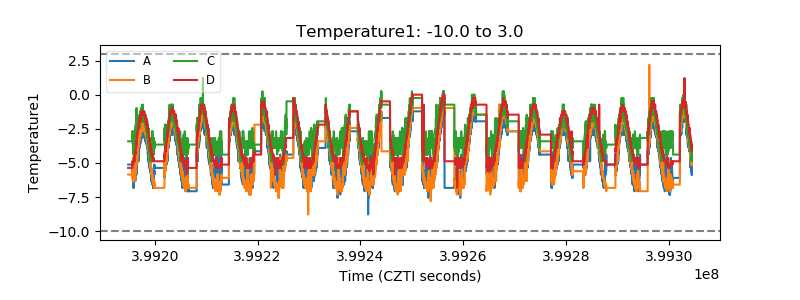 |
| Veto HV Monitor |  |
| Veto LLD |  |
| Alpha Counter | 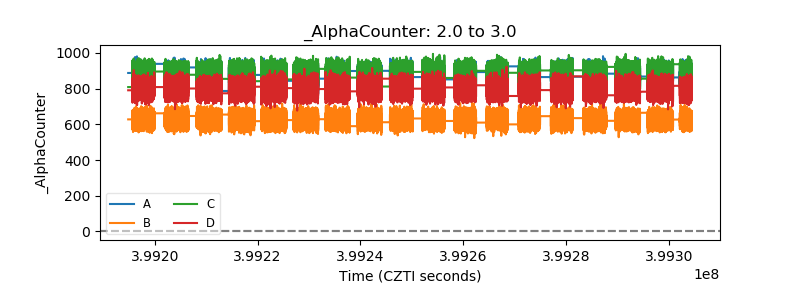 |
| _CPM_Rate |  |
| CZT Counter |  |
| +2.5 Volts monitor |  |
| +5 Volts monitor |  |
| _ROLL_ROT |  |
| _Roll_DEC |  |
| _Roll_RA |  |
| Veto Counter |  |