| Param | Original file | Final file |
|---|---|---|
| Filename | modeM0/AS1T05_048T01_9000005318_37364cztM0_level2.evt | modeM0/AS1T05_048T01_9000005318_37364cztM0_level2_quad_clean.evt |
| Size (bytes) | 620,717,760 | 67,291,200 |
| Size | 592.0 MB | 64.2 MB |
| Events in quadrant A | 2,602,117 | 462,071 |
| Events in quadrant B | 2,476,954 | 472,407 |
| Events in quadrant C | 2,664,082 | 473,217 |
| Events in quadrant D | 10,709,469 | 270,641 |
| Mode M0 | |||
|---|---|---|---|
| Quadrant | BADHDUFLAG | Total packets | Discarded packets |
| A | 0 | 10787 | 3 |
| B | 0 | 10558 | 2 |
| C | 0 | 10837 | 2 |
| D | 0 | 35422 | 2 |
| Mode SS | |||
|---|---|---|---|
| Quadrant | BADHDUFLAG | Total packets | Discarded packets |
| A | 0 | 106 | 0 |
| B | 0 | 106 | 0 |
| C | 0 | 106 | 0 |
| D | 0 | 106 | 0 |
| Mode M9 | |||
|---|---|---|---|
| Quadrant | BADHDUFLAG | Total packets | Discarded packets |
| A | 0 | 26 | 0 |
| B | 0 | 26 | 0 |
| C | 0 | 26 | 0 |
| D | 0 | 27 | 0 |
| Quadrant | Total seconds | Saturated seconds | Saturation percentage |
|---|---|---|---|
| A | 5096 | 10 | 0.196232% |
| B | 5096 | 18 | 0.353218% |
| C | 5096 | 46 | 0.902669% |
| D | 5096 | 3399 | 66.699372% |
Noise dominated data is calculated using 1-second bins in cleaned event files. If a bin has >2000 counts, and if more than 50% of those come from <1% of pixels, then it is considered to be noise-dominated and hence unusable.
| Quadrant | # 1 sec bins | Bins with >0 counts | Bins with >2000 counts | High rate bins dominated by noise | Noise dominated (total time) | Noise dominated (detector-on time) | Marked lightcurve |
|---|---|---|---|---|---|---|---|
| A | 7037 | 5097 | 2 | 2 | 0.03% | 0.04% | 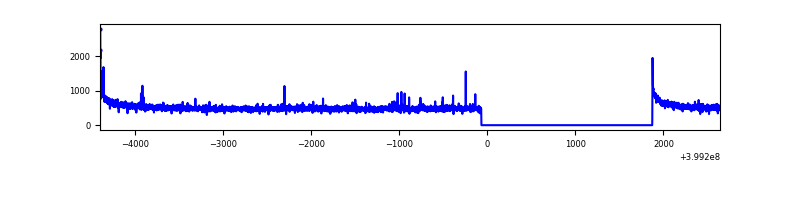 |
| B | 7037 | 5097 | 9 | 9 | 0.13% | 0.18% | 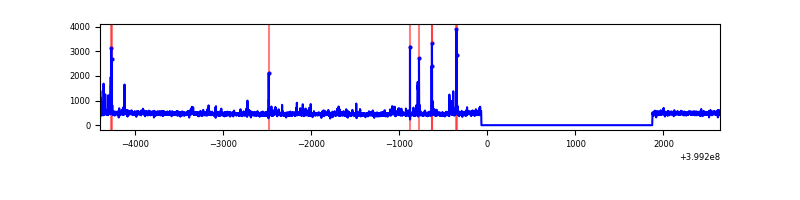 |
| C | 7037 | 5097 | 28 | 28 | 0.40% | 0.55% | 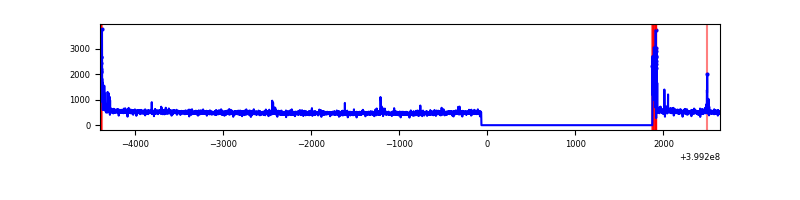 |
| D | 7037 | 5097 | 3273 | 3273 | 46.51% | 64.21% | 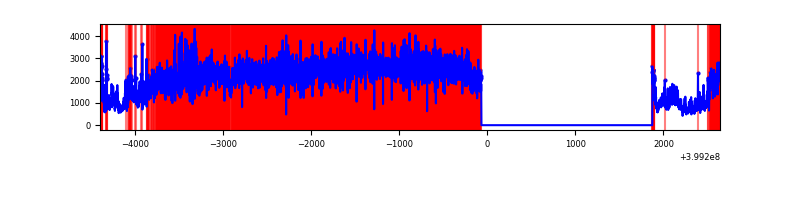 |
Top three noisy pixels from each quadrant. If the there are fewer than three noisy pixels in the level2.evt file, extra rows are filled as -1
| Pixel properties | Quadrant properties | ||||||
|---|---|---|---|---|---|---|---|
| Quadrant | DetID | PixID | Counts | Sigma | Mean | Median | Sigma |
| A | 10 | 83 | 264290 | 2192.18 | 591 | 579 | 120.3 |
| A | 13 | 248 | 24091 | 195.45 | 591 | 579 | 120.3 |
| A | 9 | 143 | 10185 | 79.85 | 591 | 579 | 120.3 |
| B | 5 | 255 | 51437 | 446.44 | 589 | 575 | 113.9 |
| B | 5 | 200 | 32147 | 277.12 | 589 | 575 | 113.9 |
| B | 5 | 172 | 16464 | 139.47 | 589 | 575 | 113.9 |
| C | 15 | 214 | 220229 | 1614.35 | 580 | 585 | 136.1 |
| C | 0 | 10 | 88939 | 649.39 | 580 | 585 | 136.1 |
| C | 1 | 23 | 59338 | 431.83 | 580 | 585 | 136.1 |
| D | 12 | 235 | 8294510 | 74904.04 | 442 | 428 | 110.7 |
| D | 10 | 253 | 268186 | 2418.13 | 442 | 428 | 110.7 |
| D | 12 | 227 | 188610 | 1699.48 | 442 | 428 | 110.7 |
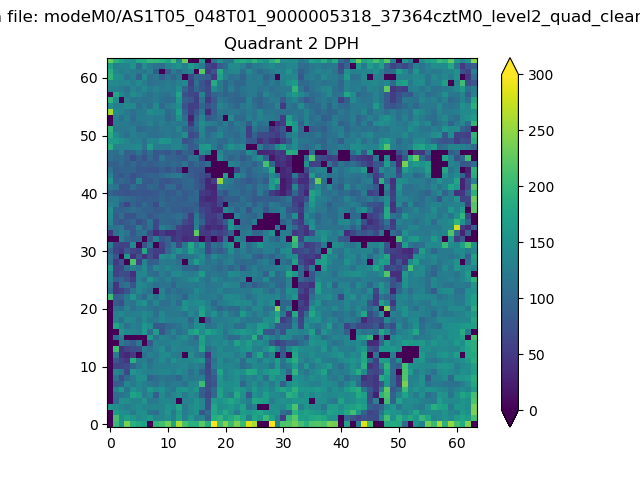
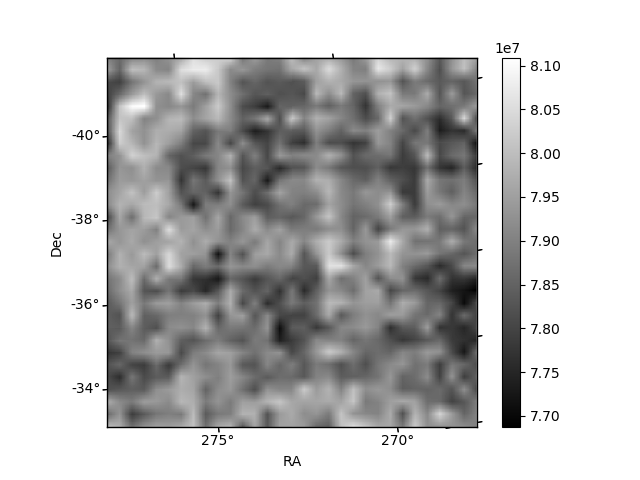
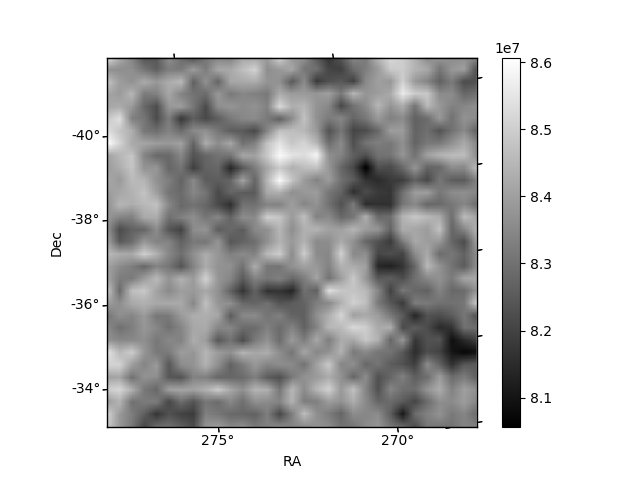
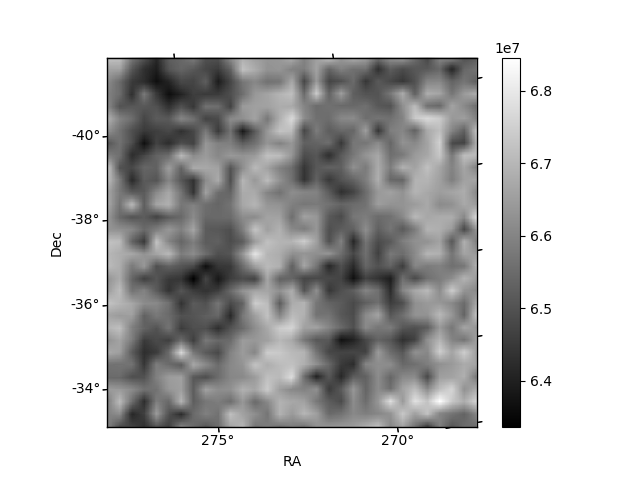
Histogram calculated using DETX and DETY for each event in the final _common_clean file
| Quadrant A | 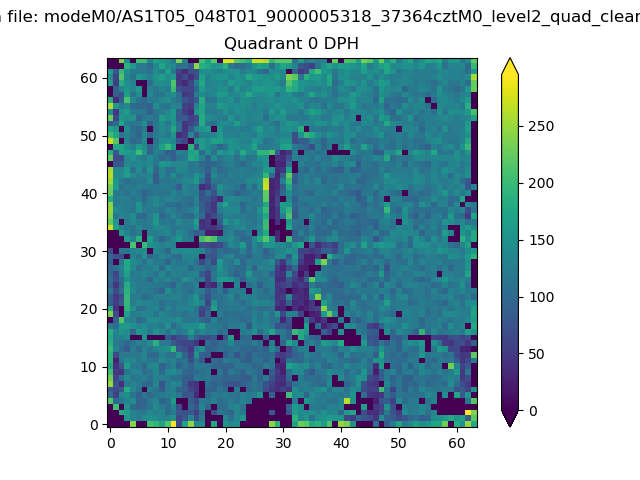 |
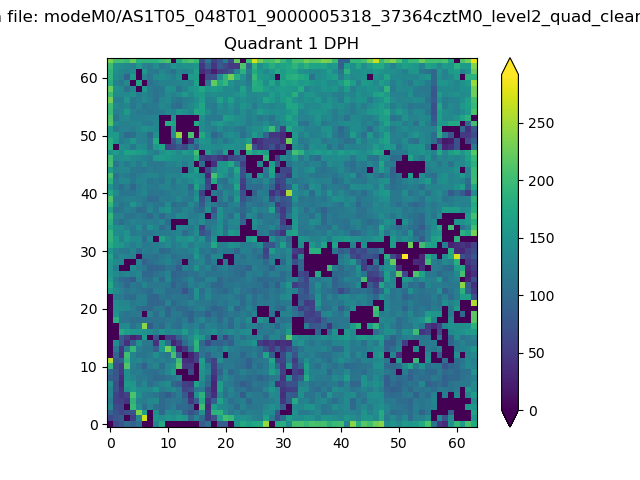 |
Quadrant B |
|---|---|---|---|
| Quadrant D | 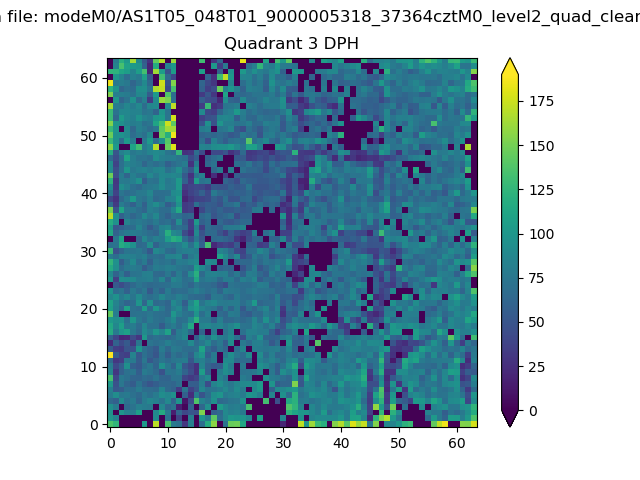 |
 |
Quadrant C |
| Plot type | Count rate plots | Images |
|---|---|---|
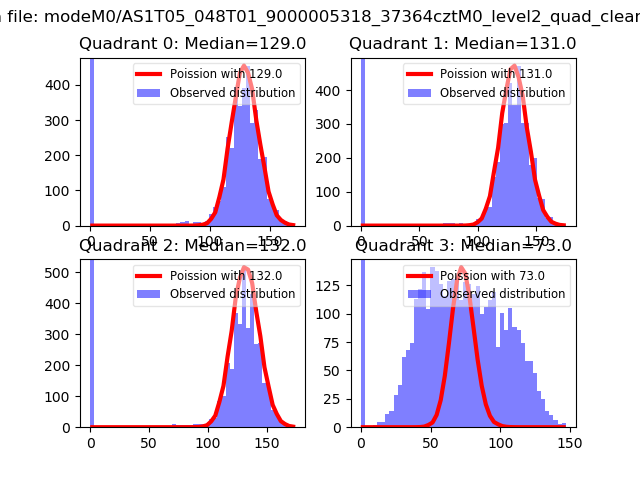
| Comparison with Poisson distribution Blue bars denote a histogram of data divided into 1 sec bins. Red curve is a Poisson curve with rate = median count rate of data. |
 |
 |
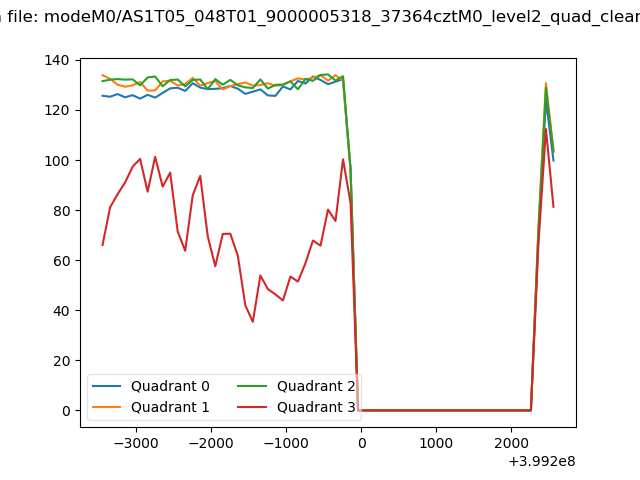
| Quadrant-wise count rates Data is divided into 100 sec bins |
 |
|
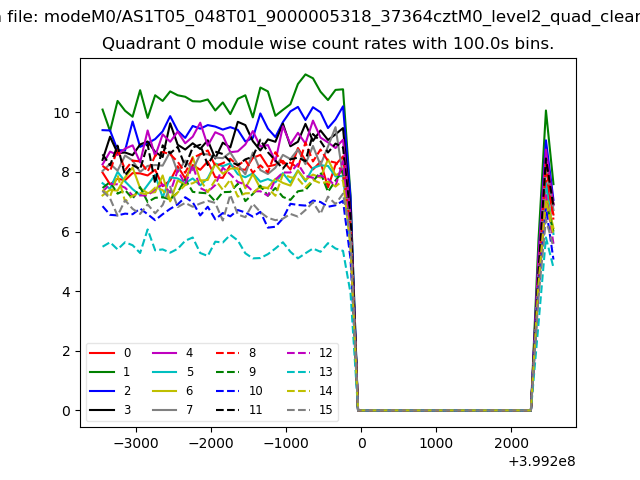
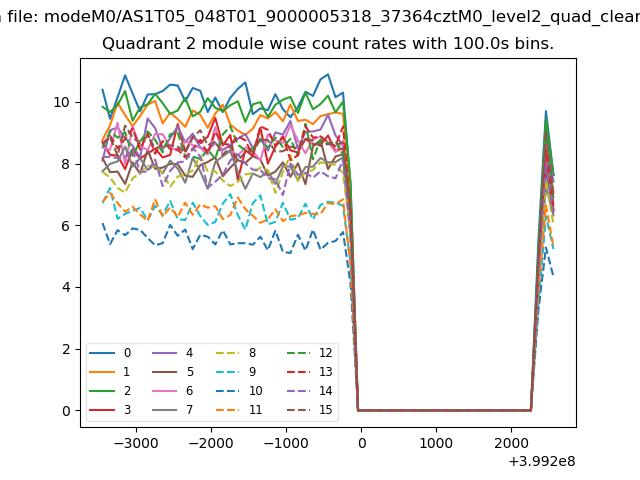
| Module-wise count rates for Quadrant A Data is divided into 100 sec bins |
 |
 |
| Module-wise count rates for Quadrant B Data is divided into 100 sec bins |
 |
 |
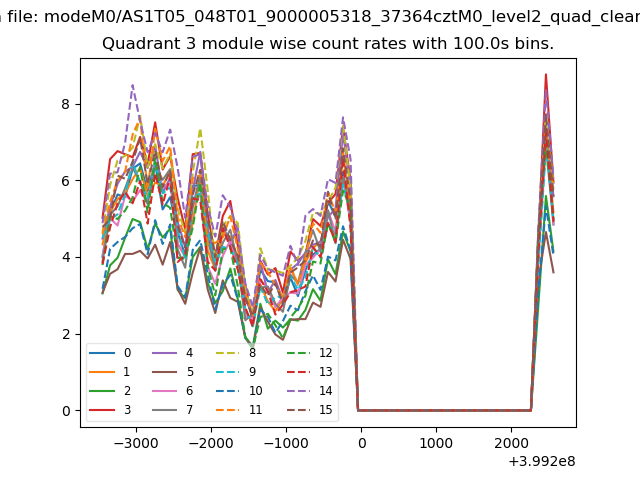
| Module-wise count rates for Quadrant C Data is divided into 100 sec bins |
 |
 |
| Module-wise count rates for Quadrant D Data is divided into 100 sec bins |
 |
 |
| Parameter | Plot |
|---|---|
| CZT HV Monitor | 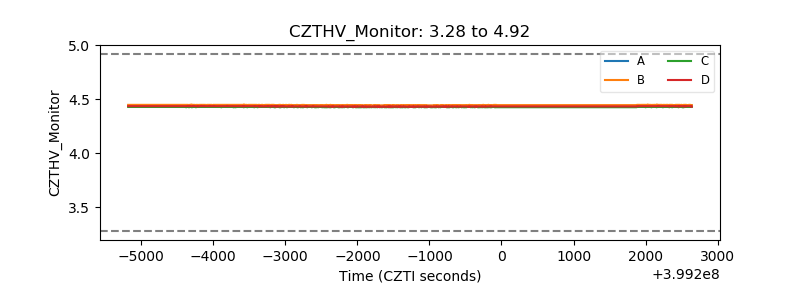 |
| D_VDD | 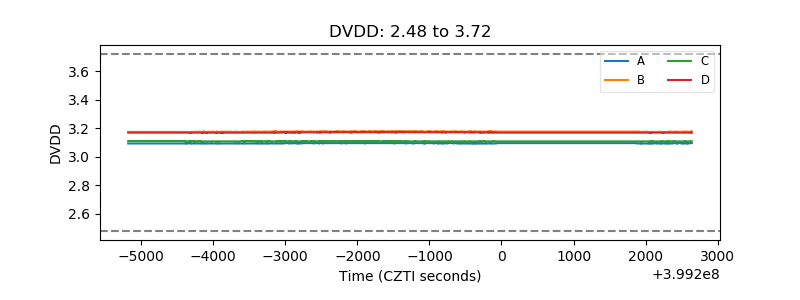 |
| Temperature 1 | 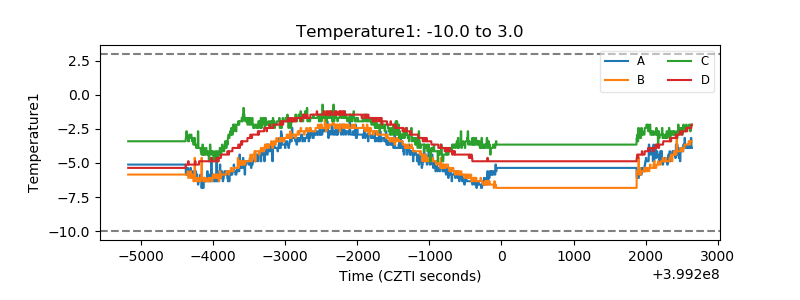 |
| Veto HV Monitor | 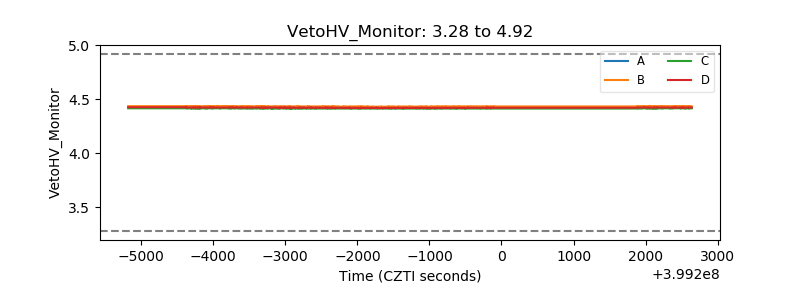 |
| Veto LLD | 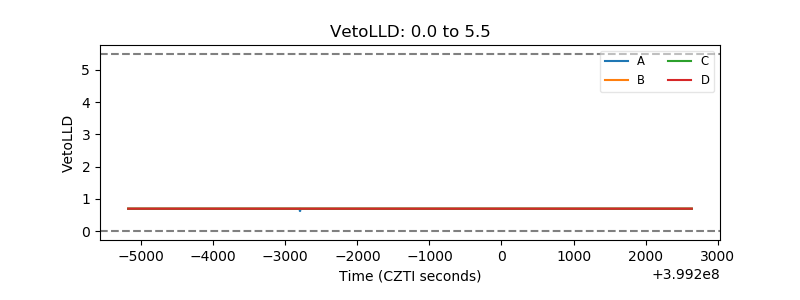 |
| Alpha Counter | 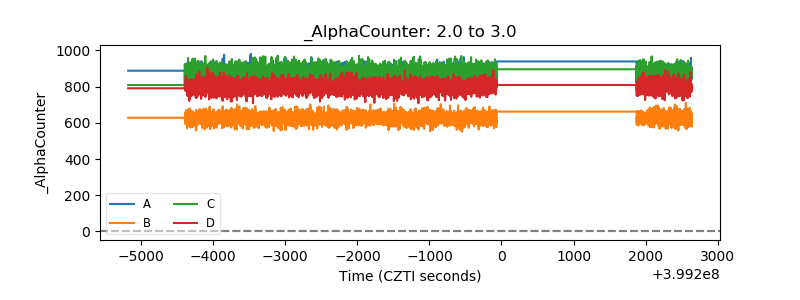 |
| _CPM_Rate | 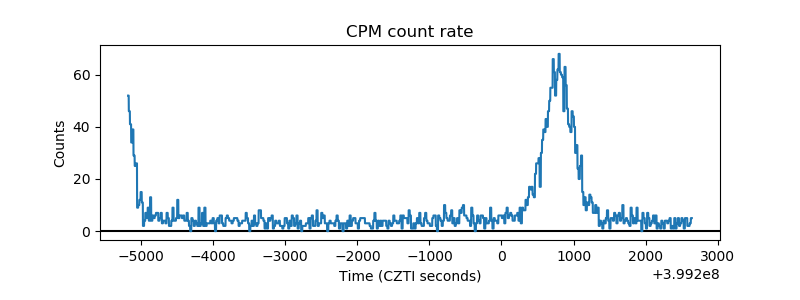 |
| CZT Counter | 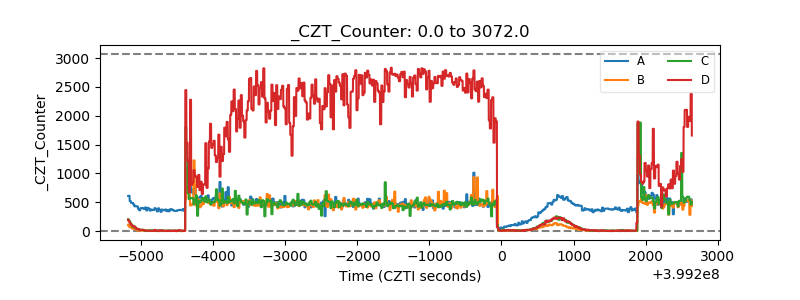 |
| +2.5 Volts monitor | 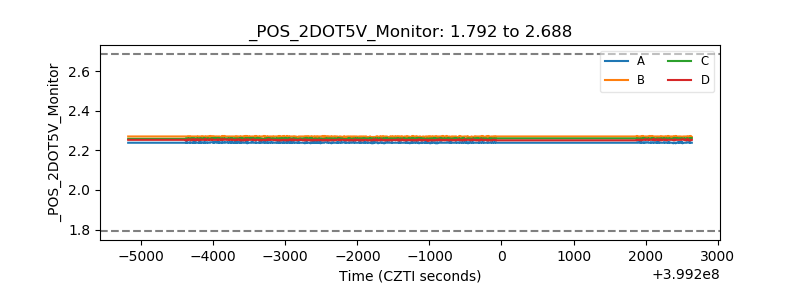 |
| +5 Volts monitor |  |
| _ROLL_ROT | 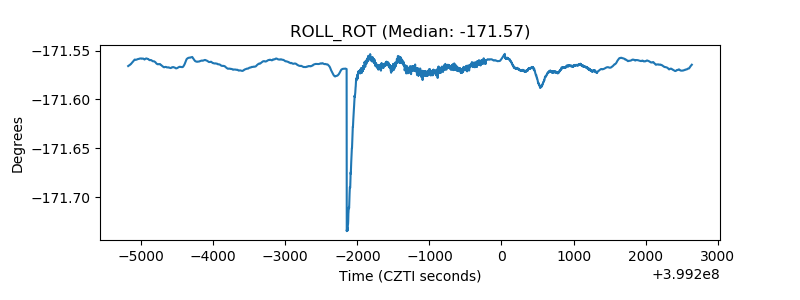 |
| _Roll_DEC | 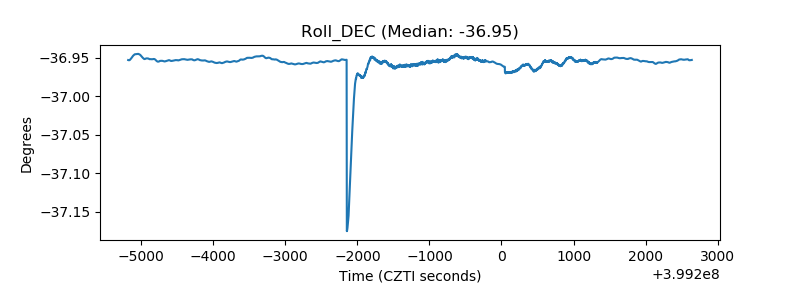 |
| _Roll_RA | 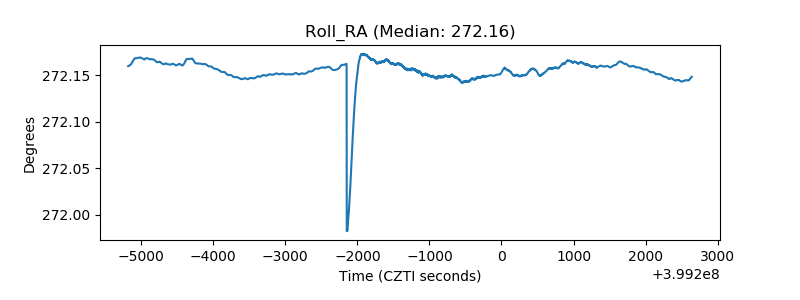 |
| Veto Counter | 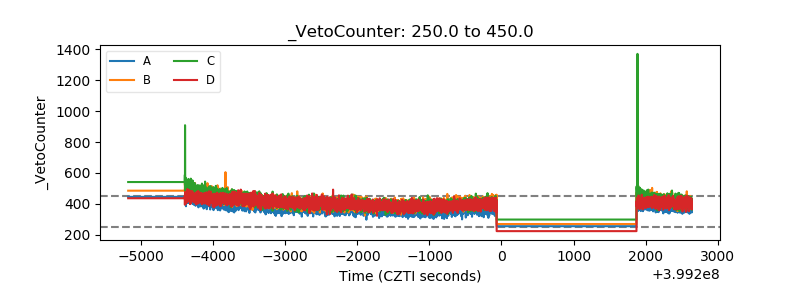 |