| Param | Original file | Final file |
|---|---|---|
| Filename | modeM0/AS1T05_048T01_9000005318_37365cztM0_level2.evt | modeM0/AS1T05_048T01_9000005318_37365cztM0_level2_quad_clean.evt |
| Size (bytes) | 627,724,800 | 80,824,320 |
| Size | 598.6 MB | 77.1 MB |
| Events in quadrant A | 2,756,445 | 542,406 |
| Events in quadrant B | 3,810,290 | 531,757 |
| Events in quadrant C | 2,935,301 | 555,769 |
| Events in quadrant D | 9,138,504 | 433,287 |
| Mode M0 | |||
|---|---|---|---|
| Quadrant | BADHDUFLAG | Total packets | Discarded packets |
| A | 0 | 11572 | 3 |
| B | 0 | 14848 | 2 |
| C | 0 | 12053 | 2 |
| D | 0 | 31007 | 2 |
| Mode SS | |||
|---|---|---|---|
| Quadrant | BADHDUFLAG | Total packets | Discarded packets |
| A | 0 | 112 | 0 |
| B | 0 | 112 | 0 |
| C | 0 | 112 | 0 |
| D | 0 | 112 | 0 |
| Mode M9 | |||
|---|---|---|---|
| Quadrant | BADHDUFLAG | Total packets | Discarded packets |
| A | 0 | 27 | 0 |
| B | 0 | 27 | 0 |
| C | 0 | 27 | 0 |
| D | 0 | 28 | 0 |
| Quadrant | Total seconds | Saturated seconds | Saturation percentage |
|---|---|---|---|
| A | 5475 | 11 | 0.200913% |
| B | 5475 | 413 | 7.543379% |
| C | 5475 | 58 | 1.059361% |
| D | 5475 | 1637 | 29.899543% |
Noise dominated data is calculated using 1-second bins in cleaned event files. If a bin has >2000 counts, and if more than 50% of those come from <1% of pixels, then it is considered to be noise-dominated and hence unusable.
| Quadrant | # 1 sec bins | Bins with >0 counts | Bins with >2000 counts | High rate bins dominated by noise | Noise dominated (total time) | Noise dominated (detector-on time) | Marked lightcurve |
|---|---|---|---|---|---|---|---|
| A | 7087 | 5476 | 3 | 3 | 0.04% | 0.05% | 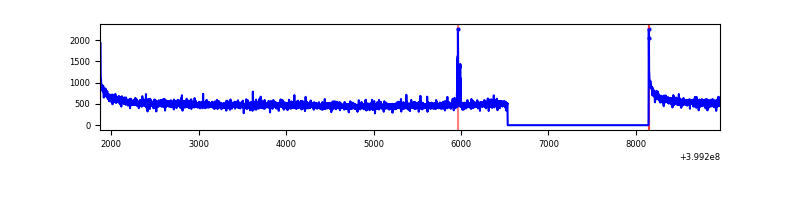 |
| B | 7087 | 5476 | 317 | 317 | 4.47% | 5.79% | 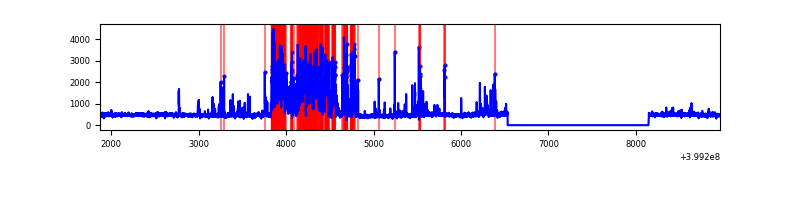 |
| C | 7087 | 5476 | 47 | 47 | 0.66% | 0.86% | 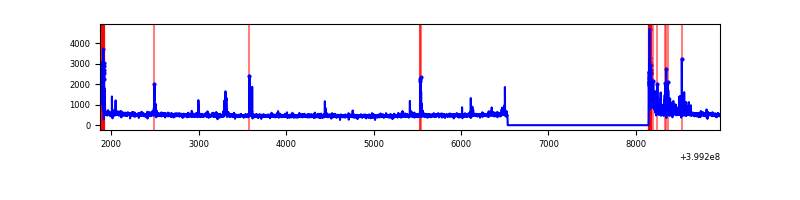 |
| D | 7087 | 5476 | 1763 | 1763 | 24.88% | 32.20% | 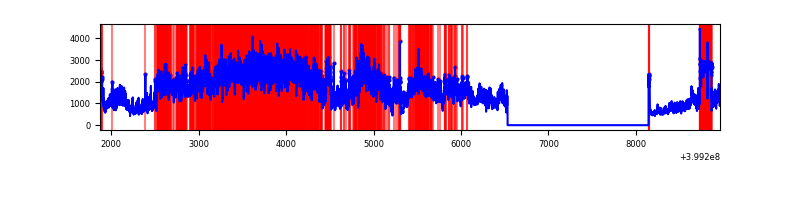 |
Top three noisy pixels from each quadrant. If the there are fewer than three noisy pixels in the level2.evt file, extra rows are filled as -1
| Pixel properties | Quadrant properties | ||||||
|---|---|---|---|---|---|---|---|
| Quadrant | DetID | PixID | Counts | Sigma | Mean | Median | Sigma |
| A | 10 | 83 | 286036 | 2263.19 | 624 | 612 | 126.1 |
| A | 13 | 248 | 29449 | 228.65 | 624 | 612 | 126.1 |
| A | 13 | 6 | 14755 | 112.14 | 624 | 612 | 126.1 |
| B | 5 | 172 | 1205667 | 10262.11 | 606 | 590 | 117.4 |
| B | 5 | 255 | 85294 | 721.32 | 606 | 590 | 117.4 |
| B | 0 | 190 | 39230 | 329.05 | 606 | 590 | 117.4 |
| C | 15 | 214 | 233021 | 1645.41 | 606 | 609 | 141.2 |
| C | 1 | 23 | 214029 | 1510.95 | 606 | 609 | 141.2 |
| C | 0 | 10 | 66486 | 466.39 | 606 | 609 | 141.2 |
| D | 12 | 235 | 6349893 | 46484.2 | 550 | 533 | 136.6 |
| D | 12 | 227 | 459753 | 3361.99 | 550 | 533 | 136.6 |
| D | 10 | 199 | 46496 | 336.5 | 550 | 533 | 136.6 |
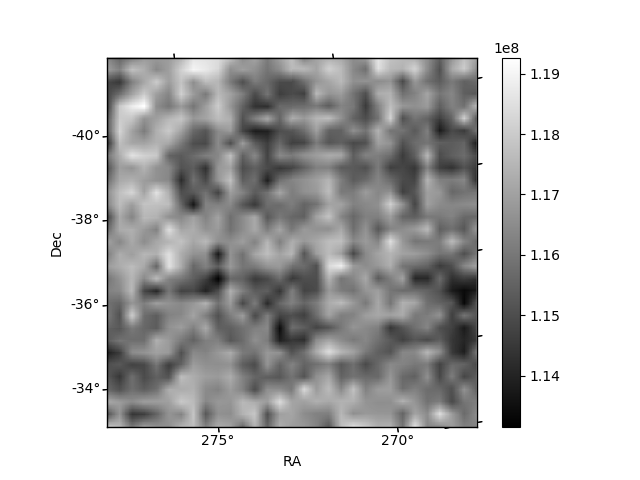
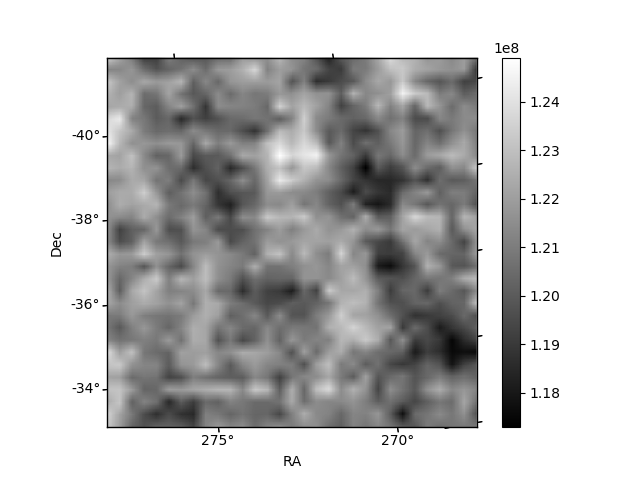
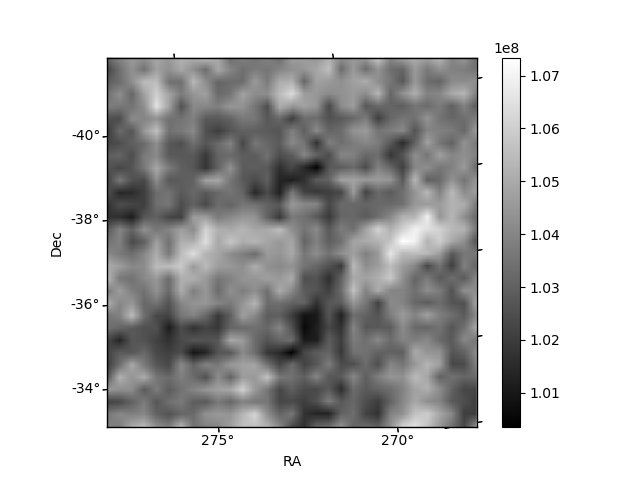
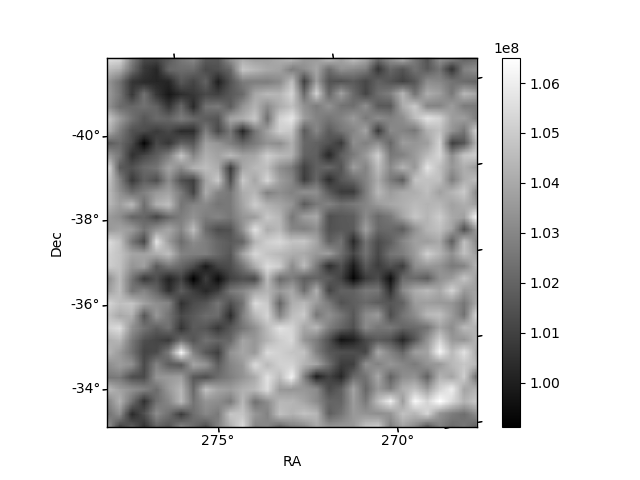
Histogram calculated using DETX and DETY for each event in the final _common_clean file
| Quadrant A | 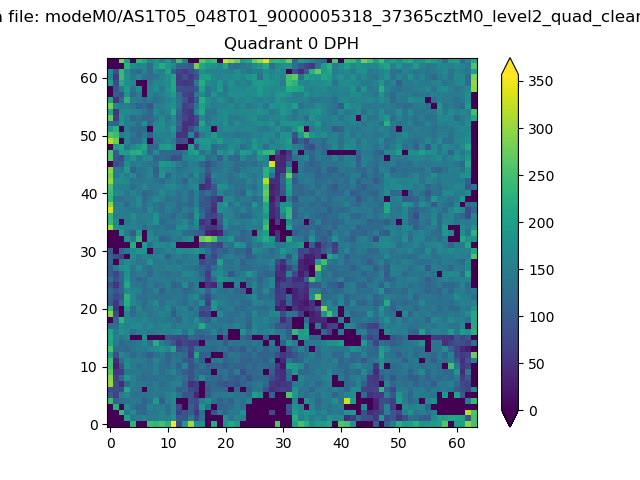 |
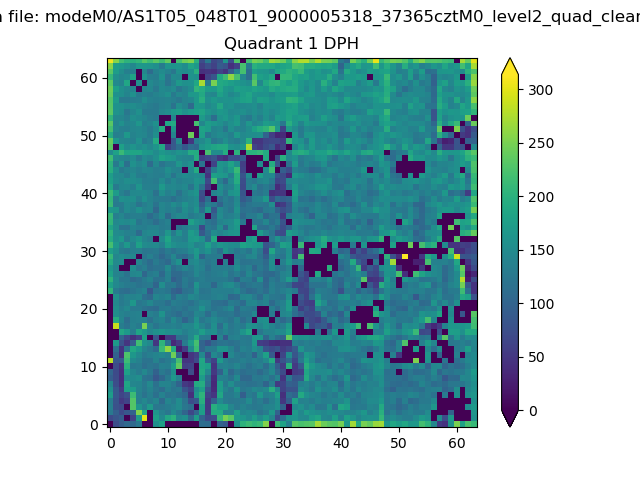 |
Quadrant B |
|---|---|---|---|
| Quadrant D | 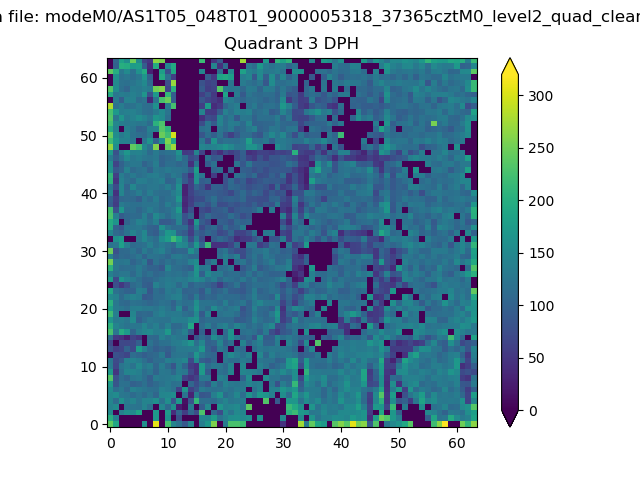 |
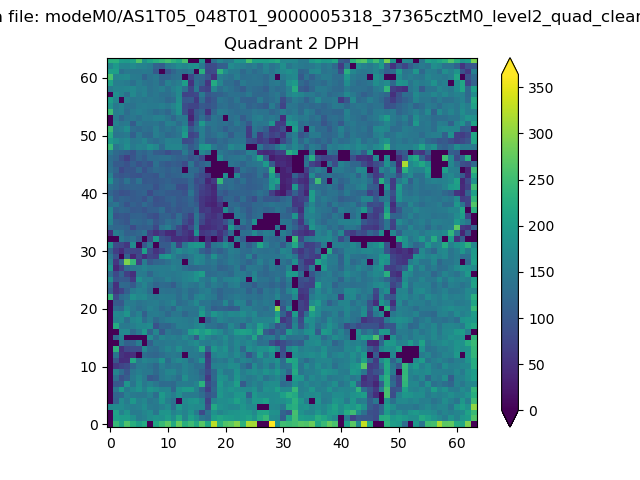 |
Quadrant C |
| Plot type | Count rate plots | Images |
|---|---|---|
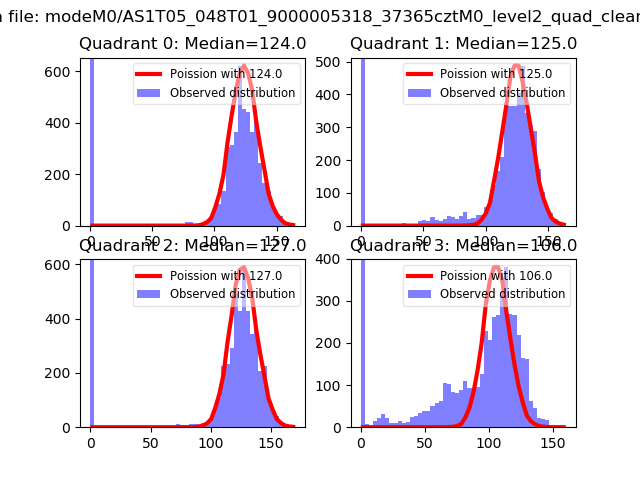
| Comparison with Poisson distribution Blue bars denote a histogram of data divided into 1 sec bins. Red curve is a Poisson curve with rate = median count rate of data. |
 |
 |
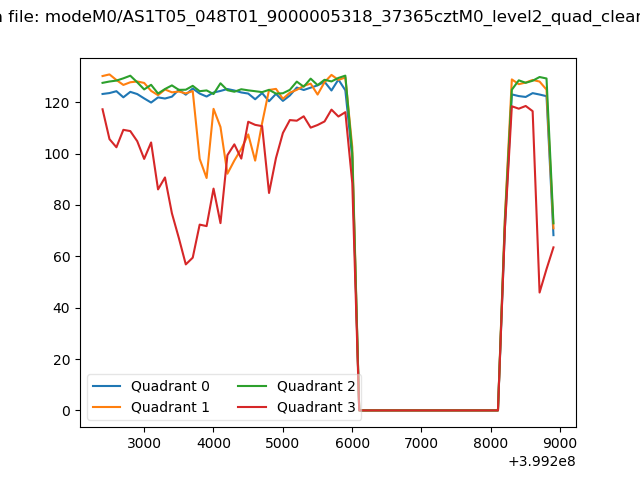
| Quadrant-wise count rates Data is divided into 100 sec bins |
 |
|
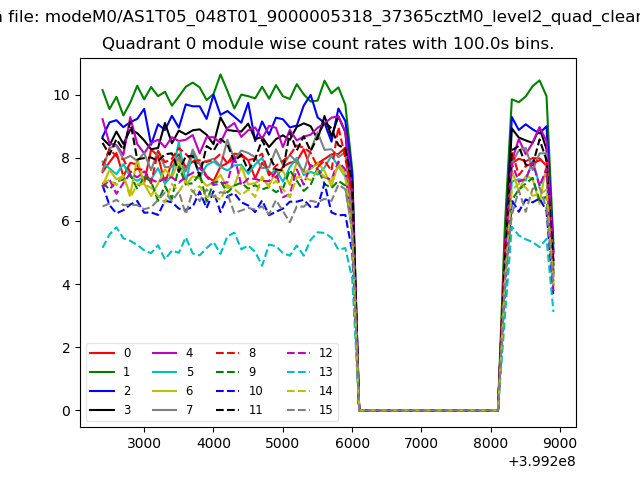
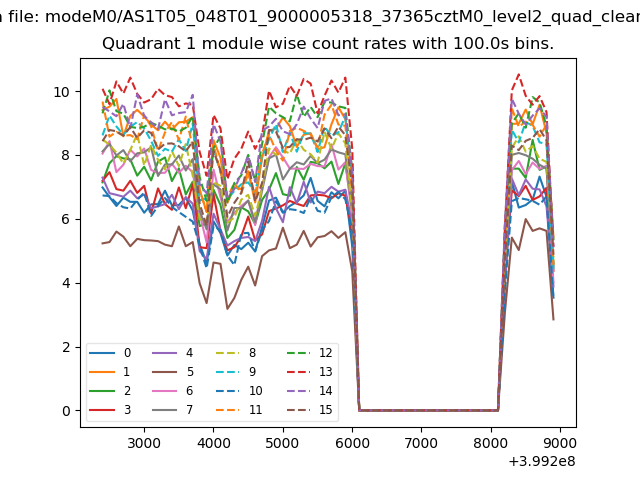
| Module-wise count rates for Quadrant A Data is divided into 100 sec bins |
 |
 |
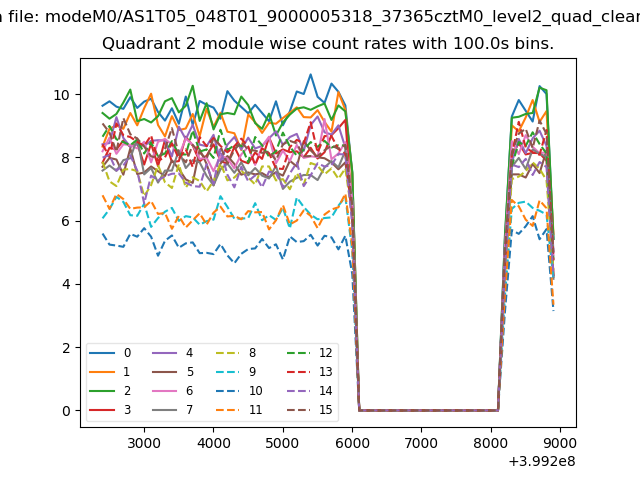
| Module-wise count rates for Quadrant B Data is divided into 100 sec bins |
 |
 |
| Module-wise count rates for Quadrant C Data is divided into 100 sec bins |
 |
 |
| Module-wise count rates for Quadrant D Data is divided into 100 sec bins |
 |
 |
| Parameter | Plot |
|---|---|
| CZT HV Monitor | 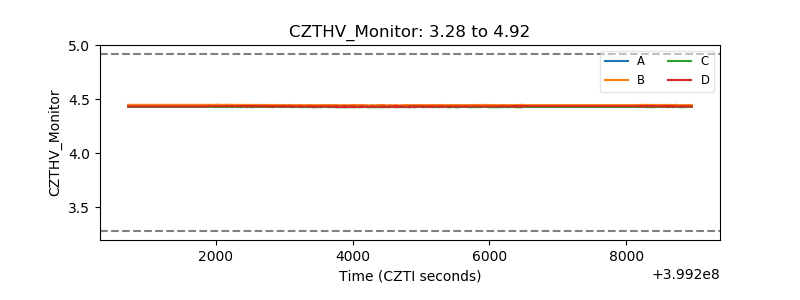 |
| D_VDD | 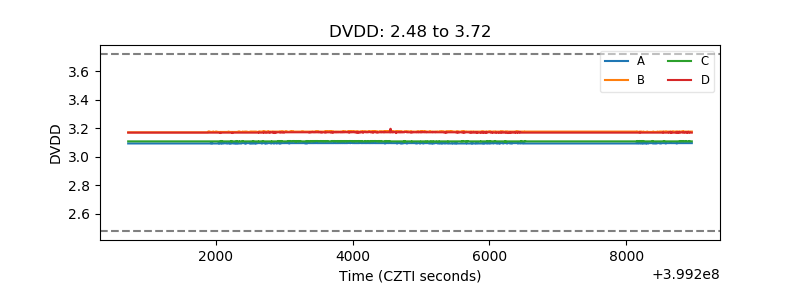 |
| Temperature 1 | 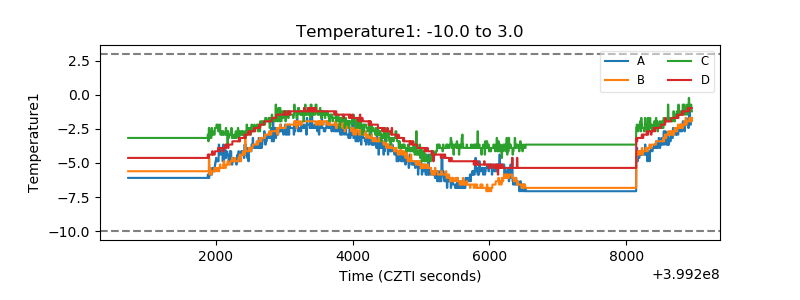 |
| Veto HV Monitor | 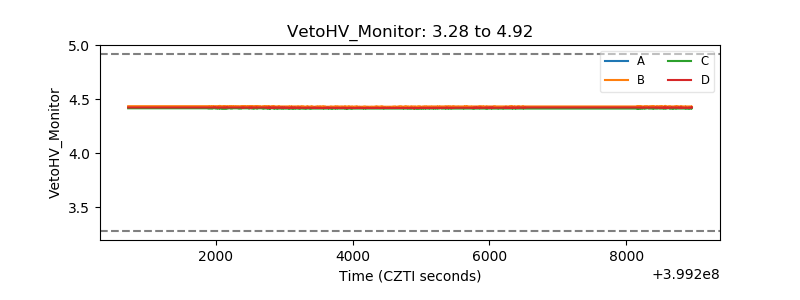 |
| Veto LLD | 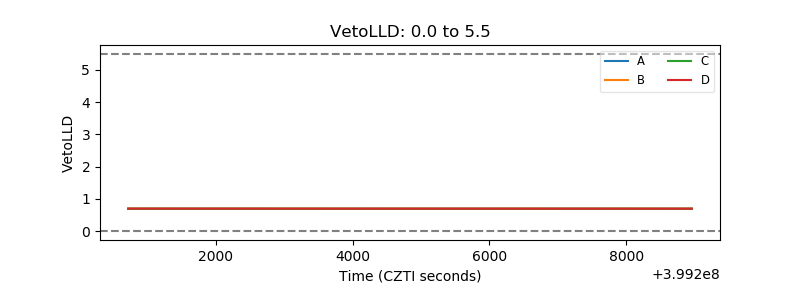 |
| Alpha Counter | 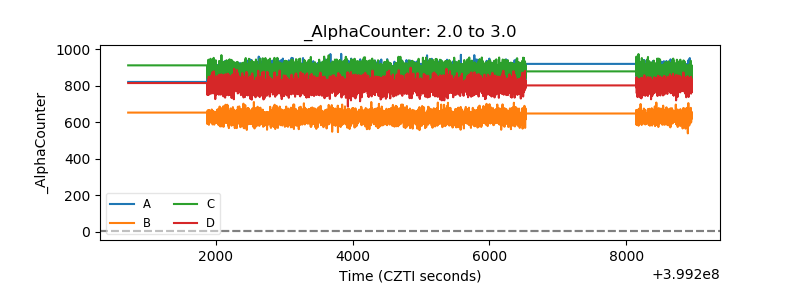 |
| _CPM_Rate | 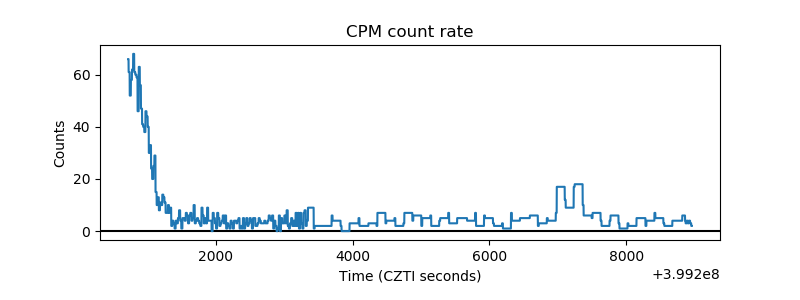 |
| CZT Counter | 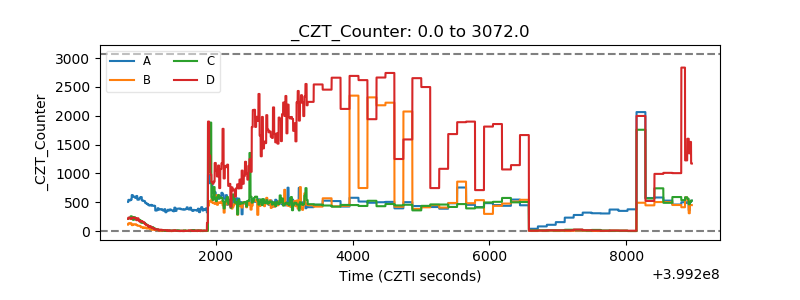 |
| +2.5 Volts monitor | 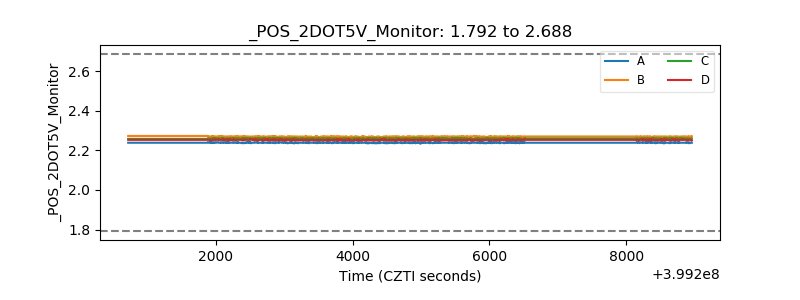 |
| +5 Volts monitor | 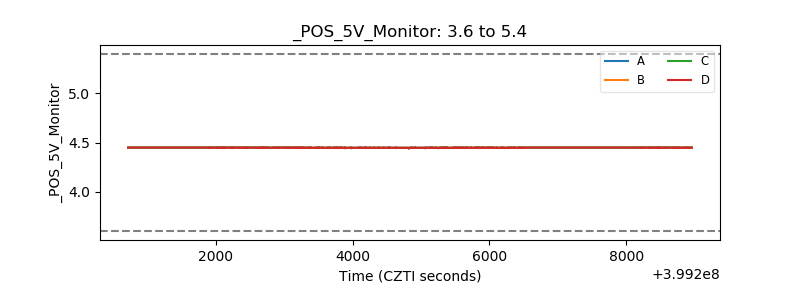 |
| _ROLL_ROT | 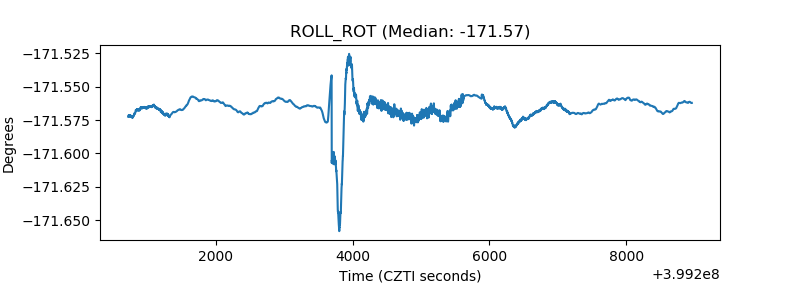 |
| _Roll_DEC | 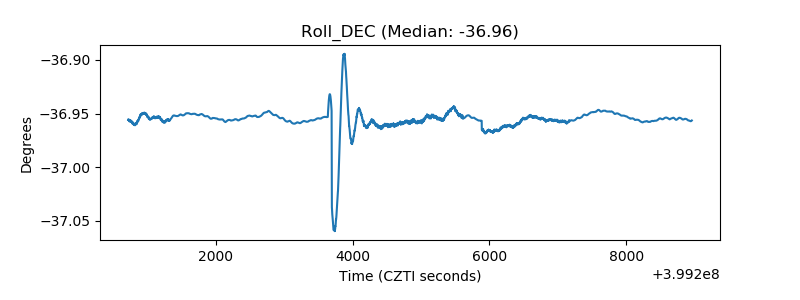 |
| _Roll_RA | 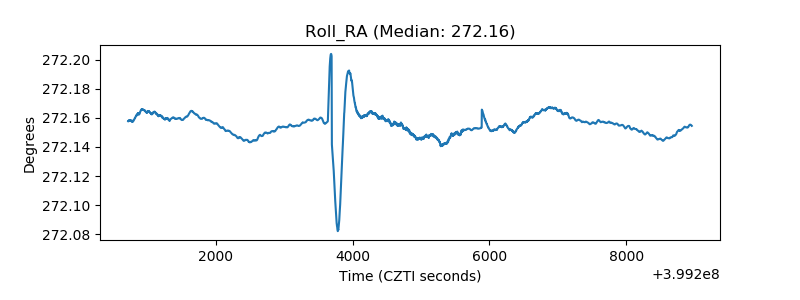 |
| Veto Counter |  |