| Param | Original file | Final file |
|---|---|---|
| Filename | modeM0/AS1T05_048T01_9000005318_37366cztM0_level2.evt | modeM0/AS1T05_048T01_9000005318_37366cztM0_level2_quad_clean.evt |
| Size (bytes) | 635,909,760 | 83,401,920 |
| Size | 606.5 MB | 79.5 MB |
| Events in quadrant A | 2,909,227 | 551,579 |
| Events in quadrant B | 2,900,282 | 561,978 |
| Events in quadrant C | 3,380,326 | 560,360 |
| Events in quadrant D | 9,674,918 | 443,657 |
| Mode M0 | |||
|---|---|---|---|
| Quadrant | BADHDUFLAG | Total packets | Discarded packets |
| A | 0 | 12263 | 3 |
| B | 0 | 12392 | 2 |
| C | 0 | 13585 | 2 |
| D | 0 | 32820 | 2 |
| Mode SS | |||
|---|---|---|---|
| Quadrant | BADHDUFLAG | Total packets | Discarded packets |
| A | 0 | 122 | 0 |
| B | 0 | 122 | 0 |
| C | 0 | 122 | 0 |
| D | 0 | 122 | 0 |
| Mode M9 | |||
|---|---|---|---|
| Quadrant | BADHDUFLAG | Total packets | Discarded packets |
| A | 0 | 29 | 0 |
| B | 0 | 29 | 0 |
| C | 0 | 29 | 0 |
| D | 0 | 29 | 0 |
| Quadrant | Total seconds | Saturated seconds | Saturation percentage |
|---|---|---|---|
| A | 5822 | 13 | 0.223291% |
| B | 5822 | 37 | 0.635520% |
| C | 5822 | 93 | 1.597389% |
| D | 5822 | 1778 | 30.539334% |
Noise dominated data is calculated using 1-second bins in cleaned event files. If a bin has >2000 counts, and if more than 50% of those come from <1% of pixels, then it is considered to be noise-dominated and hence unusable.
| Quadrant | # 1 sec bins | Bins with >0 counts | Bins with >2000 counts | High rate bins dominated by noise | Noise dominated (total time) | Noise dominated (detector-on time) | Marked lightcurve |
|---|---|---|---|---|---|---|---|
| A | 8808 | 5824 | 5 | 5 | 0.06% | 0.09% | 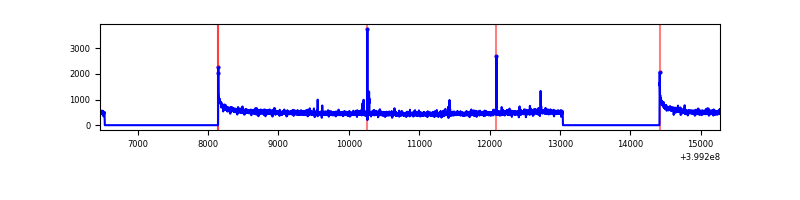 |
| B | 8808 | 5824 | 24 | 24 | 0.27% | 0.41% | 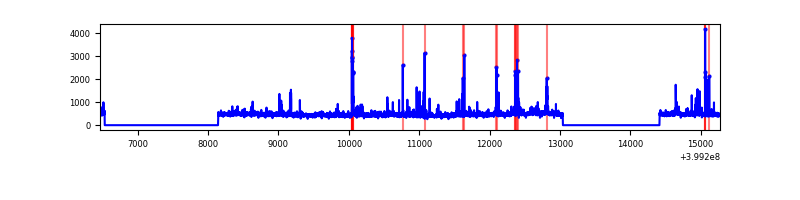 |
| C | 8808 | 5824 | 79 | 79 | 0.90% | 1.36% | 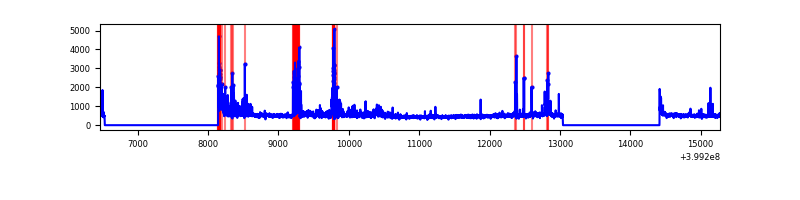 |
| D | 8808 | 5824 | 2110 | 2110 | 23.96% | 36.23% | 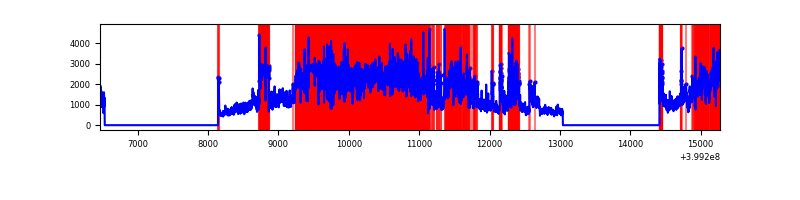 |
Top three noisy pixels from each quadrant. If the there are fewer than three noisy pixels in the level2.evt file, extra rows are filled as -1
| Pixel properties | Quadrant properties | ||||||
|---|---|---|---|---|---|---|---|
| Quadrant | DetID | PixID | Counts | Sigma | Mean | Median | Sigma |
| A | 10 | 83 | 300763 | 2236.34 | 661 | 648 | 134.2 |
| A | 9 | 143 | 18832 | 135.5 | 661 | 648 | 134.2 |
| A | 13 | 6 | 17235 | 123.6 | 661 | 648 | 134.2 |
| B | 5 | 172 | 126663 | 986.65 | 656 | 639 | 127.7 |
| B | 5 | 255 | 72973 | 566.31 | 656 | 639 | 127.7 |
| B | 0 | 190 | 30783 | 236.0 | 656 | 639 | 127.7 |
| C | 1 | 23 | 371916 | 2479.23 | 641 | 645 | 149.8 |
| C | 15 | 214 | 244826 | 1630.57 | 641 | 645 | 149.8 |
| C | 15 | 208 | 147080 | 977.85 | 641 | 645 | 149.8 |
| D | 12 | 235 | 5298099 | 37408.04 | 583 | 568 | 141.6 |
| D | 12 | 227 | 1630678 | 11510.88 | 583 | 568 | 141.6 |
| D | 2 | 249 | 177718 | 1250.93 | 583 | 568 | 141.6 |
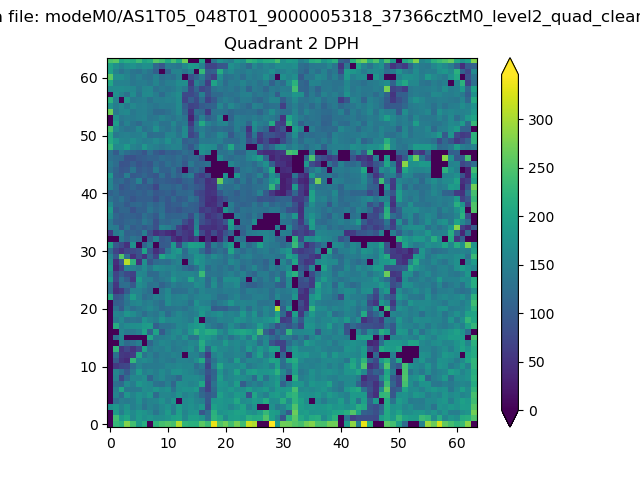
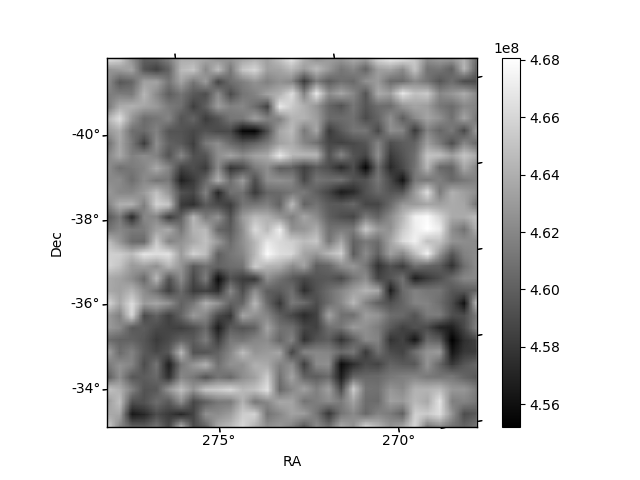
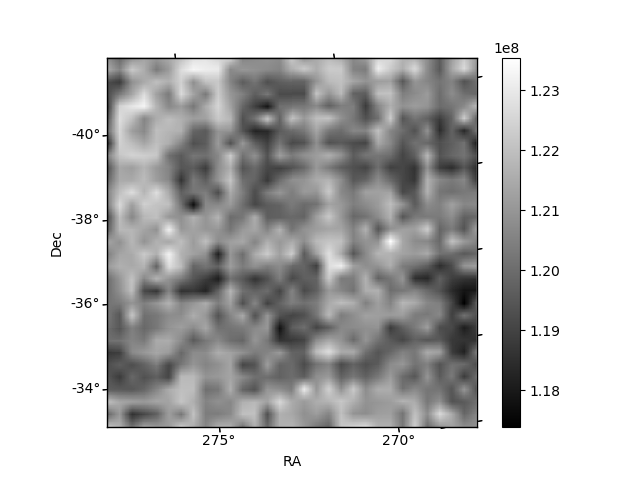
Histogram calculated using DETX and DETY for each event in the final _common_clean file
| Quadrant A | 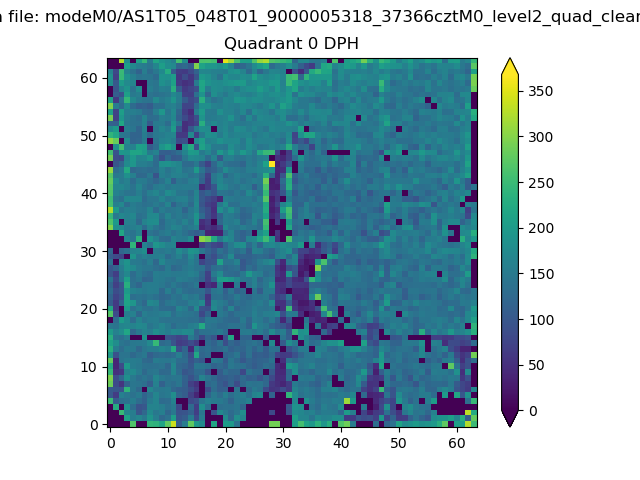 |
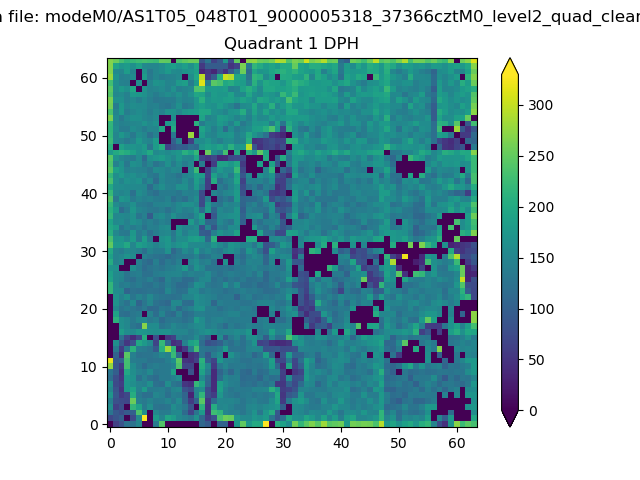 |
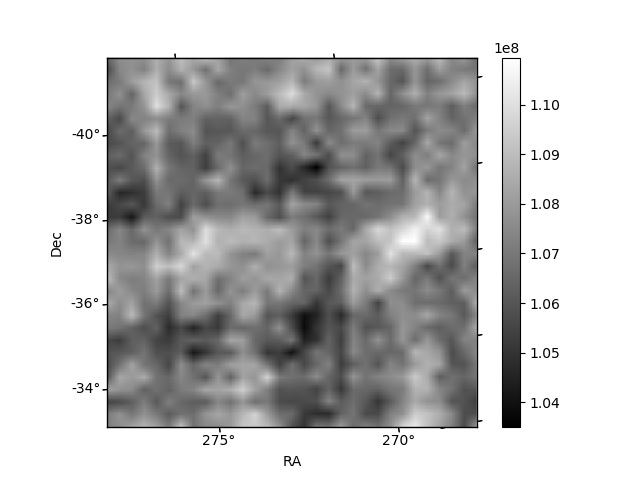
Quadrant B |
|---|---|---|---|
| Quadrant D | 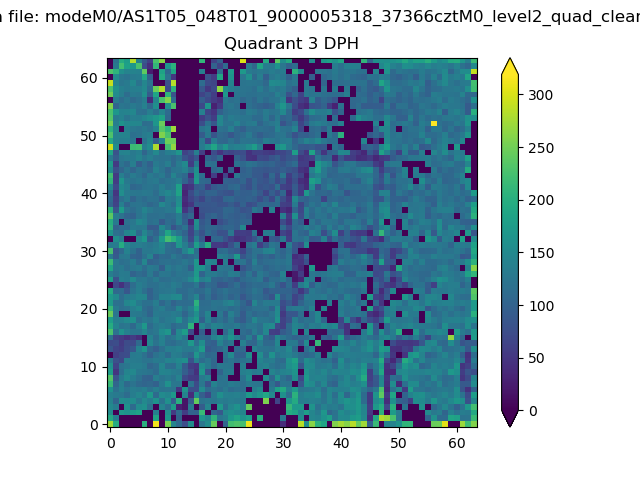 |
 |
Quadrant C |
| Plot type | Count rate plots | Images |
|---|---|---|
| Comparison with Poisson distribution Blue bars denote a histogram of data divided into 1 sec bins. Red curve is a Poisson curve with rate = median count rate of data. |
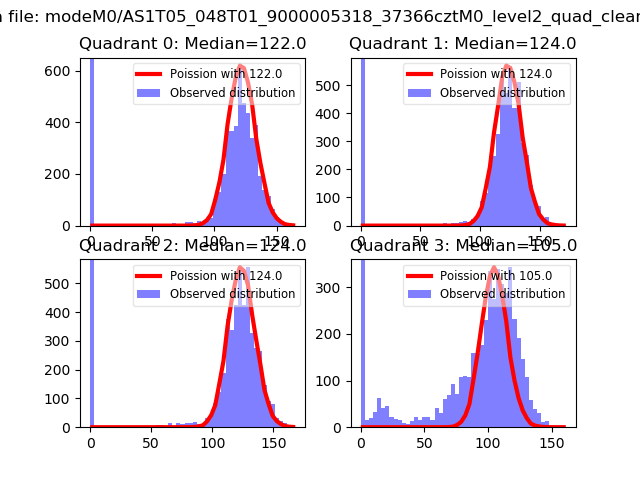 |
 |
| Quadrant-wise count rates Data is divided into 100 sec bins |
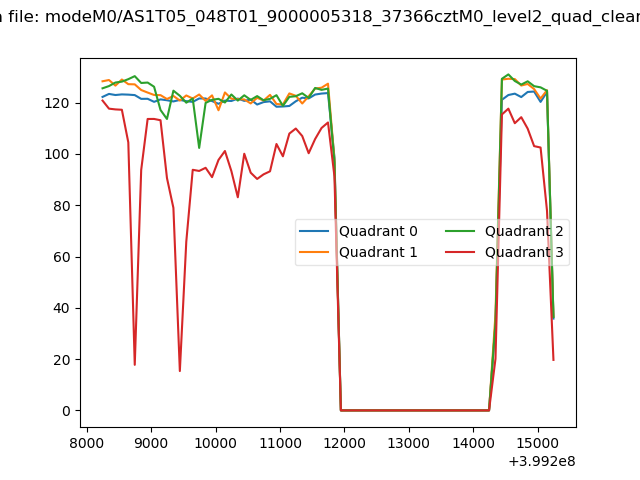 |
|
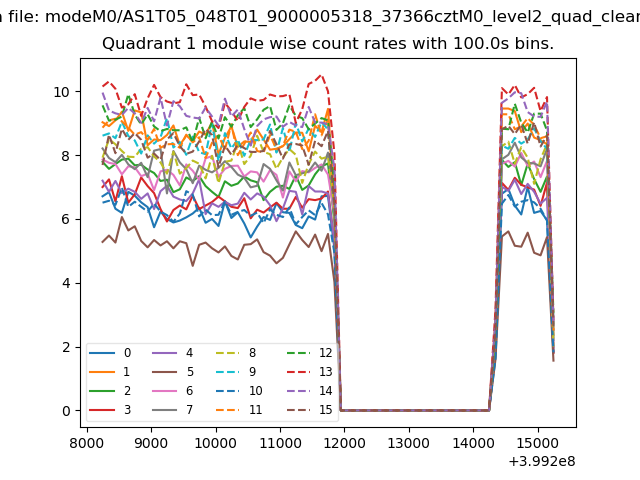
| Module-wise count rates for Quadrant A Data is divided into 100 sec bins |
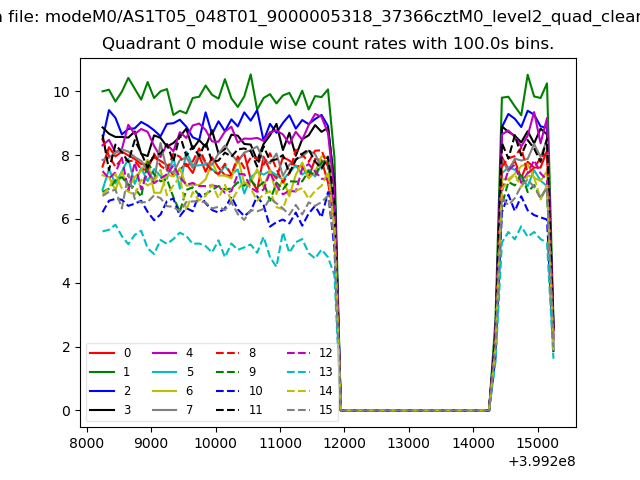 |
 |
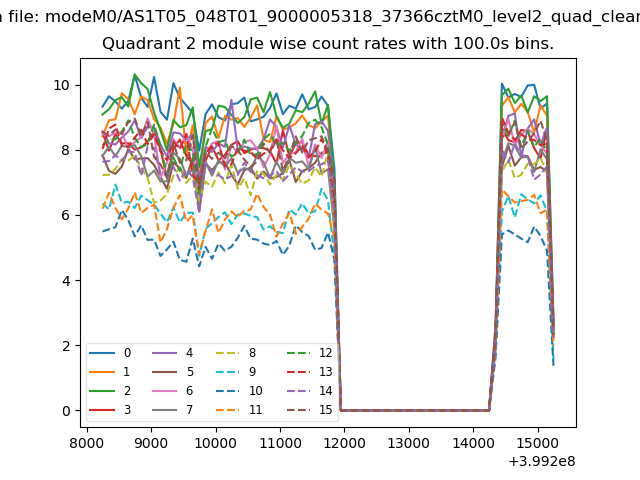
| Module-wise count rates for Quadrant B Data is divided into 100 sec bins |
 |
 |
| Module-wise count rates for Quadrant C Data is divided into 100 sec bins |
 |
 |
| Module-wise count rates for Quadrant D Data is divided into 100 sec bins |
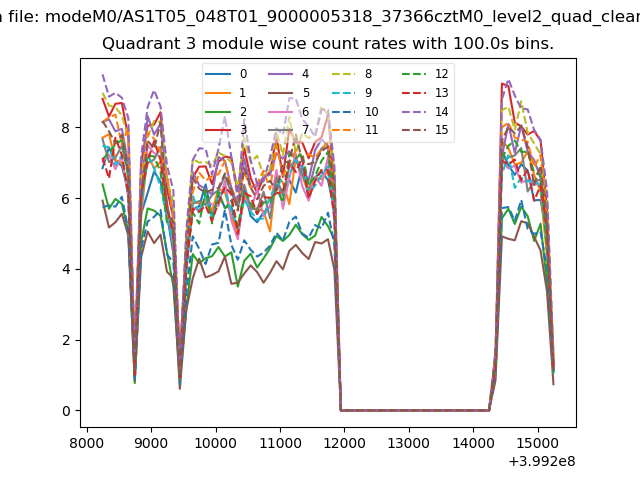 |
 |
| Parameter | Plot |
|---|---|
| CZT HV Monitor | 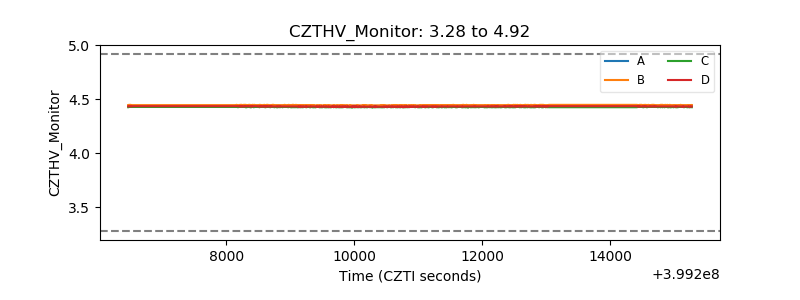 |
| D_VDD | 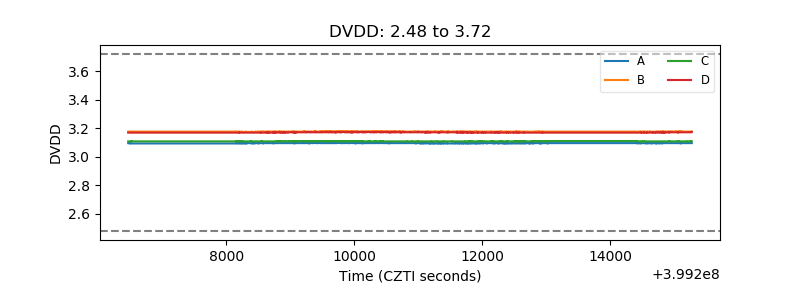 |
| Temperature 1 | 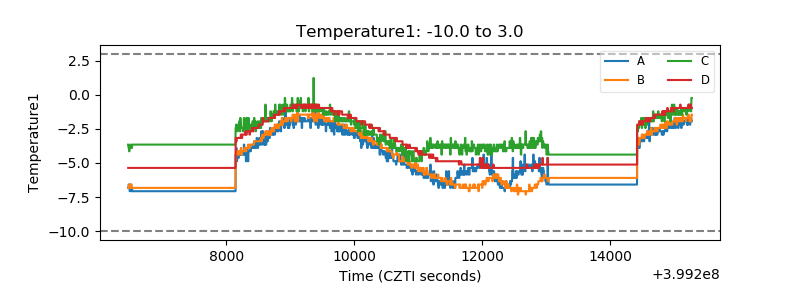 |
| Veto HV Monitor | 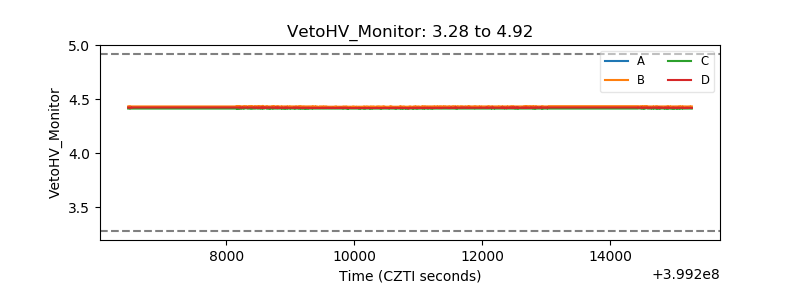 |
| Veto LLD | 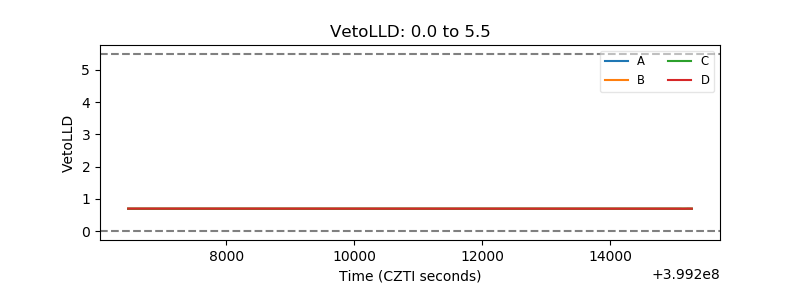 |
| Alpha Counter | 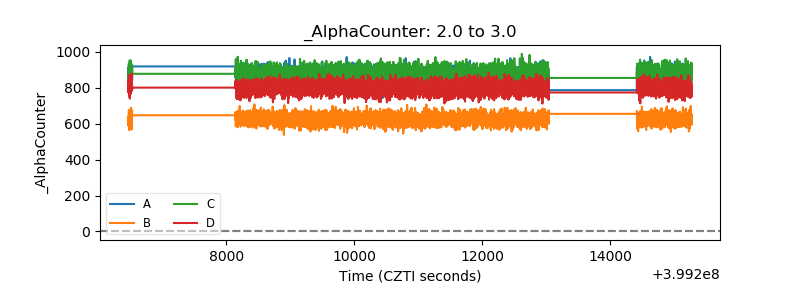 |
| _CPM_Rate | 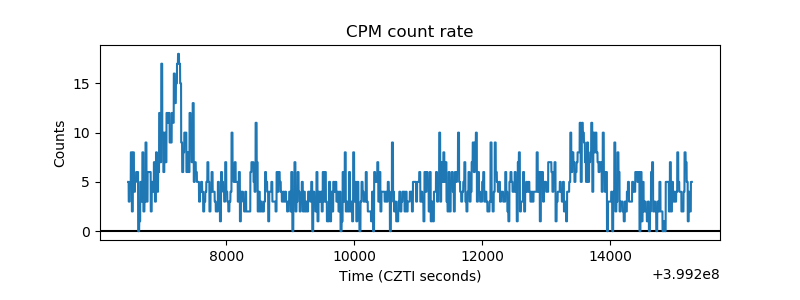 |
| CZT Counter | 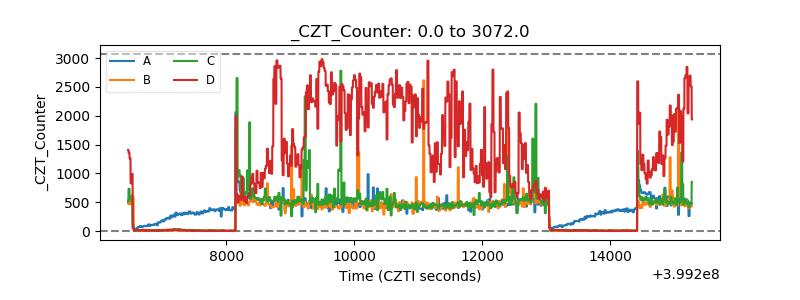 |
| +2.5 Volts monitor | 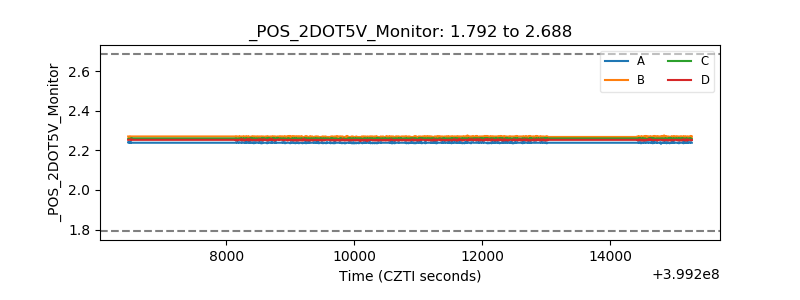 |
| +5 Volts monitor | 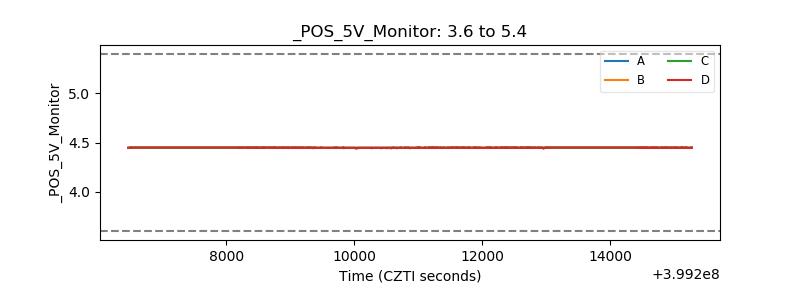 |
| _ROLL_ROT |  |
| _Roll_DEC | 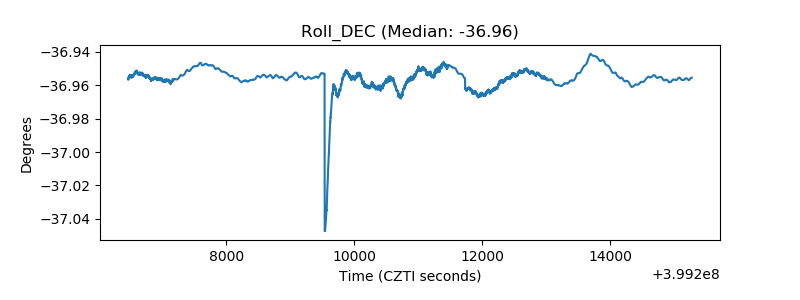 |
| _Roll_RA | 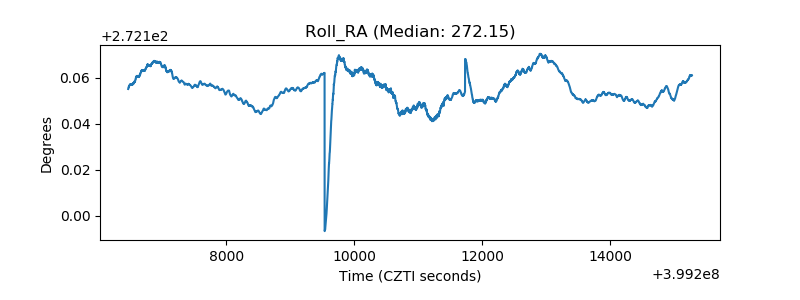 |
| Veto Counter | 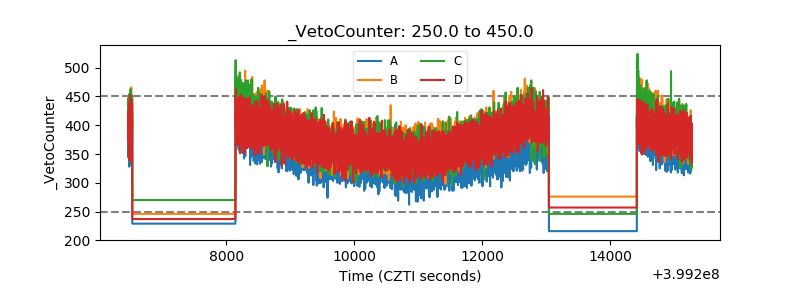 |