| Param | Original file | Final file |
|---|---|---|
| Filename | modeM0/AS1T05_048T01_9000005318_37367cztM0_level2.evt | modeM0/AS1T05_048T01_9000005318_37367cztM0_level2_quad_clean.evt |
| Size (bytes) | 671,742,720 | 78,753,600 |
| Size | 640.6 MB | 75.1 MB |
| Events in quadrant A | 2,969,247 | 522,424 |
| Events in quadrant B | 3,223,246 | 526,908 |
| Events in quadrant C | 3,129,989 | 529,702 |
| Events in quadrant D | 10,618,820 | 388,791 |
| Mode M0 | |||
|---|---|---|---|
| Quadrant | BADHDUFLAG | Total packets | Discarded packets |
| A | 0 | 12584 | 3 |
| B | 0 | 13476 | 2 |
| C | 0 | 13000 | 2 |
| D | 0 | 35687 | 2 |
| Mode SS | |||
|---|---|---|---|
| Quadrant | BADHDUFLAG | Total packets | Discarded packets |
| A | 0 | 122 | 0 |
| B | 0 | 122 | 0 |
| C | 0 | 122 | 0 |
| D | 0 | 122 | 0 |
| Mode M9 | |||
|---|---|---|---|
| Quadrant | BADHDUFLAG | Total packets | Discarded packets |
| A | 0 | 13 | 0 |
| B | 0 | 13 | 0 |
| C | 0 | 13 | 0 |
| D | 0 | 14 | 0 |
| Quadrant | Total seconds | Saturated seconds | Saturation percentage |
|---|---|---|---|
| A | 5949 | 8 | 0.134476% |
| B | 5949 | 112 | 1.882669% |
| C | 5949 | 52 | 0.874096% |
| D | 5949 | 2538 | 42.662632% |
Noise dominated data is calculated using 1-second bins in cleaned event files. If a bin has >2000 counts, and if more than 50% of those come from <1% of pixels, then it is considered to be noise-dominated and hence unusable.
| Quadrant | # 1 sec bins | Bins with >0 counts | Bins with >2000 counts | High rate bins dominated by noise | Noise dominated (total time) | Noise dominated (detector-on time) | Marked lightcurve |
|---|---|---|---|---|---|---|---|
| A | 7261 | 5950 | 5 | 5 | 0.07% | 0.08% | 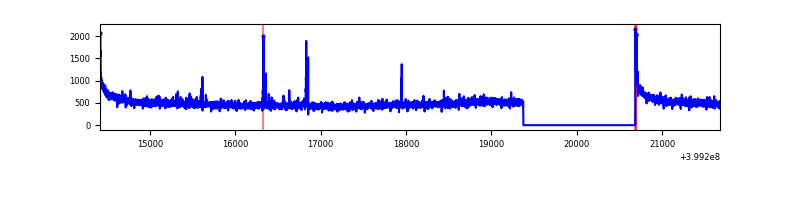 |
| B | 7261 | 5950 | 67 | 67 | 0.92% | 1.13% | 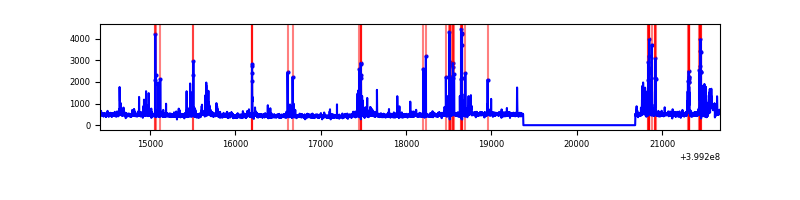 |
| C | 7261 | 5950 | 40 | 40 | 0.55% | 0.67% | 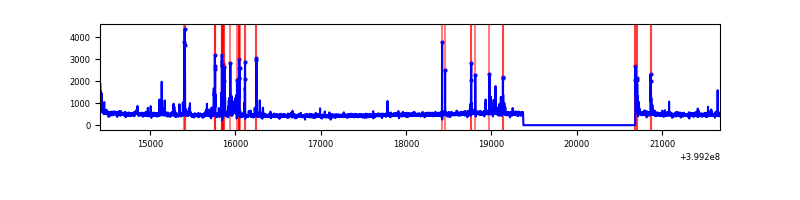 |
| D | 7261 | 5950 | 2787 | 2787 | 38.38% | 46.84% | 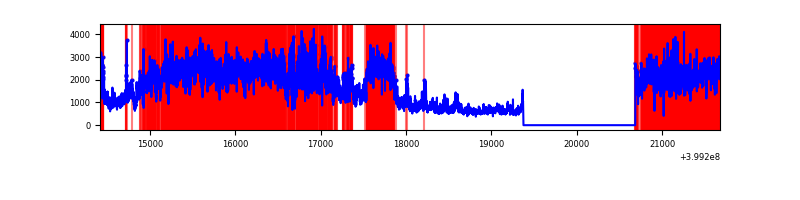 |
Top three noisy pixels from each quadrant. If the there are fewer than three noisy pixels in the level2.evt file, extra rows are filled as -1
| Pixel properties | Quadrant properties | ||||||
|---|---|---|---|---|---|---|---|
| Quadrant | DetID | PixID | Counts | Sigma | Mean | Median | Sigma |
| A | 10 | 83 | 308169 | 2249.71 | 672 | 660 | 136.7 |
| A | 13 | 6 | 20418 | 144.55 | 672 | 660 | 136.7 |
| A | 9 | 143 | 16952 | 119.19 | 672 | 660 | 136.7 |
| B | 5 | 172 | 223610 | 1727.98 | 662 | 645 | 129.0 |
| B | 5 | 255 | 142137 | 1096.56 | 662 | 645 | 129.0 |
| B | 4 | 171 | 108989 | 839.66 | 662 | 645 | 129.0 |
| C | 15 | 214 | 249596 | 1648.15 | 649 | 655 | 151.0 |
| C | 15 | 208 | 220154 | 1453.23 | 649 | 655 | 151.0 |
| C | 0 | 10 | 56462 | 369.48 | 649 | 655 | 151.0 |
| D | 12 | 235 | 6367080 | 44075.44 | 577 | 560 | 144.4 |
| D | 12 | 227 | 1144264 | 7917.87 | 577 | 560 | 144.4 |
| D | 12 | 17 | 503989 | 3485.24 | 577 | 560 | 144.4 |
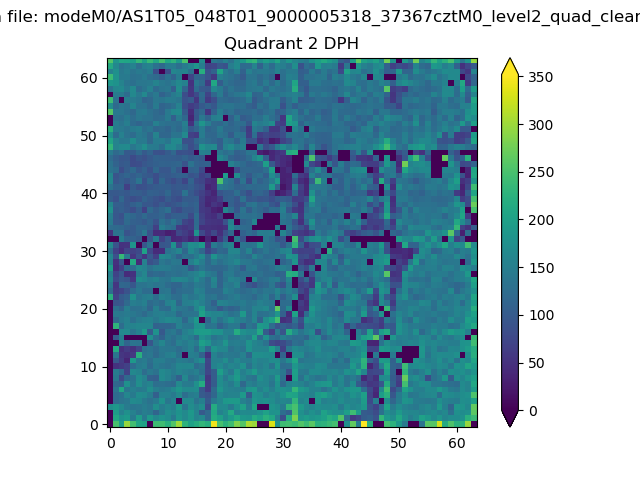
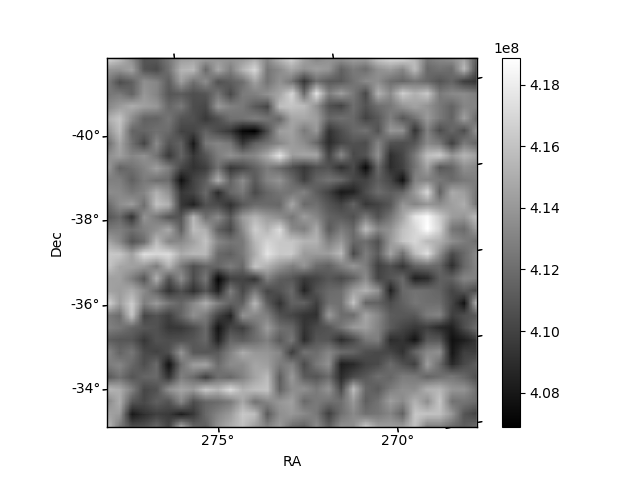
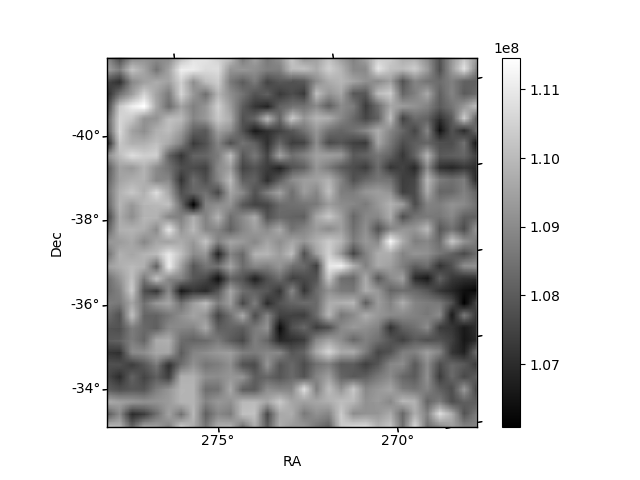
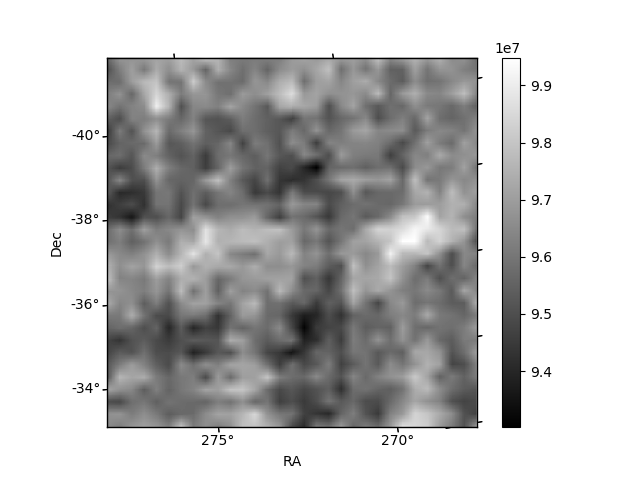
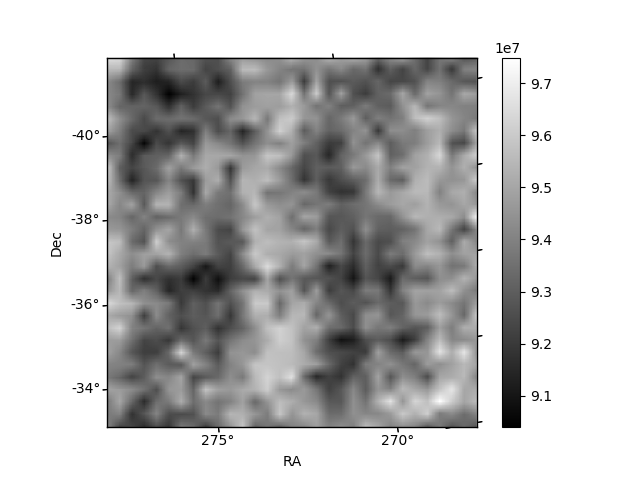
Histogram calculated using DETX and DETY for each event in the final _common_clean file
| Quadrant A | 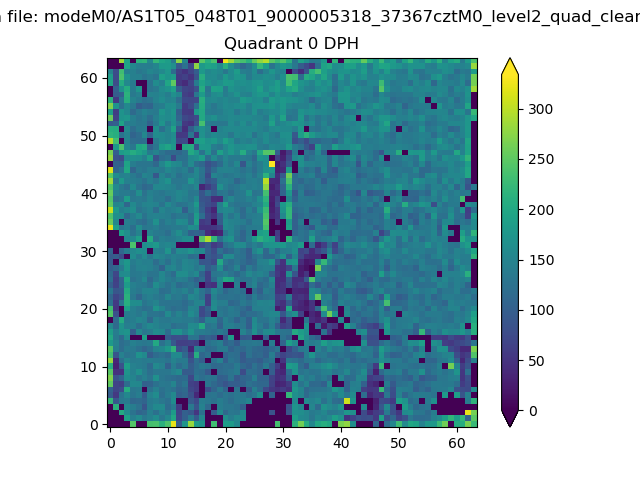 |
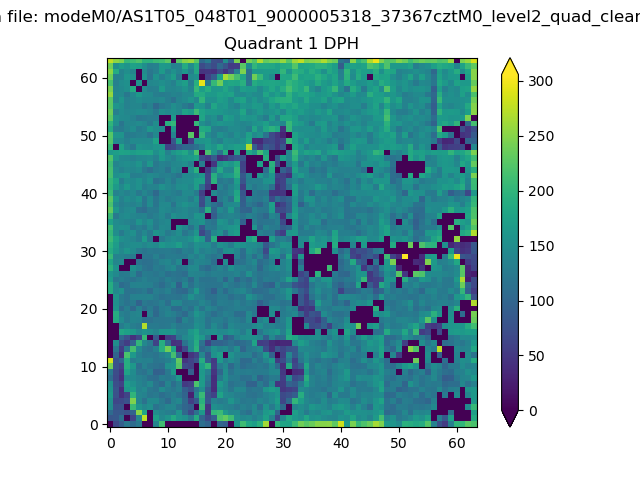 |
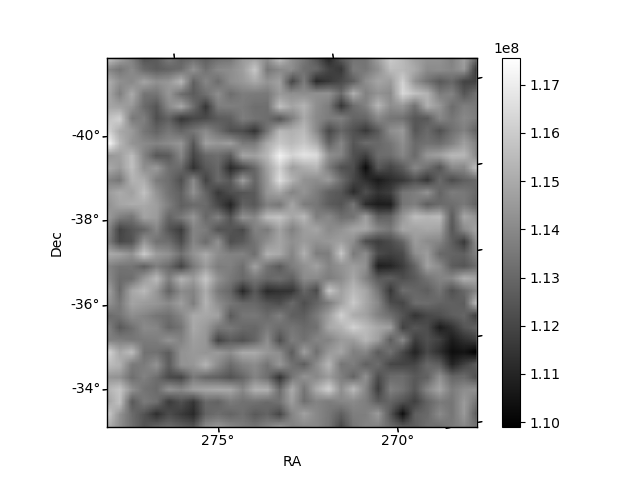
Quadrant B |
|---|---|---|---|
| Quadrant D | 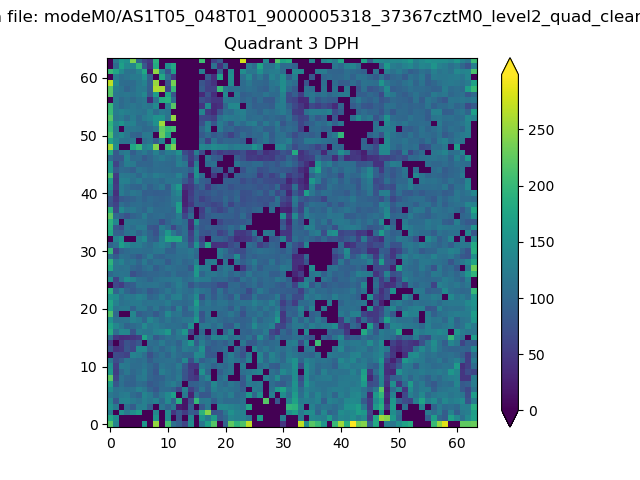 |
 |
Quadrant C |
| Plot type | Count rate plots | Images |
|---|---|---|
| Comparison with Poisson distribution Blue bars denote a histogram of data divided into 1 sec bins. Red curve is a Poisson curve with rate = median count rate of data. |
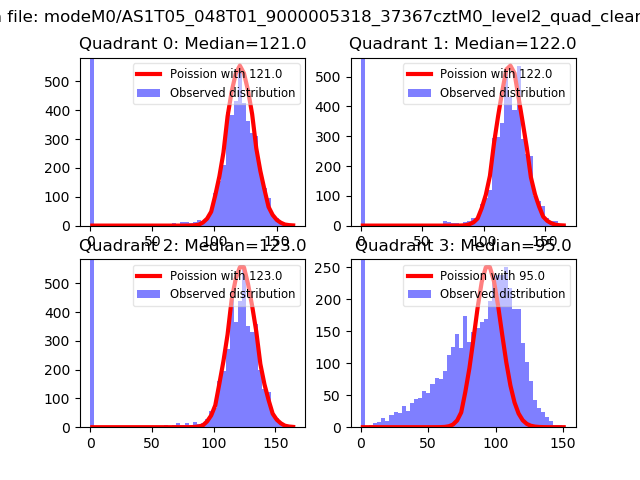 |
 |
| Quadrant-wise count rates Data is divided into 100 sec bins |
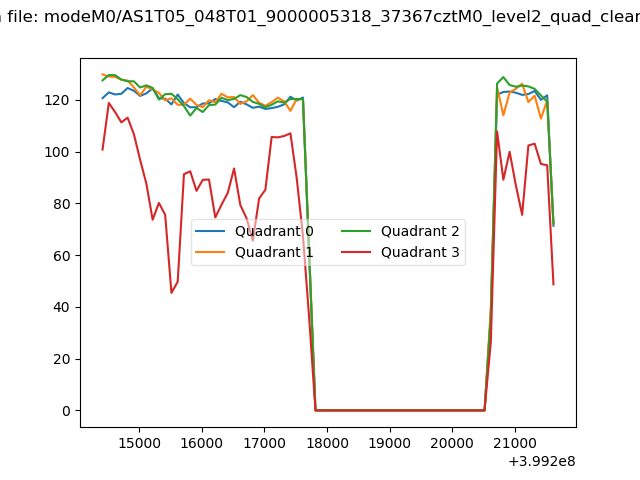 |
|
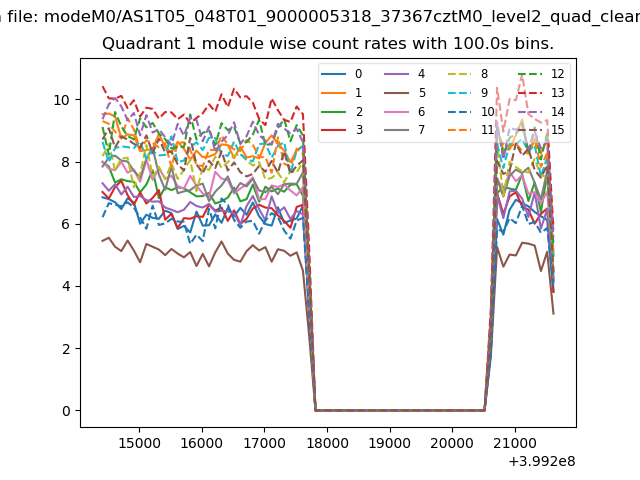
| Module-wise count rates for Quadrant A Data is divided into 100 sec bins |
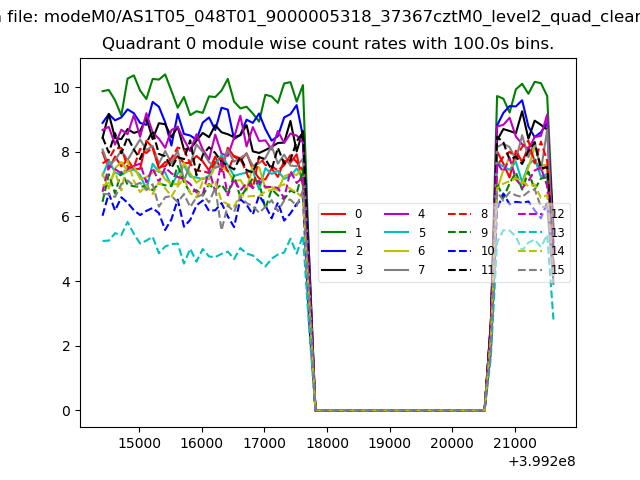 |
 |
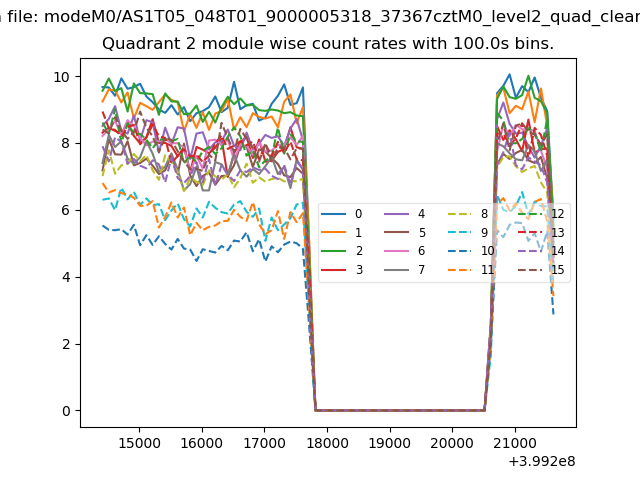
| Module-wise count rates for Quadrant B Data is divided into 100 sec bins |
 |
 |
| Module-wise count rates for Quadrant C Data is divided into 100 sec bins |
 |
 |
| Module-wise count rates for Quadrant D Data is divided into 100 sec bins |
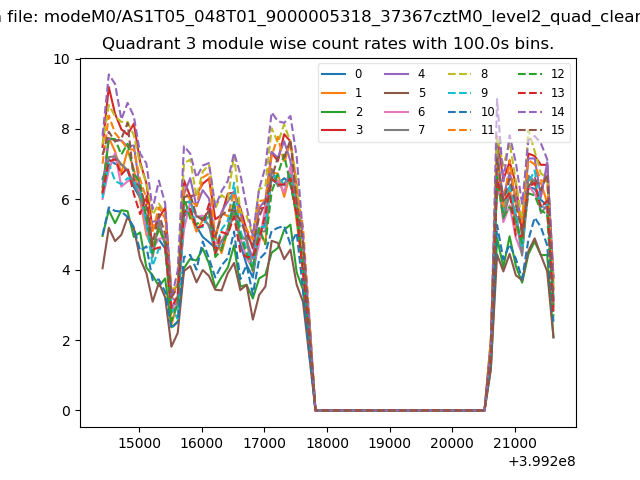 |
 |
| Parameter | Plot |
|---|---|
| CZT HV Monitor | 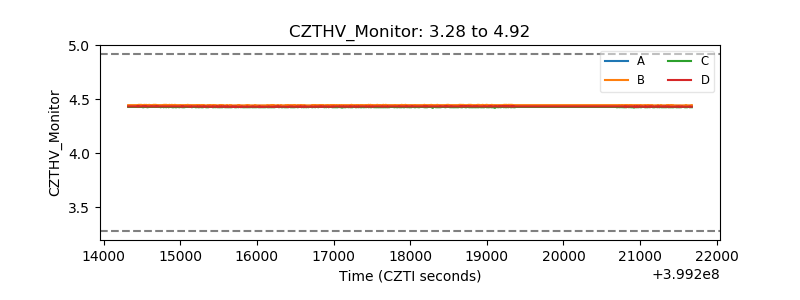 |
| D_VDD | 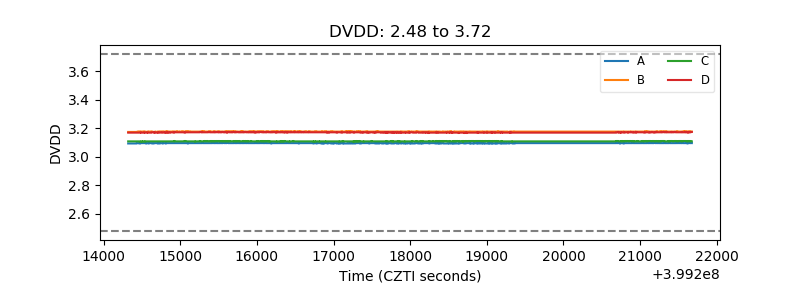 |
| Temperature 1 | 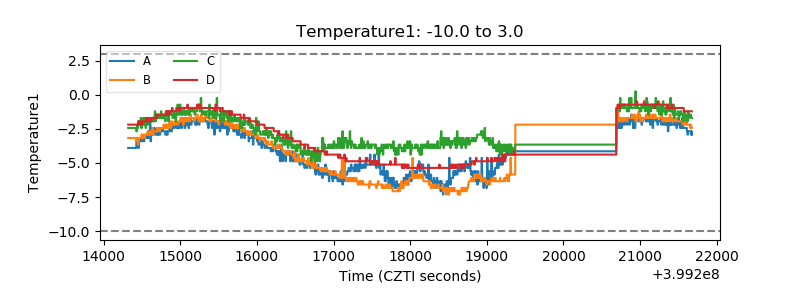 |
| Veto HV Monitor | 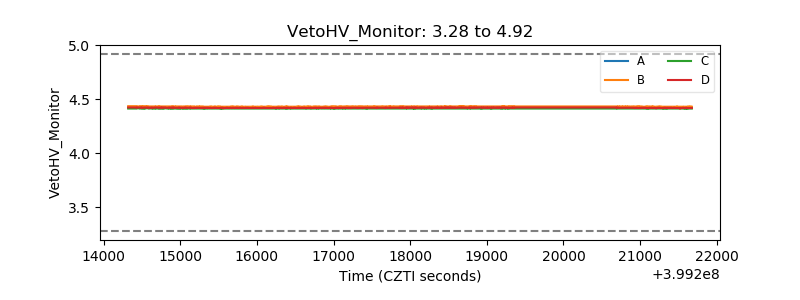 |
| Veto LLD | 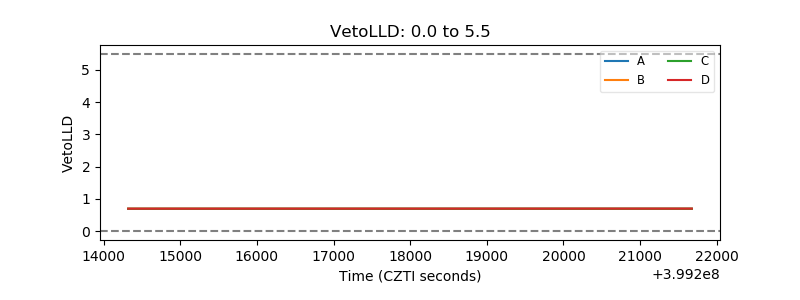 |
| Alpha Counter | 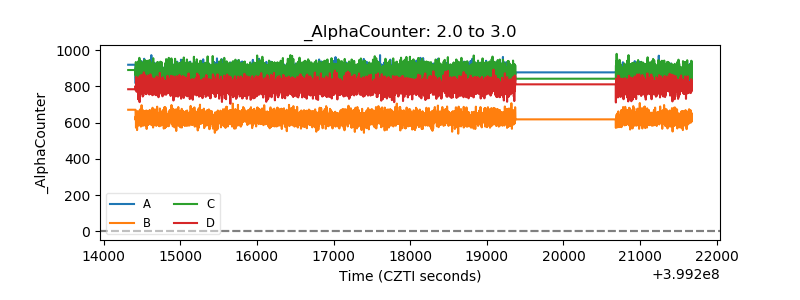 |
| _CPM_Rate | 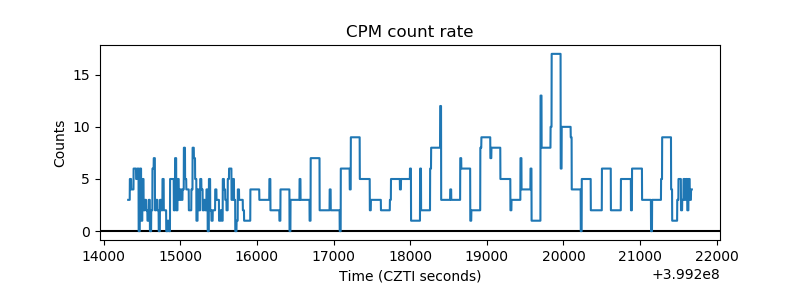 |
| CZT Counter | 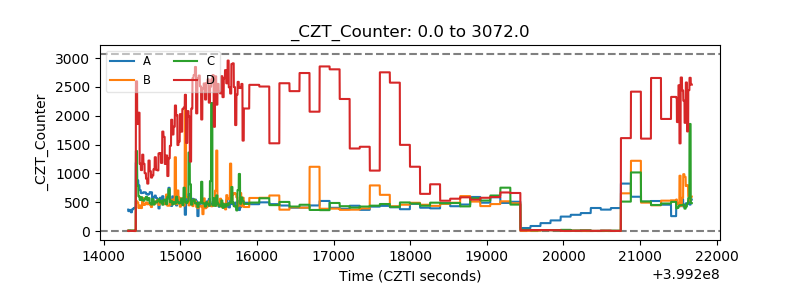 |
| +2.5 Volts monitor | 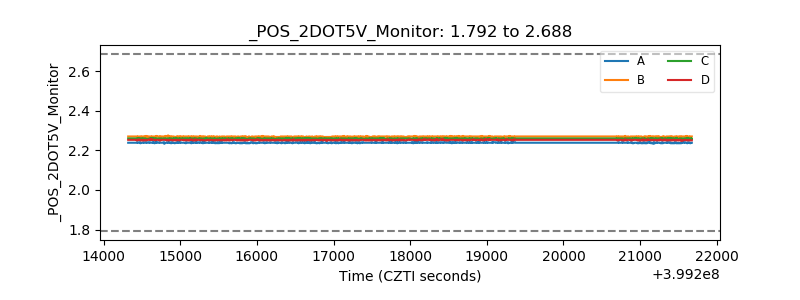 |
| +5 Volts monitor | 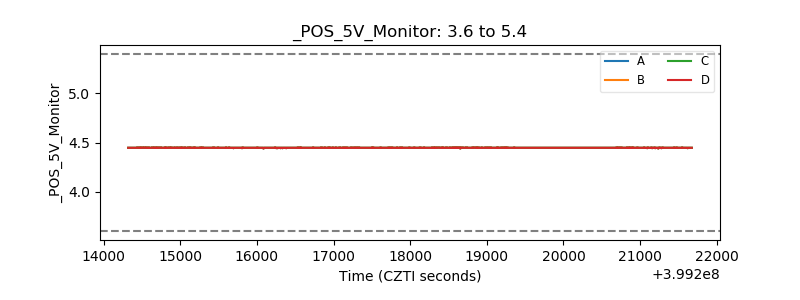 |
| _ROLL_ROT | 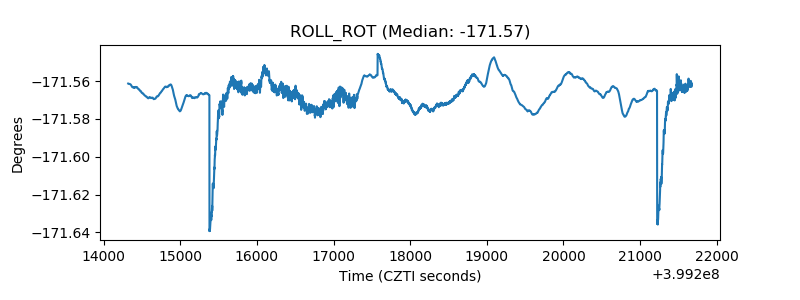 |
| _Roll_DEC |  |
| _Roll_RA | 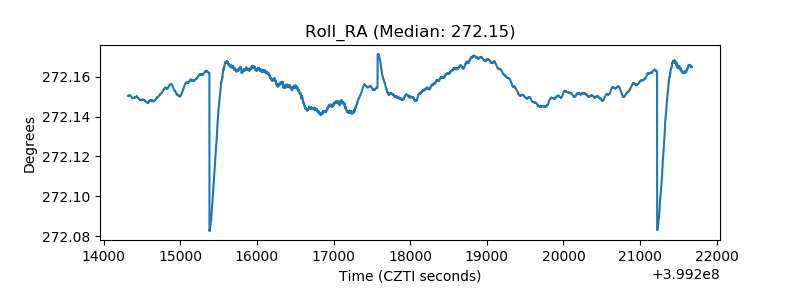 |
| Veto Counter | 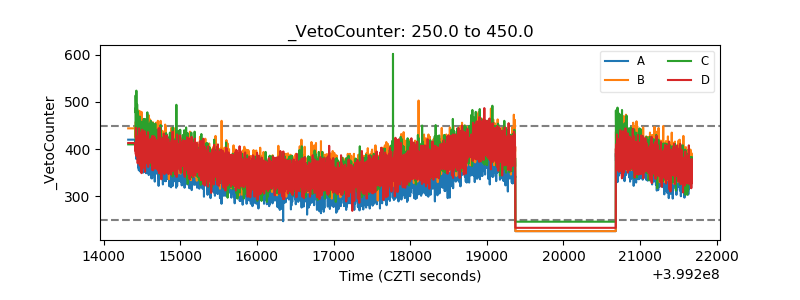 |