| Param | Original file | Final file |
|---|---|---|
| Filename | modeM0/AS1T05_048T01_9000005318_37369cztM0_level2.evt | modeM0/AS1T05_048T01_9000005318_37369cztM0_level2_quad_clean.evt |
| Size (bytes) | 1,088,913,600 | 120,303,360 |
| Size | 1.0 GB | 114.7 MB |
| Events in quadrant A | 5,178,389 | 767,144 |
| Events in quadrant B | 6,828,326 | 752,944 |
| Events in quadrant C | 5,281,711 | 771,855 |
| Events in quadrant D | 14,973,857 | 614,551 |
| Mode M0 | |||
|---|---|---|---|
| Quadrant | BADHDUFLAG | Total packets | Discarded packets |
| A | 0 | 22236 | 3 |
| B | 0 | 27213 | 2 |
| C | 0 | 22442 | 2 |
| D | 0 | 51706 | 2 |
| Mode SS | |||
|---|---|---|---|
| Quadrant | BADHDUFLAG | Total packets | Discarded packets |
| A | 0 | 214 | 0 |
| B | 0 | 214 | 0 |
| C | 0 | 214 | 0 |
| D | 0 | 214 | 0 |
| Mode M9 | |||
|---|---|---|---|
| Quadrant | BADHDUFLAG | Total packets | Discarded packets |
| A | 0 | 29 | 0 |
| B | 0 | 29 | 0 |
| C | 0 | 29 | 0 |
| D | 0 | 29 | 0 |
| Quadrant | Total seconds | Saturated seconds | Saturation percentage |
|---|---|---|---|
| A | 10628 | 11 | 0.103500% |
| B | 10628 | 357 | 3.359052% |
| C | 10628 | 53 | 0.498683% |
| D | 10628 | 2677 | 25.188182% |
Noise dominated data is calculated using 1-second bins in cleaned event files. If a bin has >2000 counts, and if more than 50% of those come from <1% of pixels, then it is considered to be noise-dominated and hence unusable.
| Quadrant | # 1 sec bins | Bins with >0 counts | Bins with >2000 counts | High rate bins dominated by noise | Noise dominated (total time) | Noise dominated (detector-on time) | Marked lightcurve |
|---|---|---|---|---|---|---|---|
| A | 13404 | 10630 | 3 | 3 | 0.02% | 0.03% | 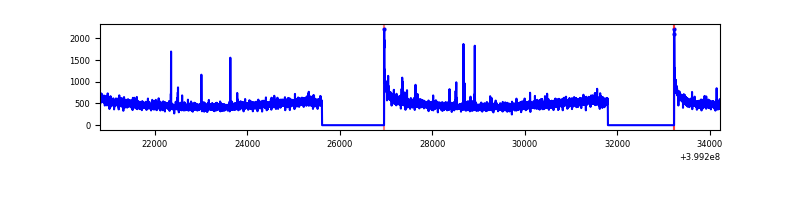 |
| B | 13404 | 10630 | 277 | 277 | 2.07% | 2.61% | 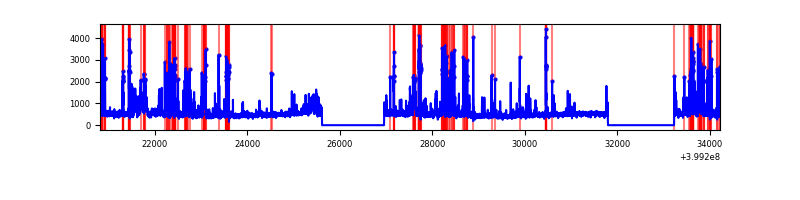 |
| C | 13404 | 10630 | 46 | 46 | 0.34% | 0.43% | 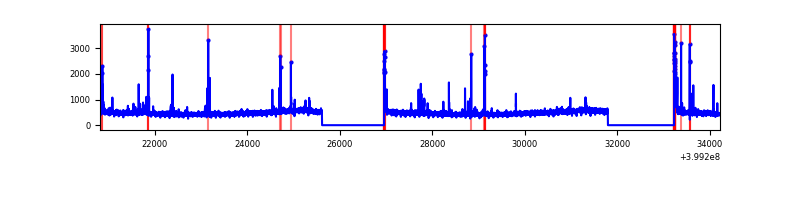 |
| D | 13404 | 10630 | 2986 | 2986 | 22.28% | 28.09% | 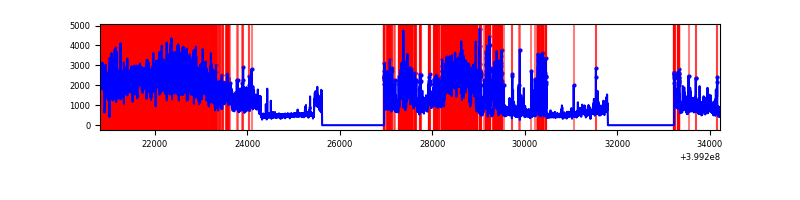 |
Top three noisy pixels from each quadrant. If the there are fewer than three noisy pixels in the level2.evt file, extra rows are filled as -1
| Pixel properties | Quadrant properties | ||||||
|---|---|---|---|---|---|---|---|
| Quadrant | DetID | PixID | Counts | Sigma | Mean | Median | Sigma |
| A | 10 | 83 | 486753 | 2013.88 | 1189 | 1165 | 241.1 |
| A | 13 | 248 | 35615 | 142.87 | 1189 | 1165 | 241.1 |
| A | 13 | 6 | 28195 | 112.1 | 1189 | 1165 | 241.1 |
| B | 4 | 171 | 631878 | 2801.11 | 1175 | 1146 | 225.2 |
| B | 5 | 172 | 521374 | 2310.36 | 1175 | 1146 | 225.2 |
| B | 15 | 35 | 395247 | 1750.22 | 1175 | 1146 | 225.2 |
| C | 15 | 214 | 444294 | 1647.28 | 1158 | 1167 | 269.0 |
| C | 14 | 254 | 118209 | 435.09 | 1158 | 1167 | 269.0 |
| C | 0 | 10 | 110188 | 405.27 | 1158 | 1167 | 269.0 |
| D | 12 | 235 | 8676154 | 33261.18 | 1071 | 1040 | 260.8 |
| D | 2 | 249 | 987291 | 3781.37 | 1071 | 1040 | 260.8 |
| D | 12 | 227 | 417244 | 1595.76 | 1071 | 1040 | 260.8 |
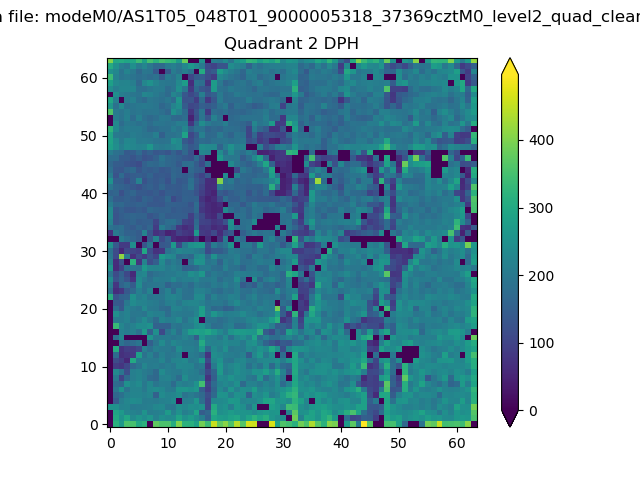
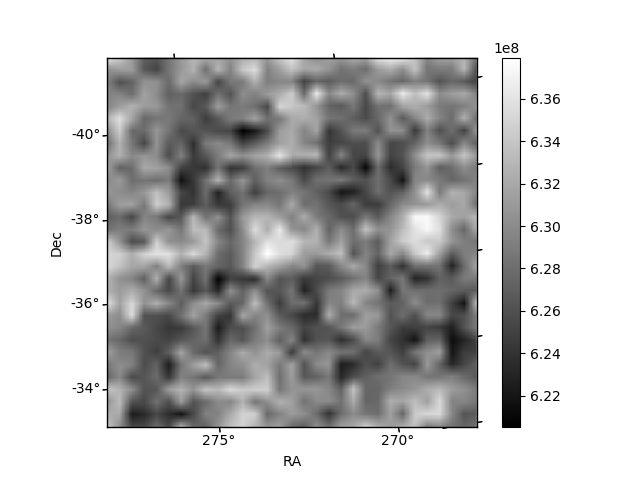
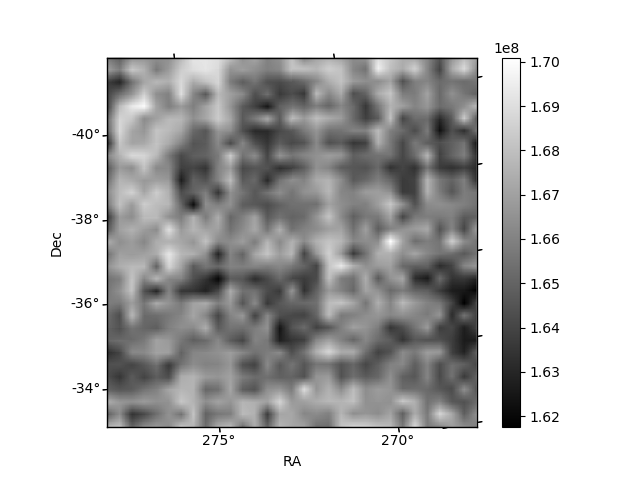
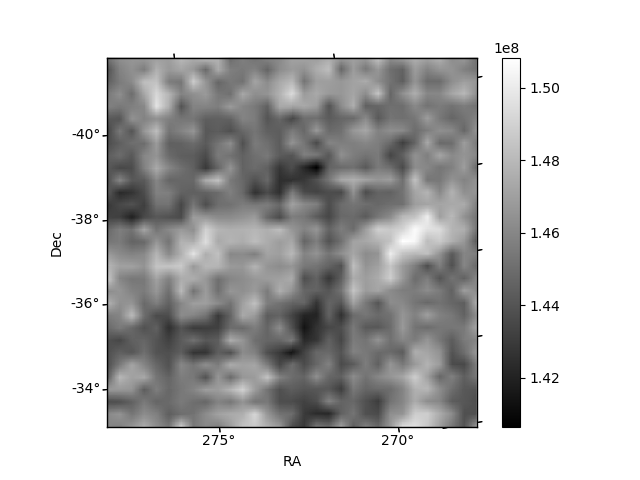
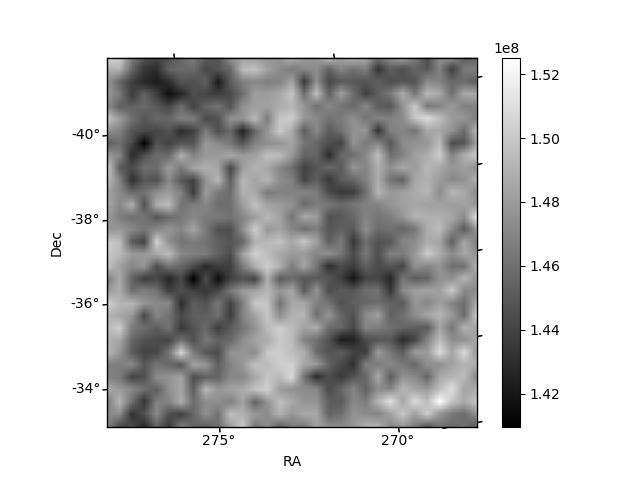
Histogram calculated using DETX and DETY for each event in the final _common_clean file
| Quadrant A | 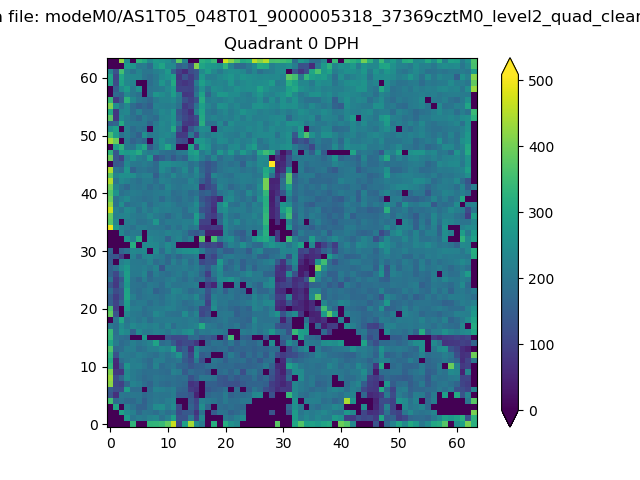 |
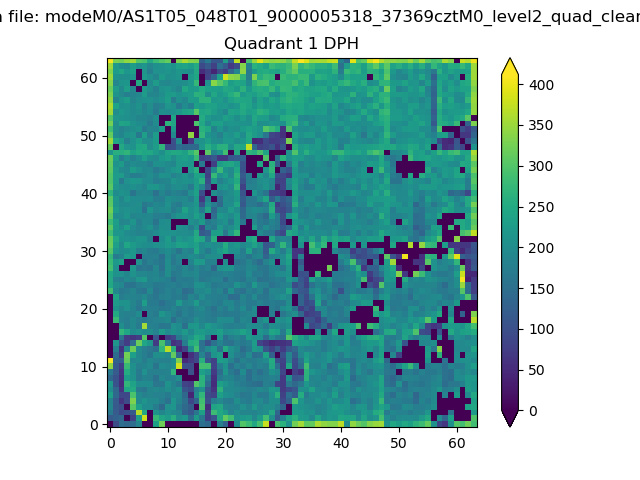 |
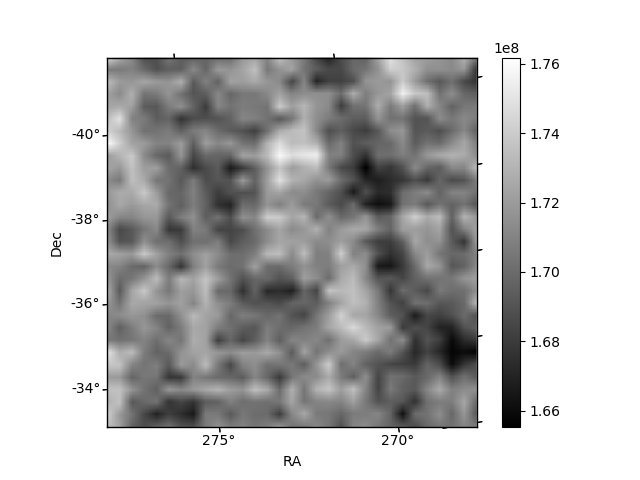
Quadrant B |
|---|---|---|---|
| Quadrant D | 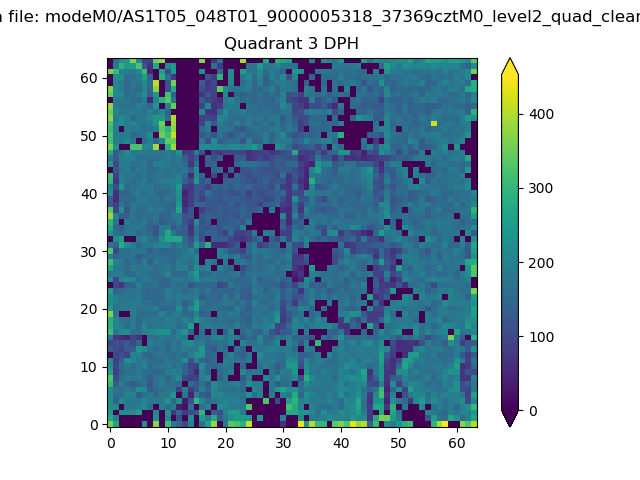 |
 |
Quadrant C |
| Plot type | Count rate plots | Images |
|---|---|---|
| Comparison with Poisson distribution Blue bars denote a histogram of data divided into 1 sec bins. Red curve is a Poisson curve with rate = median count rate of data. |
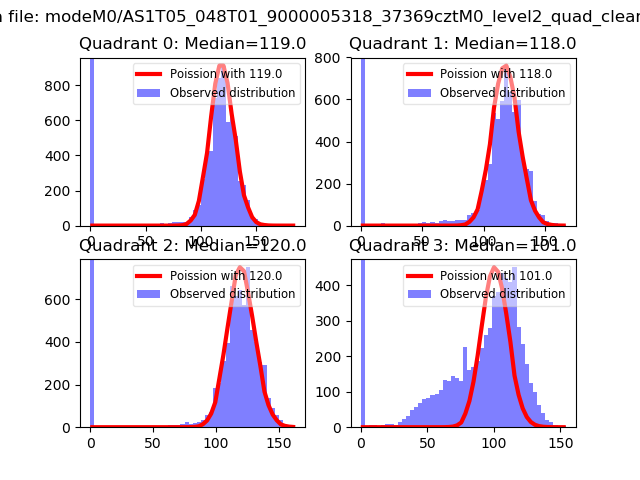 |
 |
| Quadrant-wise count rates Data is divided into 100 sec bins |
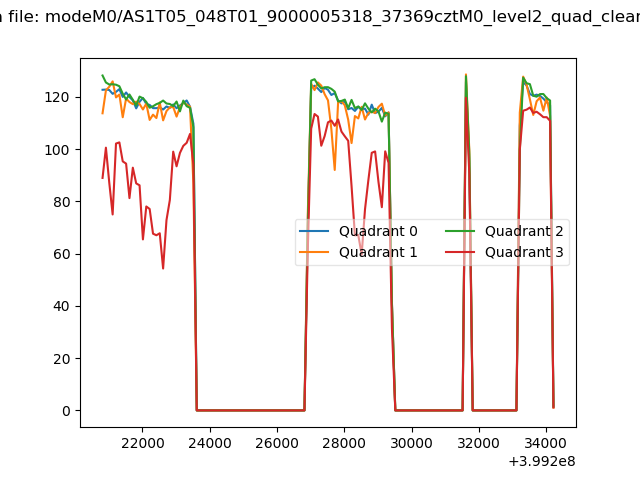 |
|
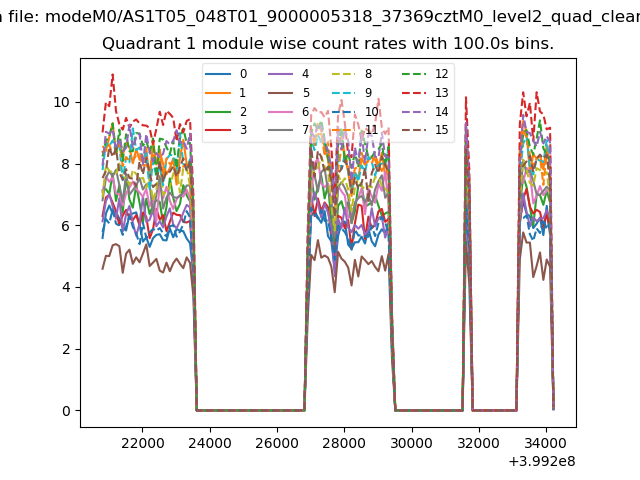
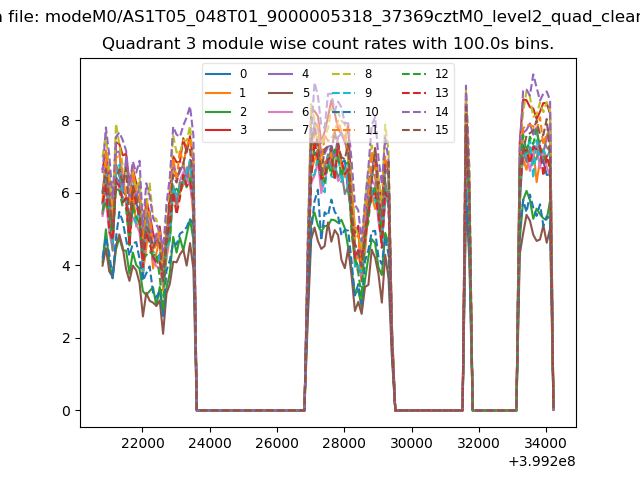
| Module-wise count rates for Quadrant A Data is divided into 100 sec bins |
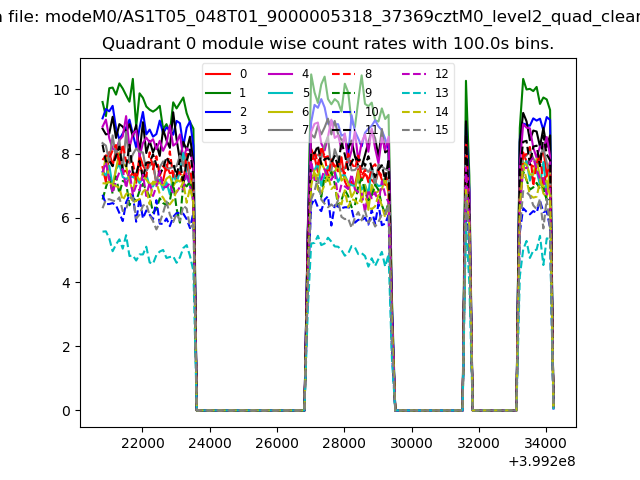 |
 |
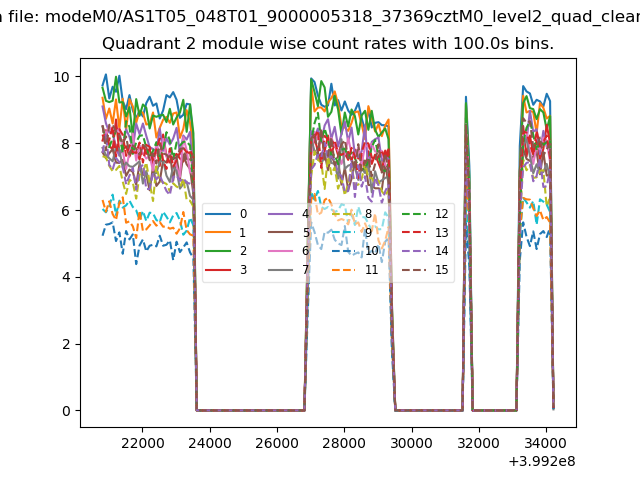
| Module-wise count rates for Quadrant B Data is divided into 100 sec bins |
 |
 |
| Module-wise count rates for Quadrant C Data is divided into 100 sec bins |
 |
 |
| Module-wise count rates for Quadrant D Data is divided into 100 sec bins |
 |
 |
| Parameter | Plot |
|---|---|
| CZT HV Monitor | 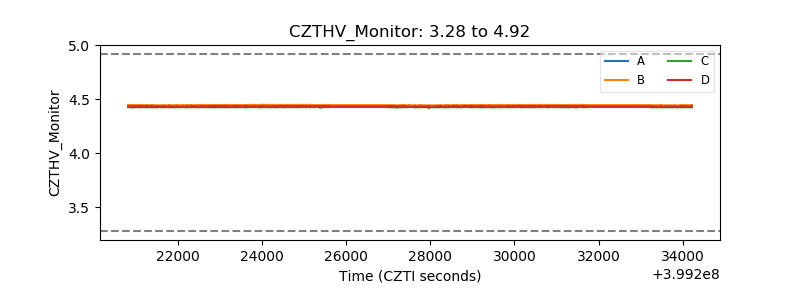 |
| D_VDD | 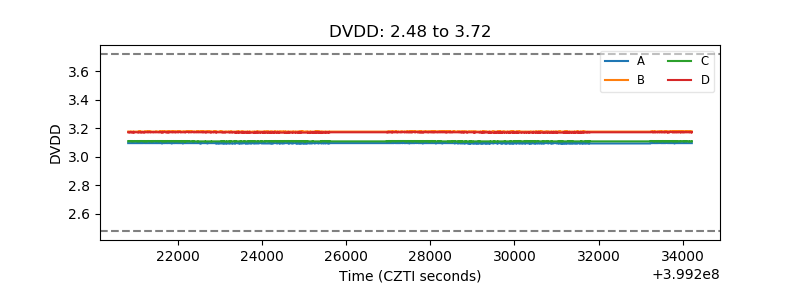 |
| Temperature 1 | 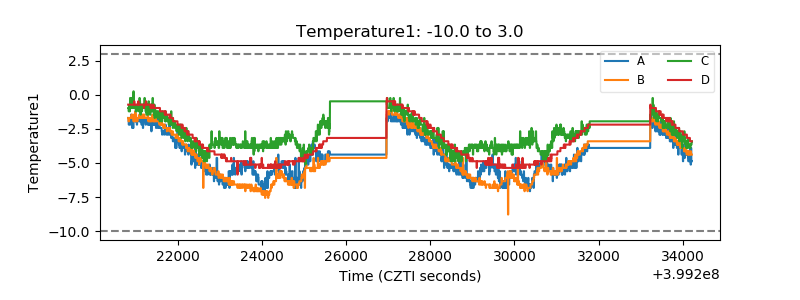 |
| Veto HV Monitor | 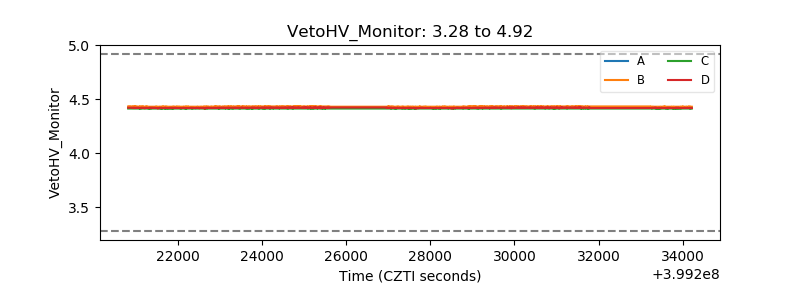 |
| Veto LLD | 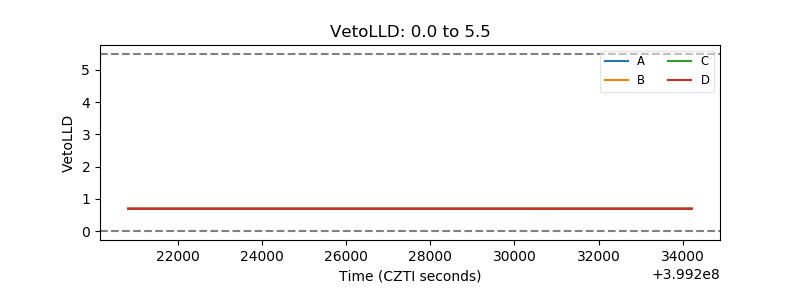 |
| Alpha Counter | 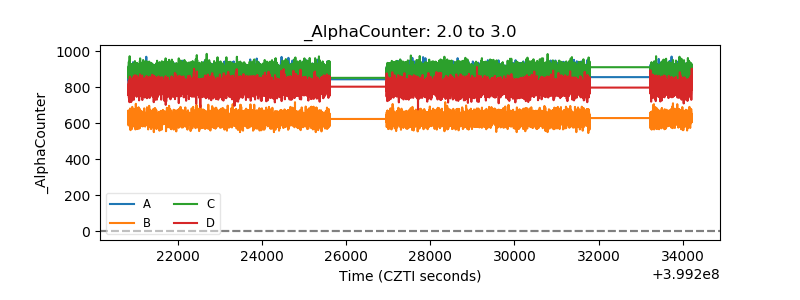 |
| _CPM_Rate | 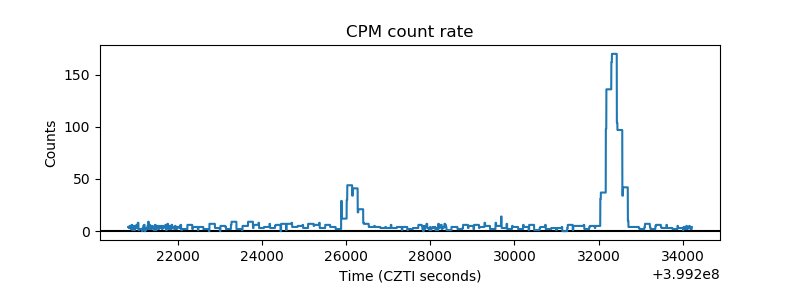 |
| CZT Counter | 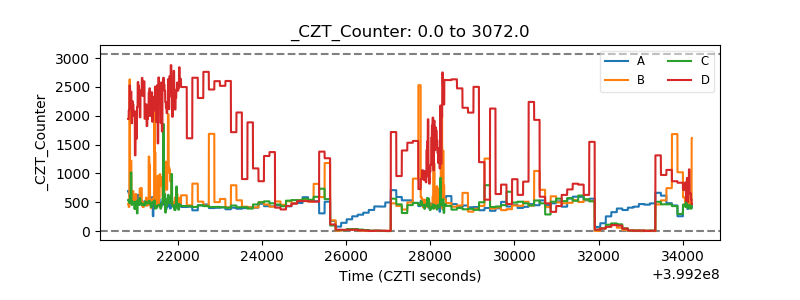 |
| +2.5 Volts monitor | 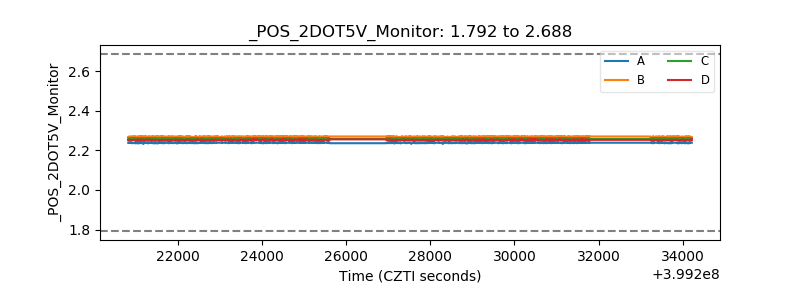 |
| +5 Volts monitor | 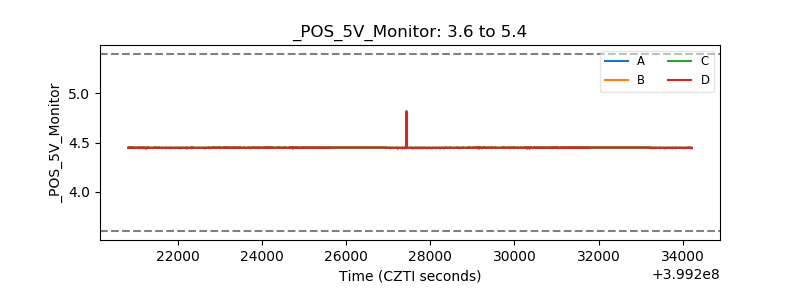 |
| _ROLL_ROT | 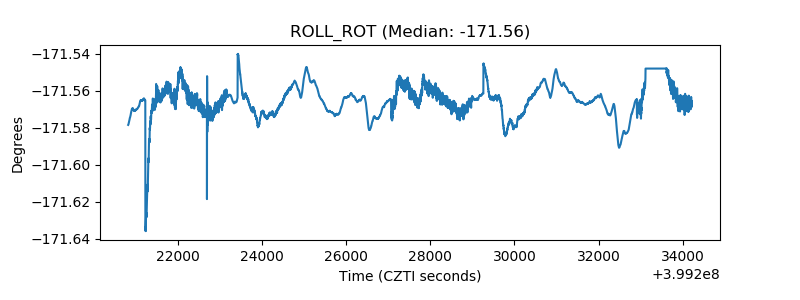 |
| _Roll_DEC |  |
| _Roll_RA | 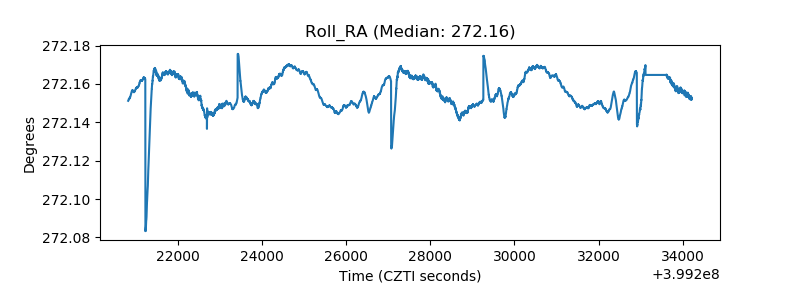 |
| Veto Counter | 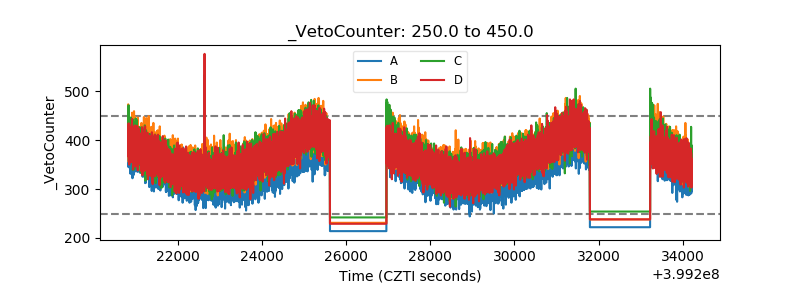 |