| Param | Original file | Final file |
|---|---|---|
| Filename | modeM0/AS1T05_048T01_9000005318_37371cztM0_level2.evt | modeM0/AS1T05_048T01_9000005318_37371cztM0_level2_quad_clean.evt |
| Size (bytes) | 411,160,320 | 63,662,400 |
| Size | 392.1 MB | 60.7 MB |
| Events in quadrant A | 2,671,755 | 391,729 |
| Events in quadrant B | 2,763,634 | 401,612 |
| Events in quadrant C | 2,670,143 | 399,786 |
| Events in quadrant D | 3,986,911 | 363,899 |
| Mode M0 | |||
|---|---|---|---|
| Quadrant | BADHDUFLAG | Total packets | Discarded packets |
| A | 0 | 11457 | 115 |
| B | 0 | 11774 | 121 |
| C | 0 | 11306 | 92 |
| D | 0 | 15767 | 321 |
| Mode SS | |||
|---|---|---|---|
| Quadrant | BADHDUFLAG | Total packets | Discarded packets |
| A | 0 | 110 | 0 |
| B | 0 | 107 | 1 |
| C | 0 | 109 | 0 |
| D | 0 | 109 | 0 |
| Mode M9 | |||
|---|---|---|---|
| Quadrant | BADHDUFLAG | Total packets | Discarded packets |
| A | 0 | 25 | 0 |
| B | 0 | 26 | 0 |
| C | 0 | 26 | 0 |
| D | 0 | 27 | 0 |
| Quadrant | Total seconds | Saturated seconds | Saturation percentage |
|---|---|---|---|
| A | 5298 | 26 | 0.490751% |
| B | 5301 | 51 | 0.962083% |
| C | 5303 | 36 | 0.678861% |
| D | 5266 | 142 | 2.696544% |
Noise dominated data is calculated using 1-second bins in cleaned event files. If a bin has >2000 counts, and if more than 50% of those come from <1% of pixels, then it is considered to be noise-dominated and hence unusable.
| Quadrant | # 1 sec bins | Bins with >0 counts | Bins with >2000 counts | High rate bins dominated by noise | Noise dominated (total time) | Noise dominated (detector-on time) | Marked lightcurve |
|---|---|---|---|---|---|---|---|
| A | 7038 | 5349 | 15 | 15 | 0.21% | 0.28% | 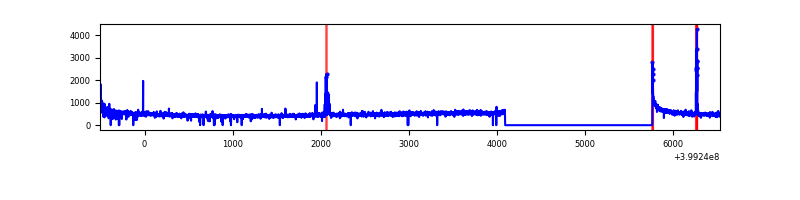 |
| B | 7038 | 5346 | 35 | 35 | 0.50% | 0.65% | 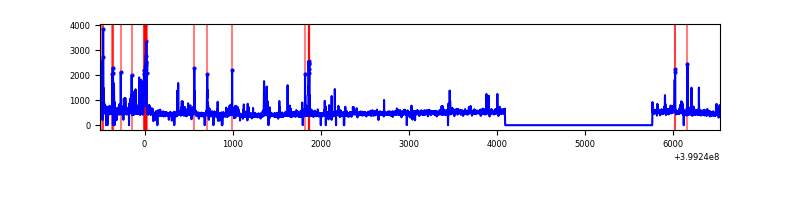 |
| C | 7038 | 5344 | 28 | 28 | 0.40% | 0.52% | 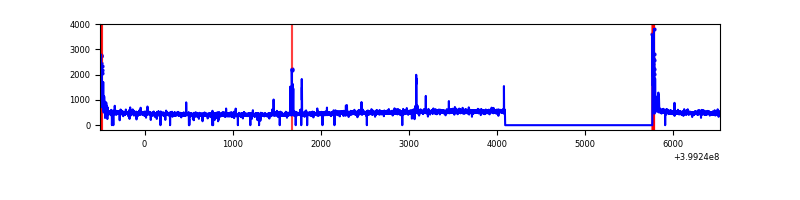 |
| D | 7038 | 5335 | 147 | 147 | 2.09% | 2.76% |  |
Top three noisy pixels from each quadrant. If the there are fewer than three noisy pixels in the level2.evt file, extra rows are filled as -1
| Pixel properties | Quadrant properties | ||||||
|---|---|---|---|---|---|---|---|
| Quadrant | DetID | PixID | Counts | Sigma | Mean | Median | Sigma |
| A | 10 | 83 | 275429 | 2277.76 | 594 | 582 | 120.7 |
| A | 13 | 248 | 65714 | 539.77 | 594 | 582 | 120.7 |
| A | 13 | 6 | 19503 | 156.81 | 594 | 582 | 120.7 |
| B | 5 | 172 | 129251 | 1117.25 | 597 | 583 | 115.2 |
| B | 4 | 171 | 71590 | 616.57 | 597 | 583 | 115.2 |
| B | 0 | 213 | 58120 | 499.6 | 597 | 583 | 115.2 |
| C | 15 | 214 | 224177 | 1634.35 | 582 | 587 | 136.8 |
| C | 0 | 10 | 98832 | 718.13 | 582 | 587 | 136.8 |
| C | 14 | 254 | 53218 | 384.71 | 582 | 587 | 136.8 |
| D | 12 | 235 | 1025711 | 7463.1 | 567 | 553 | 137.4 |
| D | 2 | 249 | 408520 | 2969.98 | 567 | 553 | 137.4 |
| D | 12 | 227 | 164538 | 1193.8 | 567 | 553 | 137.4 |
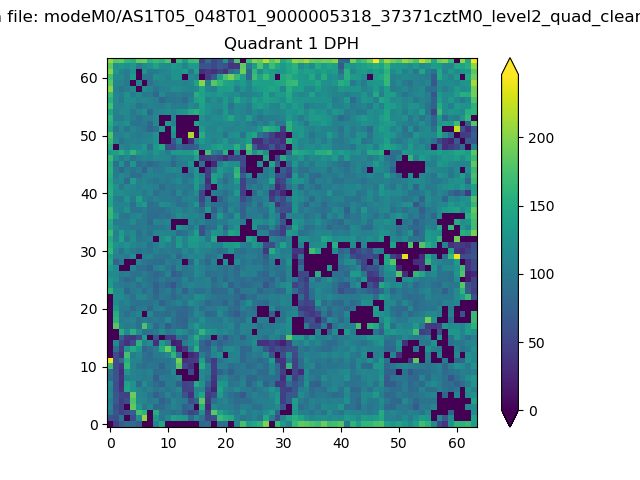
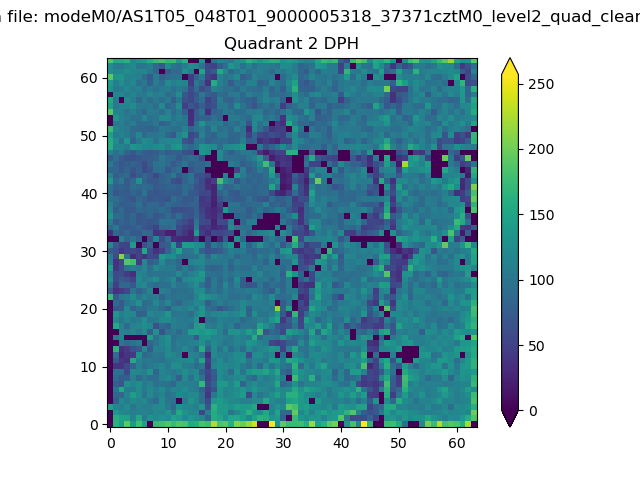
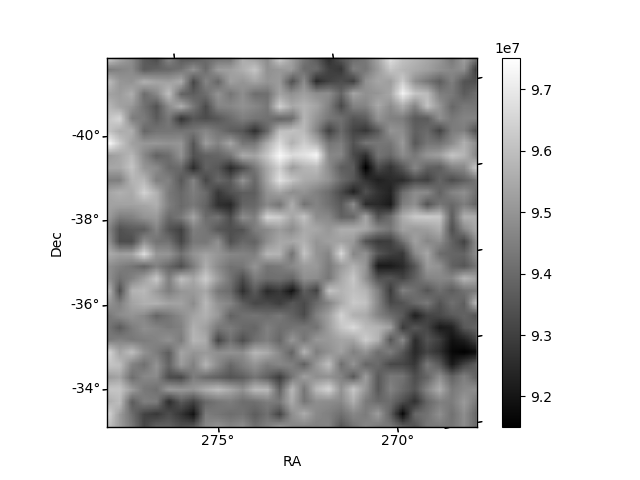
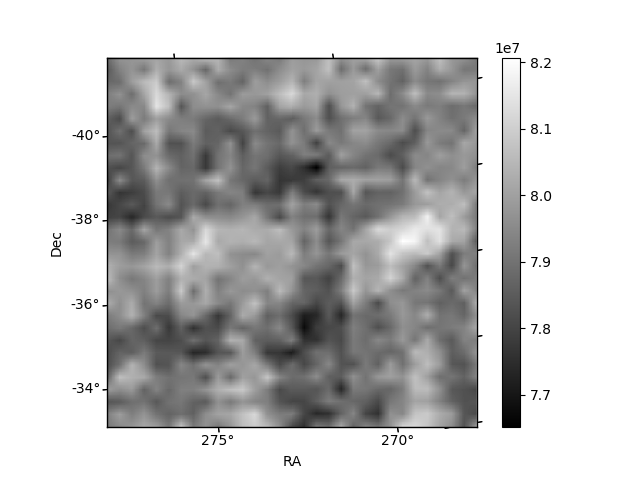
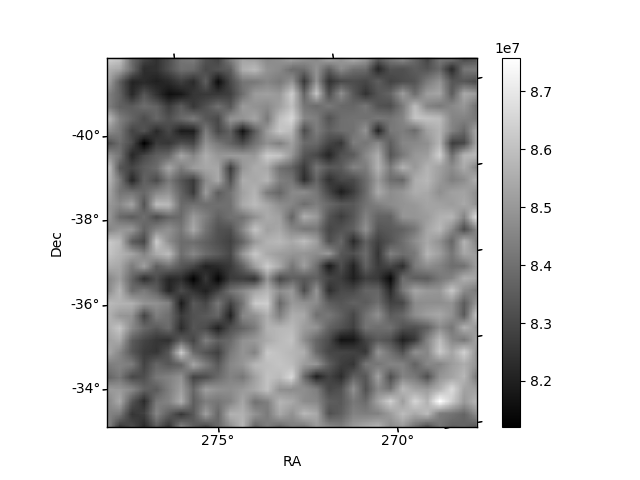
Histogram calculated using DETX and DETY for each event in the final _common_clean file
| Quadrant A |  |
 |
Quadrant B |
|---|---|---|---|
| Quadrant D | 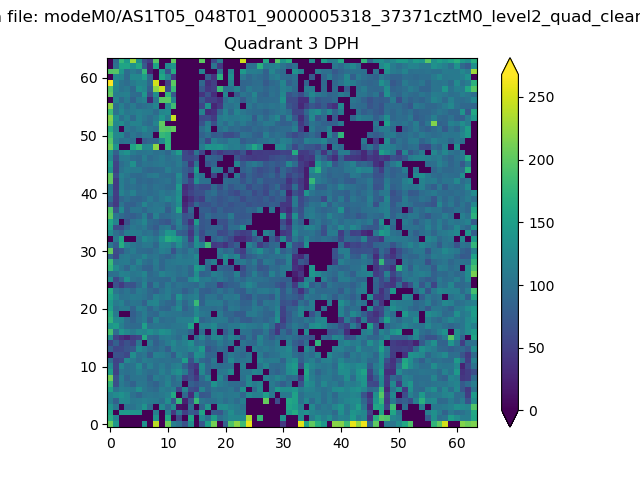 |
 |
Quadrant C |
| Plot type | Count rate plots | Images |
|---|---|---|
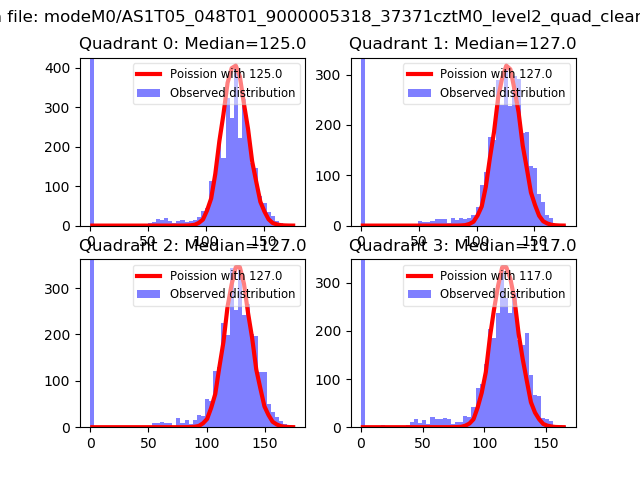
| Comparison with Poisson distribution Blue bars denote a histogram of data divided into 1 sec bins. Red curve is a Poisson curve with rate = median count rate of data. |
 |
 |
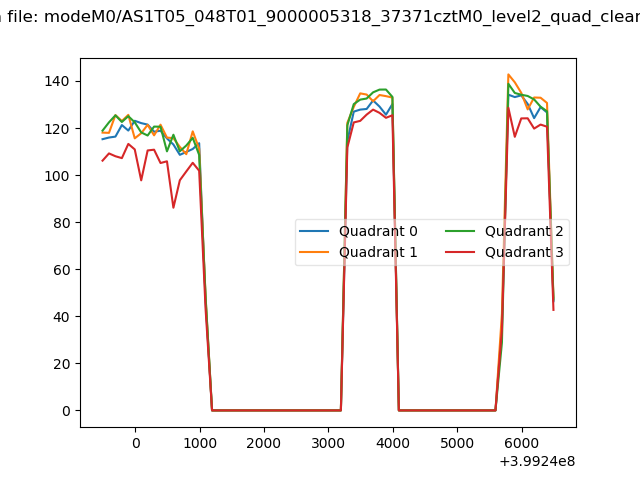
| Quadrant-wise count rates Data is divided into 100 sec bins |
 |
|
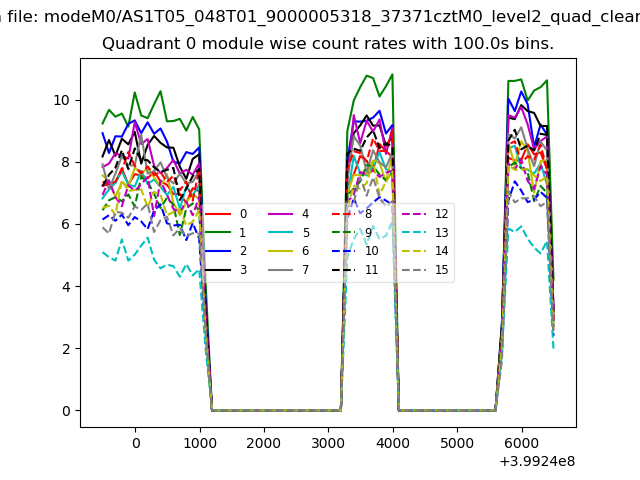
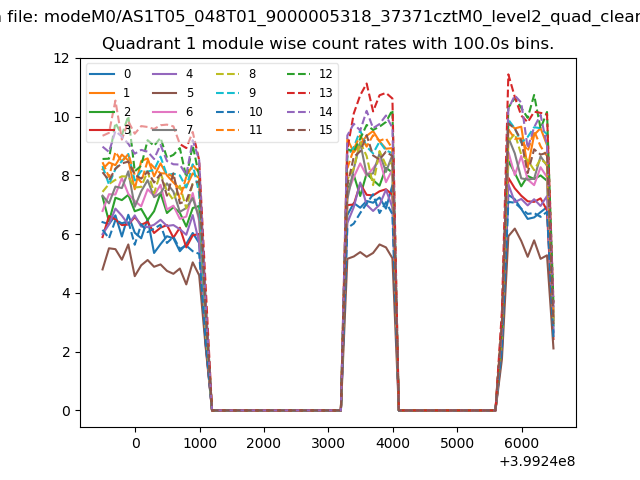
| Module-wise count rates for Quadrant A Data is divided into 100 sec bins |
 |
 |
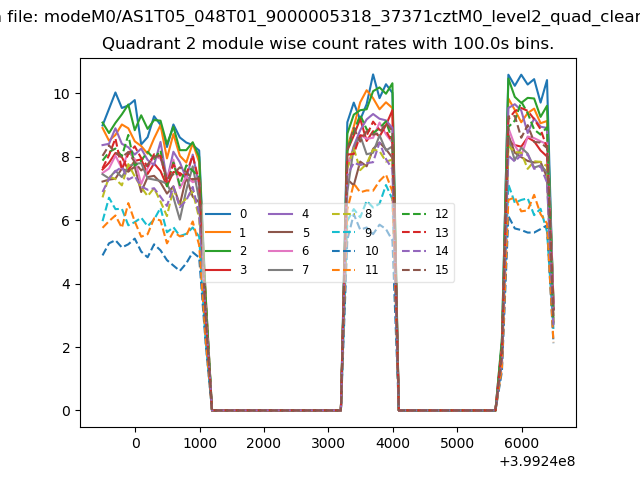
| Module-wise count rates for Quadrant B Data is divided into 100 sec bins |
 |
 |
| Module-wise count rates for Quadrant C Data is divided into 100 sec bins |
 |
 |
| Module-wise count rates for Quadrant D Data is divided into 100 sec bins |
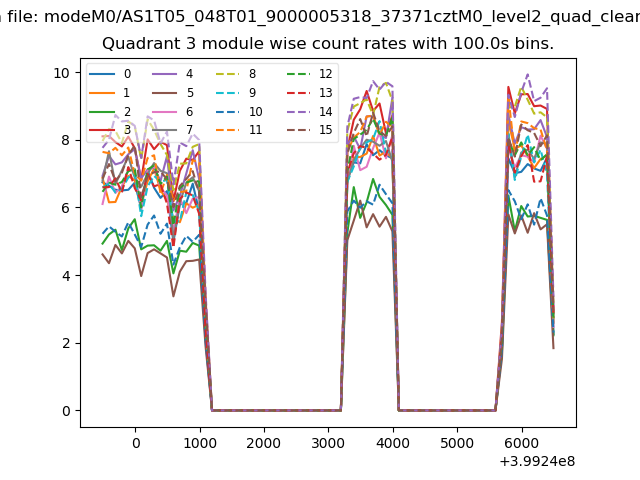 |
 |
| Parameter | Plot |
|---|---|
| CZT HV Monitor | 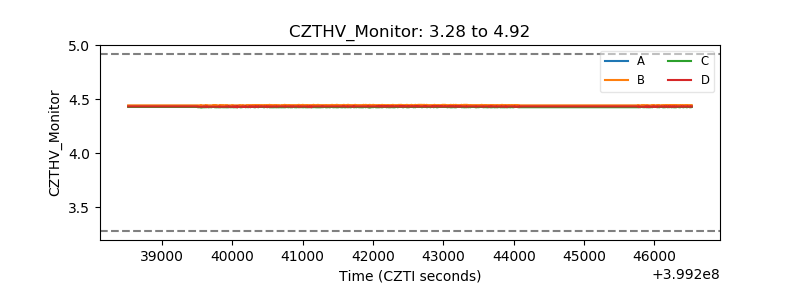 |
| D_VDD | 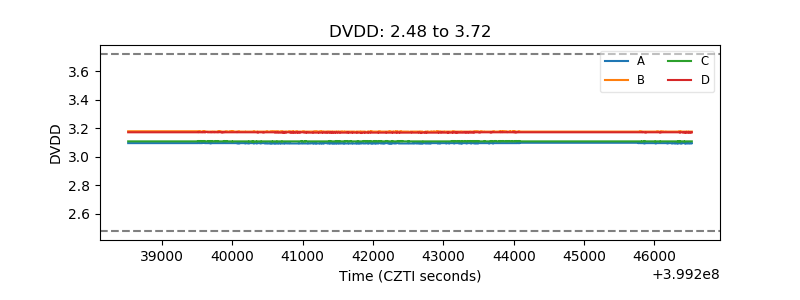 |
| Temperature 1 | 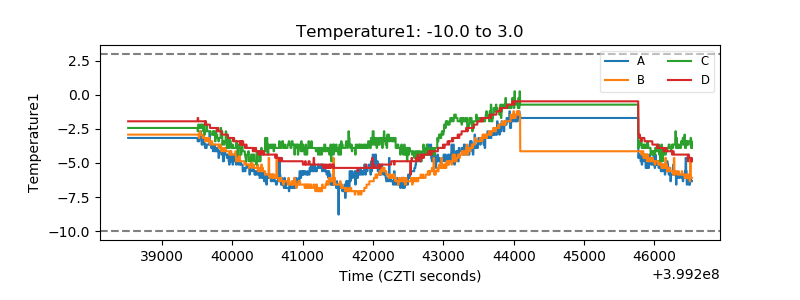 |
| Veto HV Monitor | 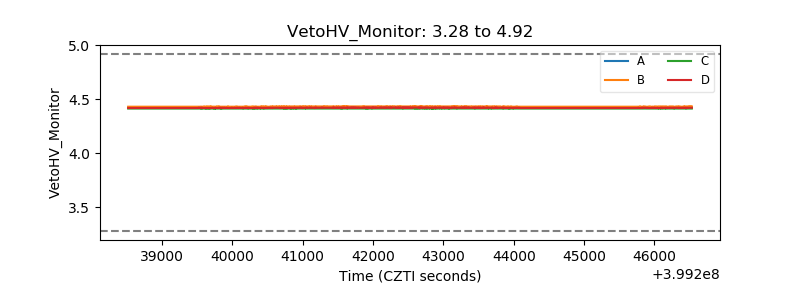 |
| Veto LLD | 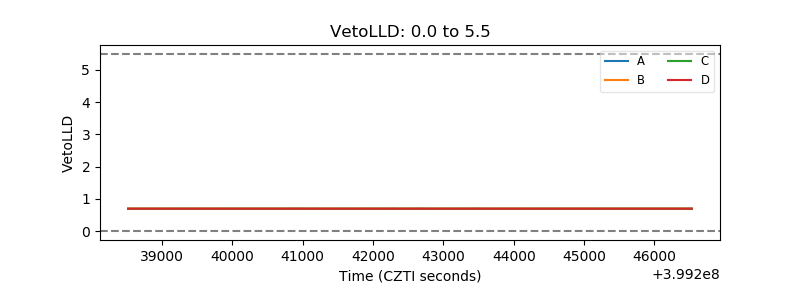 |
| Alpha Counter | 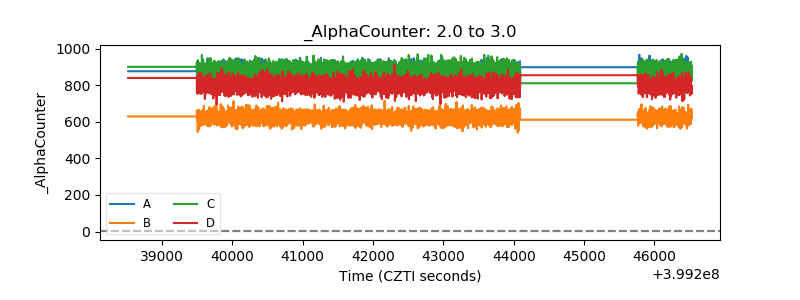 |
| _CPM_Rate | 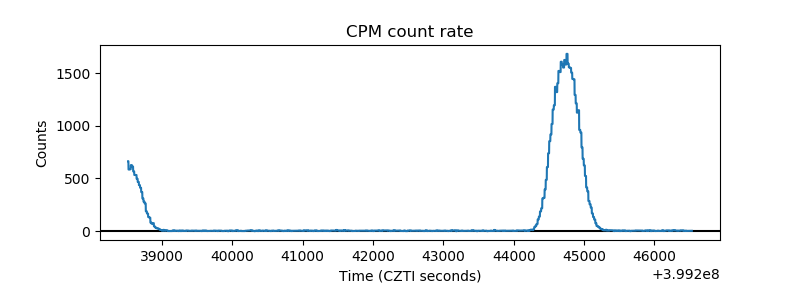 |
| CZT Counter | 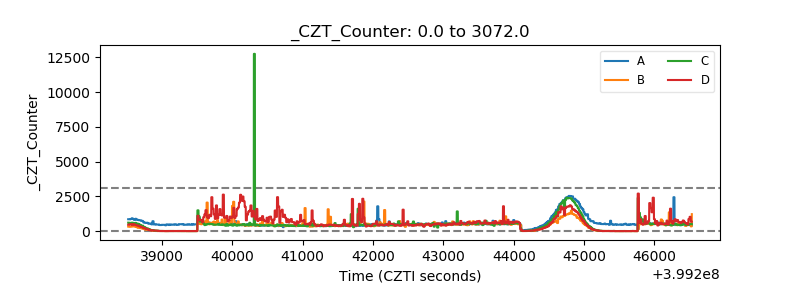 |
| +2.5 Volts monitor | 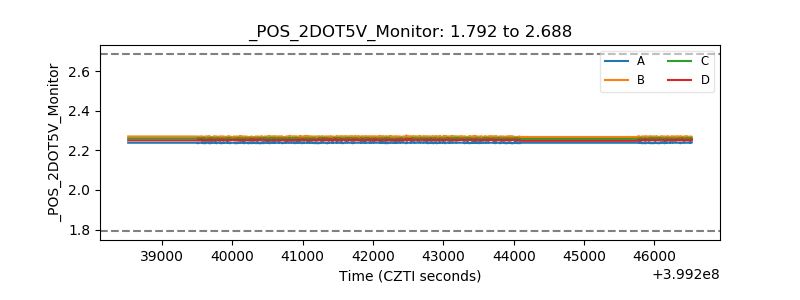 |
| +5 Volts monitor | 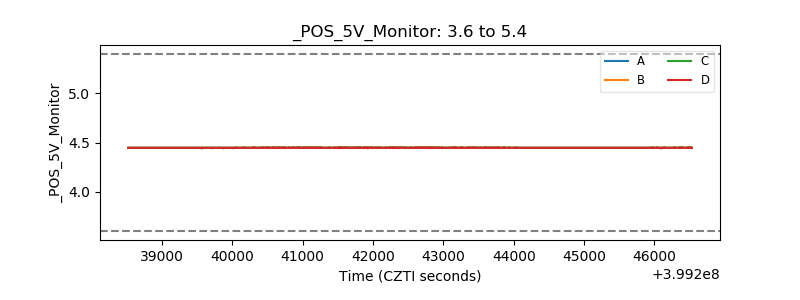 |
| _ROLL_ROT | 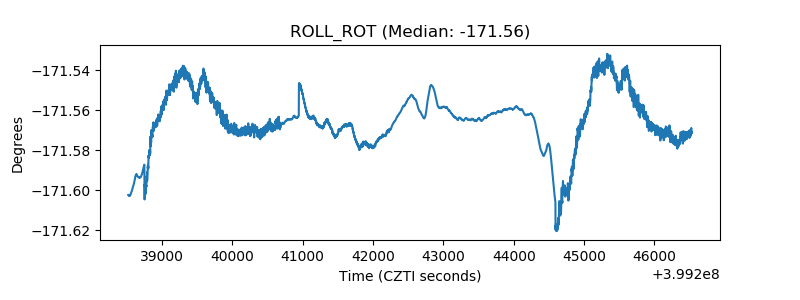 |
| _Roll_DEC | 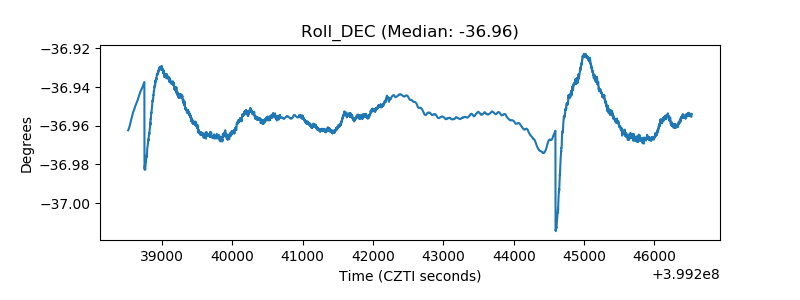 |
| _Roll_RA | 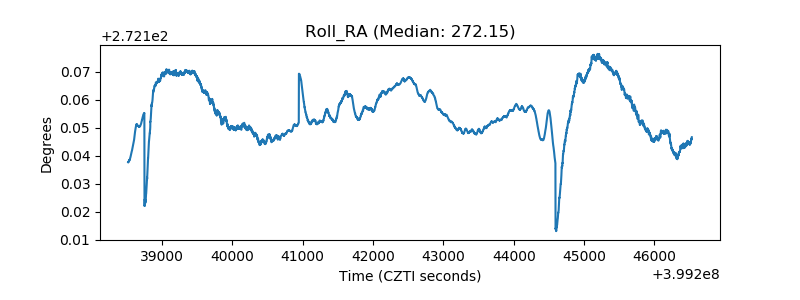 |
| Veto Counter | 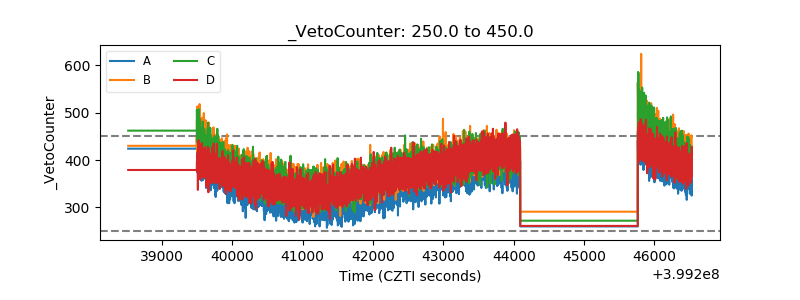 |