| Param | Original file | Final file |
|---|---|---|
| Filename | modeM0/AS1T05_048T01_9000005318_37373cztM0_level2.evt | modeM0/AS1T05_048T01_9000005318_37373cztM0_level2_quad_clean.evt |
| Size (bytes) | 426,767,040 | 65,808,000 |
| Size | 407.0 MB | 62.8 MB |
| Events in quadrant A | 2,722,047 | 408,778 |
| Events in quadrant B | 2,967,738 | 417,318 |
| Events in quadrant C | 2,896,948 | 412,909 |
| Events in quadrant D | 3,975,432 | 379,852 |
| Mode M0 | |||
|---|---|---|---|
| Quadrant | BADHDUFLAG | Total packets | Discarded packets |
| A | 0 | 11442 | 3 |
| B | 0 | 12254 | 2 |
| C | 0 | 11764 | 2 |
| D | 0 | 15401 | 2 |
| Mode SS | |||
|---|---|---|---|
| Quadrant | BADHDUFLAG | Total packets | Discarded packets |
| A | 0 | 108 | 0 |
| B | 0 | 108 | 0 |
| C | 0 | 108 | 0 |
| D | 0 | 108 | 0 |
| Mode M9 | |||
|---|---|---|---|
| Quadrant | BADHDUFLAG | Total packets | Discarded packets |
| A | 0 | 28 | 0 |
| B | 0 | 28 | 0 |
| C | 0 | 28 | 0 |
| D | 0 | 29 | 0 |
| Quadrant | Total seconds | Saturated seconds | Saturation percentage |
|---|---|---|---|
| A | 5339 | 29 | 0.543173% |
| B | 5339 | 111 | 2.079041% |
| C | 5339 | 69 | 1.292377% |
| D | 5339 | 222 | 4.158082% |
Noise dominated data is calculated using 1-second bins in cleaned event files. If a bin has >2000 counts, and if more than 50% of those come from <1% of pixels, then it is considered to be noise-dominated and hence unusable.
| Quadrant | # 1 sec bins | Bins with >0 counts | Bins with >2000 counts | High rate bins dominated by noise | Noise dominated (total time) | Noise dominated (detector-on time) | Marked lightcurve |
|---|---|---|---|---|---|---|---|
| A | 7132 | 5340 | 18 | 18 | 0.25% | 0.34% | 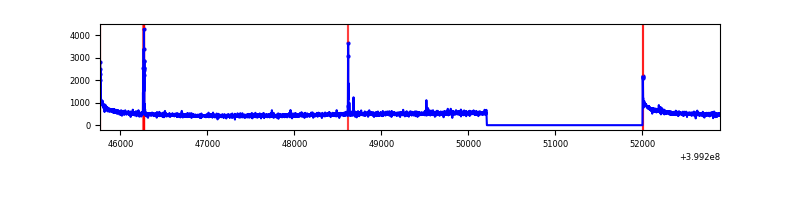 |
| B | 7132 | 5340 | 75 | 75 | 1.05% | 1.40% | 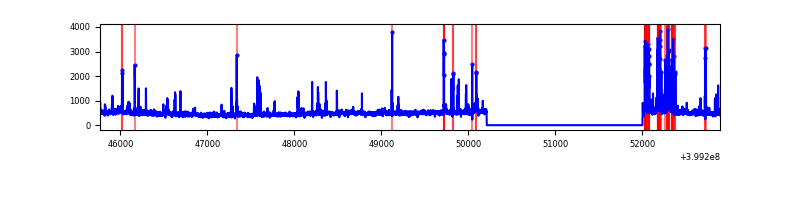 |
| C | 7132 | 5340 | 52 | 52 | 0.73% | 0.97% | 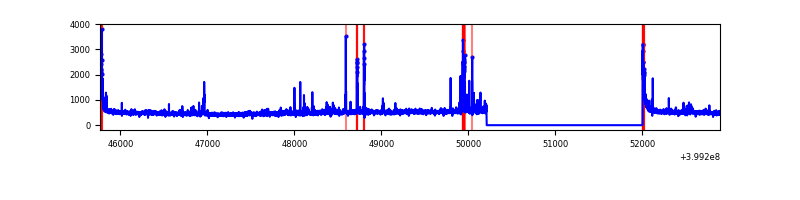 |
| D | 7132 | 5340 | 192 | 192 | 2.69% | 3.60% | 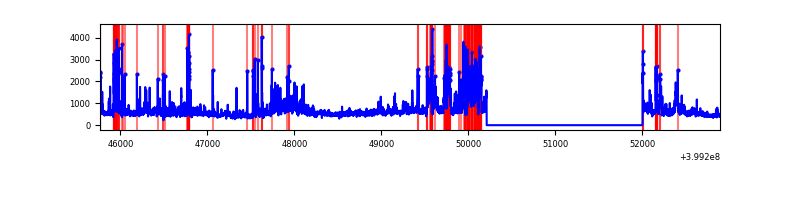 |
Top three noisy pixels from each quadrant. If the there are fewer than three noisy pixels in the level2.evt file, extra rows are filled as -1
| Pixel properties | Quadrant properties | ||||||
|---|---|---|---|---|---|---|---|
| Quadrant | DetID | PixID | Counts | Sigma | Mean | Median | Sigma |
| A | 10 | 83 | 277699 | 2262.03 | 611 | 599 | 122.5 |
| A | 13 | 248 | 31407 | 251.49 | 611 | 599 | 122.5 |
| A | 13 | 6 | 15589 | 122.37 | 611 | 599 | 122.5 |
| B | 5 | 255 | 266870 | 2263.09 | 612 | 596 | 117.7 |
| B | 5 | 172 | 95874 | 809.78 | 612 | 596 | 117.7 |
| B | 0 | 190 | 32775 | 273.49 | 612 | 596 | 117.7 |
| C | 15 | 214 | 225842 | 1605.3 | 598 | 603 | 140.3 |
| C | 14 | 254 | 148607 | 1054.84 | 598 | 603 | 140.3 |
| C | 0 | 10 | 101198 | 716.95 | 598 | 603 | 140.3 |
| D | 12 | 227 | 675531 | 4689.77 | 586 | 568 | 143.9 |
| D | 2 | 249 | 424328 | 2944.36 | 586 | 568 | 143.9 |
| D | 12 | 235 | 356031 | 2469.82 | 586 | 568 | 143.9 |
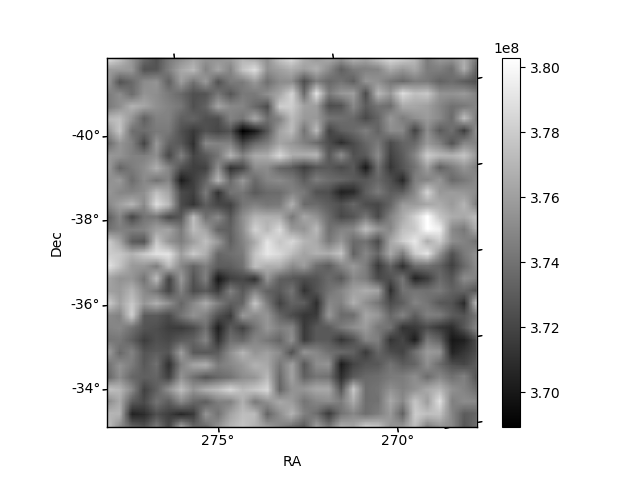
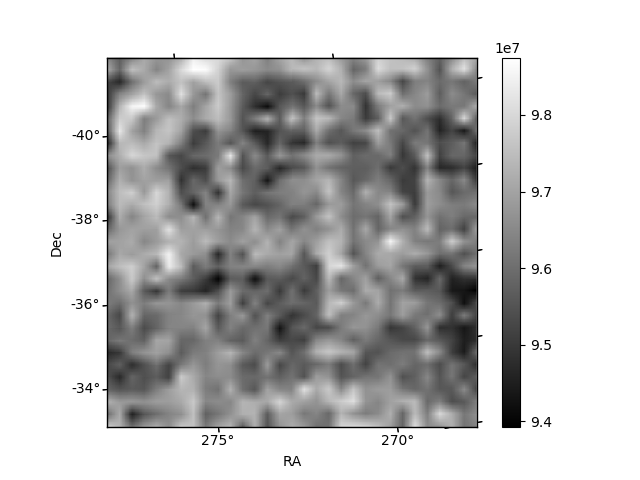
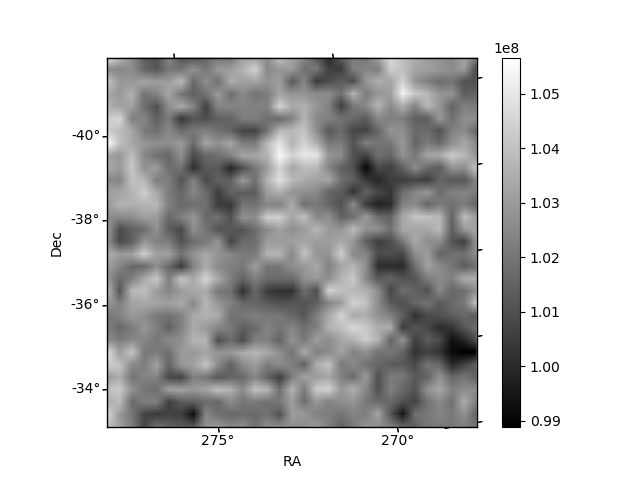
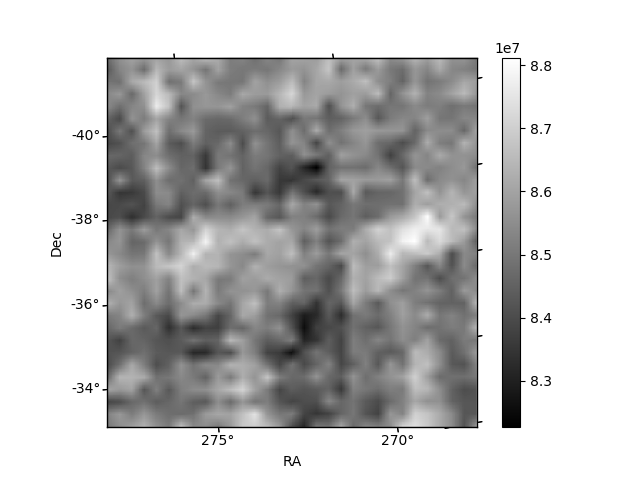
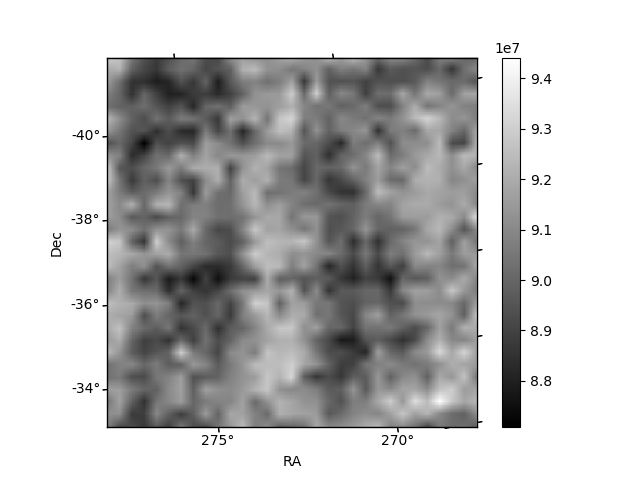
Histogram calculated using DETX and DETY for each event in the final _common_clean file
| Quadrant A | 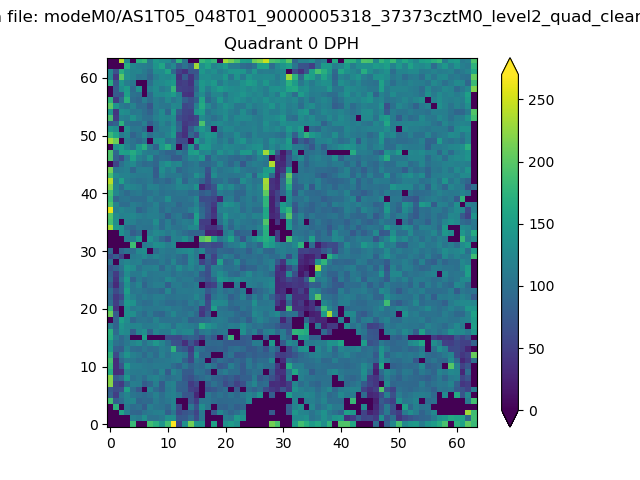 |
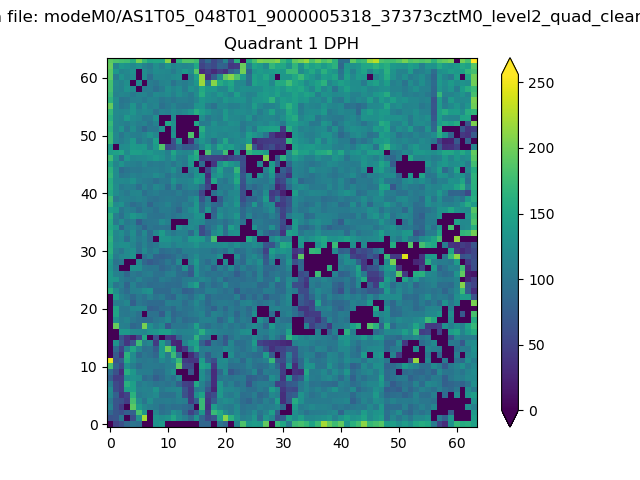 |
Quadrant B |
|---|---|---|---|
| Quadrant D | 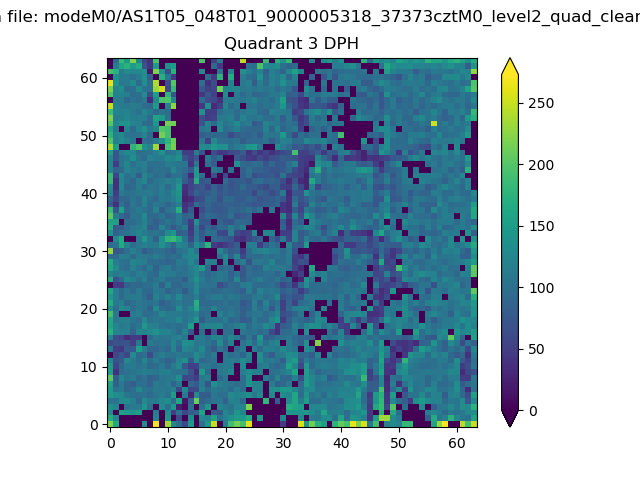 |
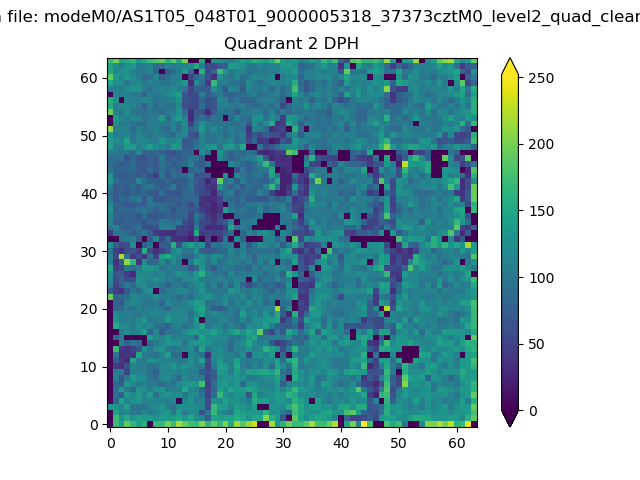 |
Quadrant C |
| Plot type | Count rate plots | Images |
|---|---|---|
| Comparison with Poisson distribution Blue bars denote a histogram of data divided into 1 sec bins. Red curve is a Poisson curve with rate = median count rate of data. |
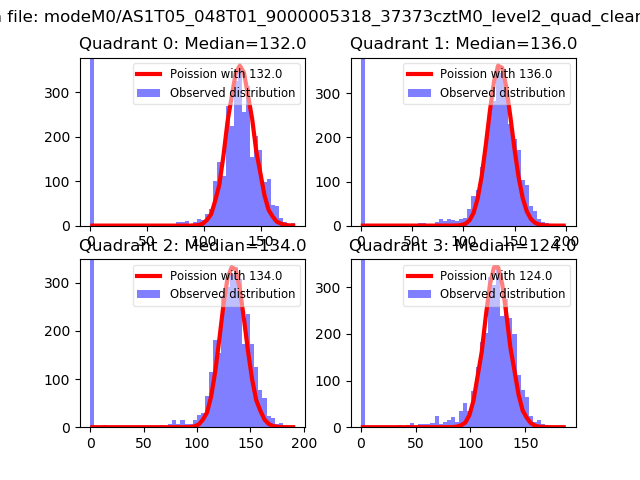 |
 |
| Quadrant-wise count rates Data is divided into 100 sec bins |
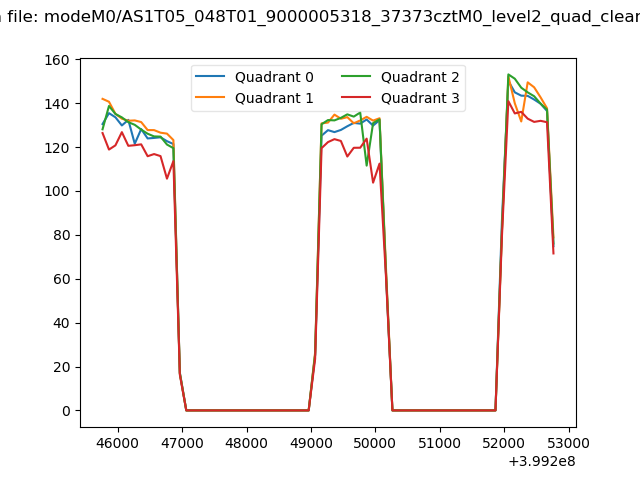 |
|
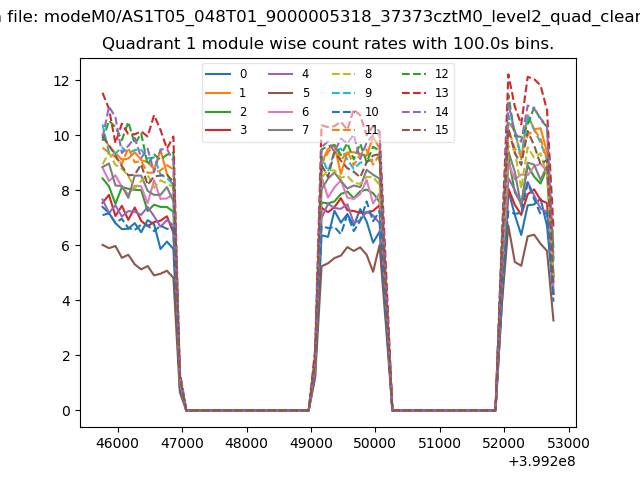
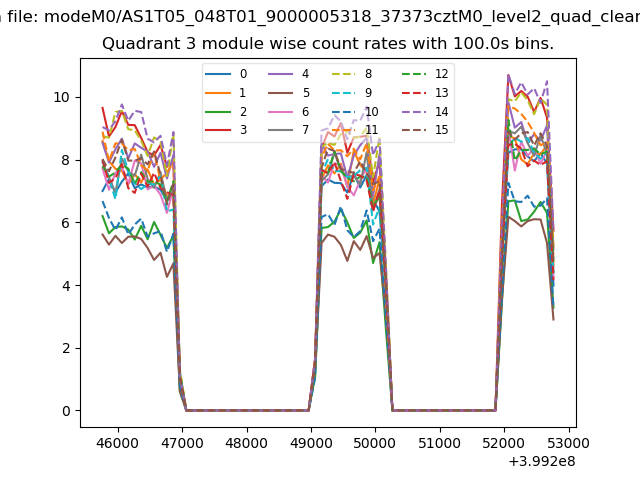
| Module-wise count rates for Quadrant A Data is divided into 100 sec bins |
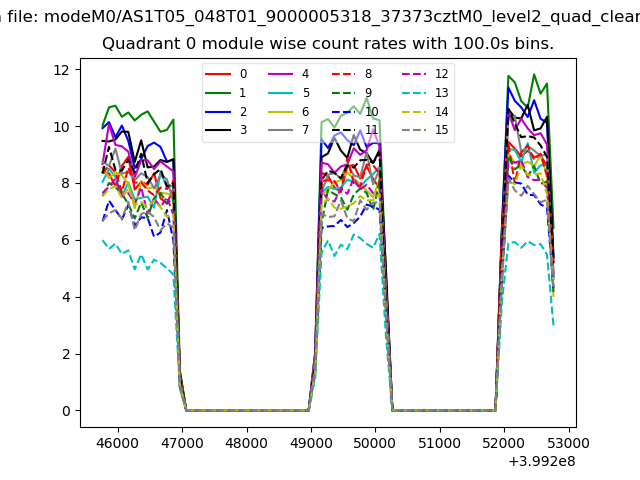 |
 |
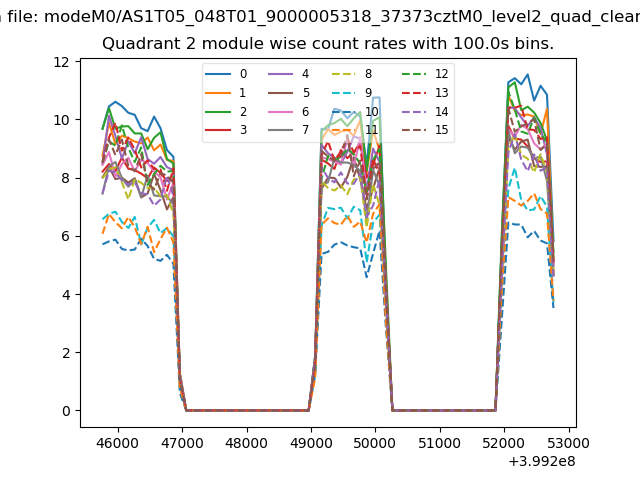
| Module-wise count rates for Quadrant B Data is divided into 100 sec bins |
 |
 |
| Module-wise count rates for Quadrant C Data is divided into 100 sec bins |
 |
 |
| Module-wise count rates for Quadrant D Data is divided into 100 sec bins |
 |
 |
| Parameter | Plot |
|---|---|
| CZT HV Monitor | 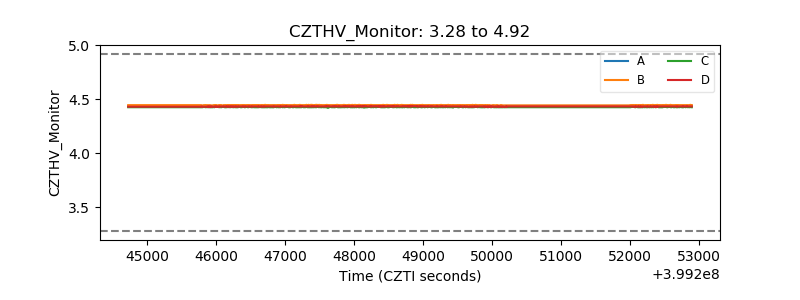 |
| D_VDD | 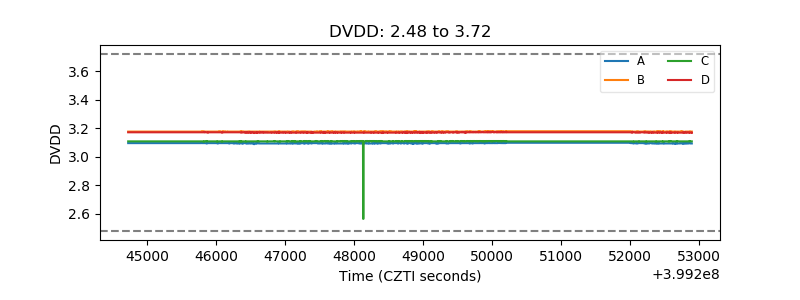 |
| Temperature 1 | 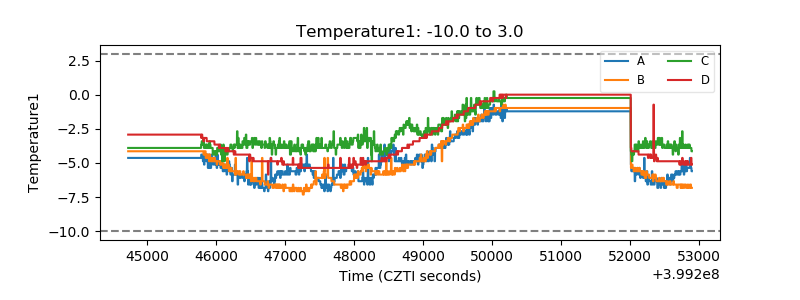 |
| Veto HV Monitor | 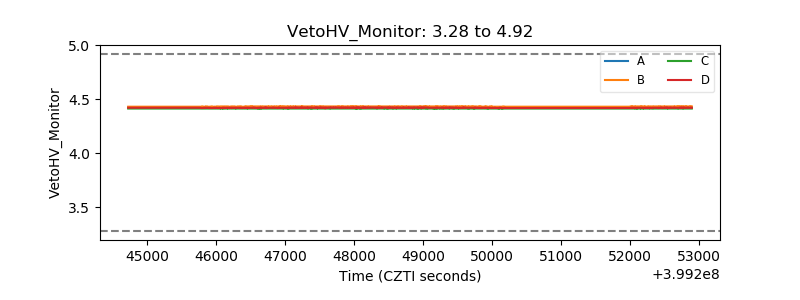 |
| Veto LLD | 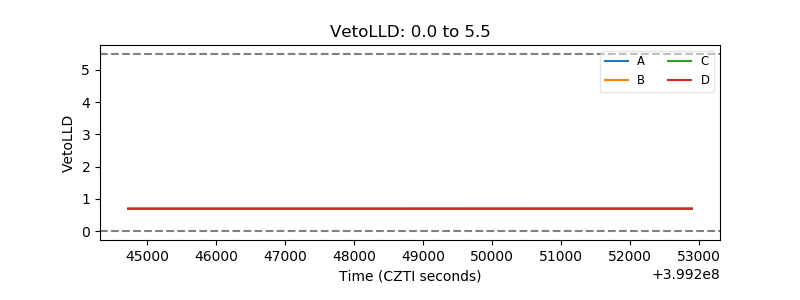 |
| Alpha Counter | 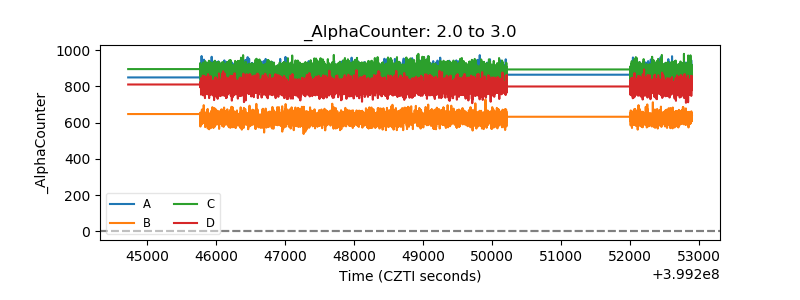 |
| _CPM_Rate | 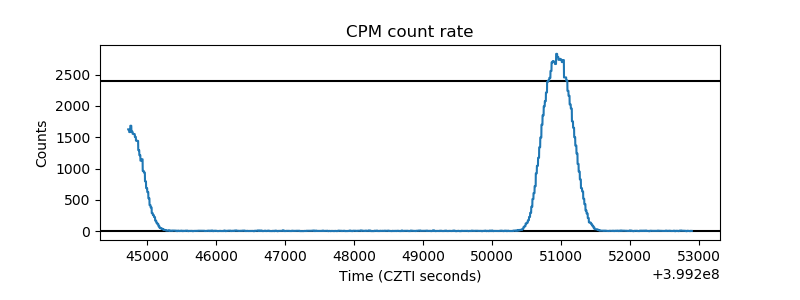 |
| CZT Counter | 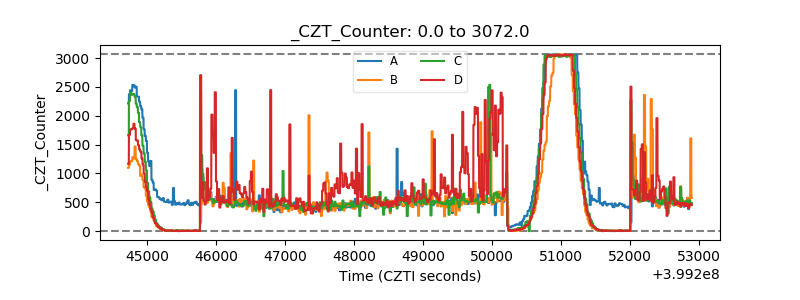 |
| +2.5 Volts monitor | 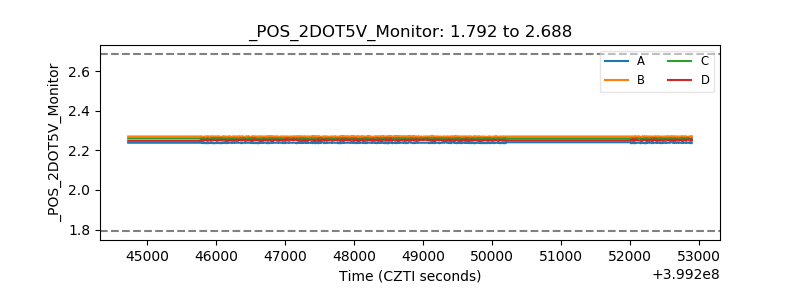 |
| +5 Volts monitor | 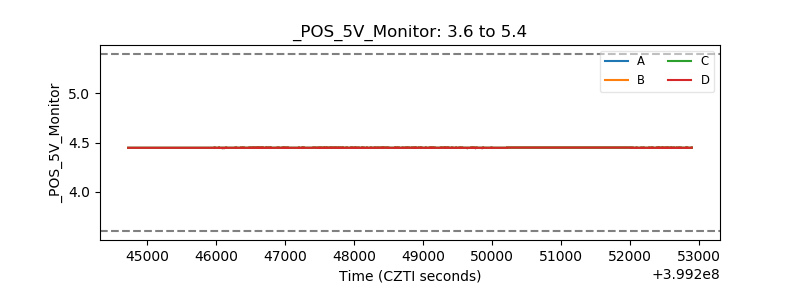 |
| _ROLL_ROT | 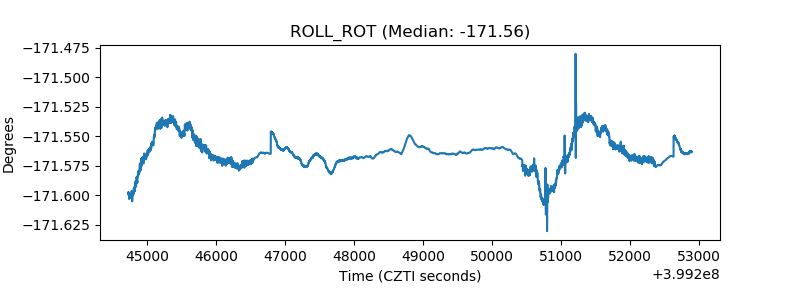 |
| _Roll_DEC | 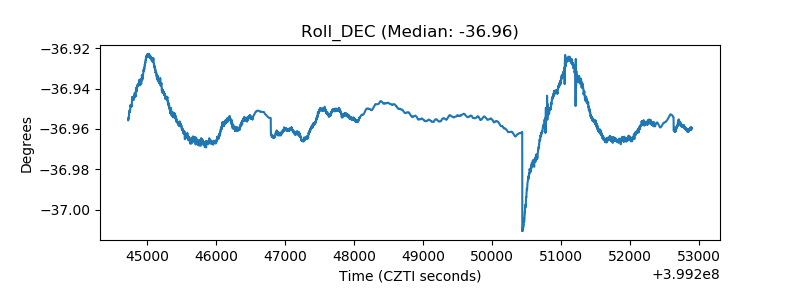 |
| _Roll_RA | 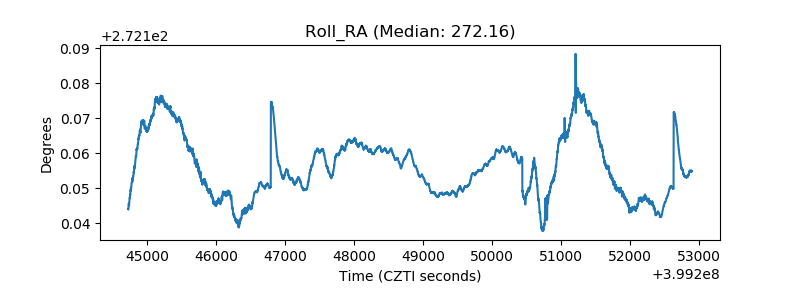 |
| Veto Counter | 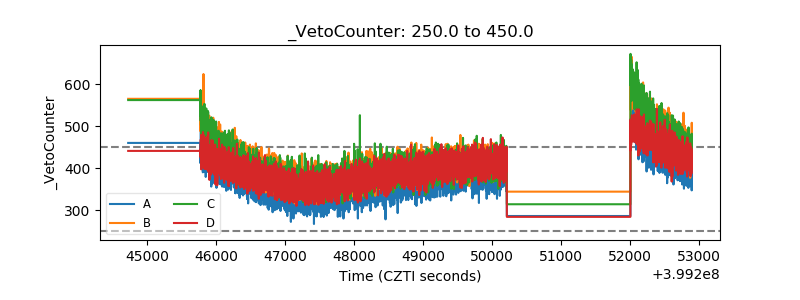 |