| Param | Original file | Final file |
|---|---|---|
| Filename | modeM0/AS1T05_048T01_9000005318_37375cztM0_level2.evt | modeM0/AS1T05_048T01_9000005318_37375cztM0_level2_quad_clean.evt |
| Size (bytes) | 1,994,682,240 | 236,655,360 |
| Size | 1.9 GB | 225.7 MB |
| Events in quadrant A | 11,578,886 | 1,426,918 |
| Events in quadrant B | 13,747,877 | 1,456,034 |
| Events in quadrant C | 11,922,251 | 1,453,147 |
| Events in quadrant D | 21,620,769 | 1,256,902 |
| Mode M0 | |||
|---|---|---|---|
| Quadrant | BADHDUFLAG | Total packets | Discarded packets |
| A | 0 | 48484 | 6 |
| B | 0 | 55491 | 5 |
| C | 0 | 48934 | 5 |
| D | 0 | 79912 | 5 |
| Mode SS | |||
|---|---|---|---|
| Quadrant | BADHDUFLAG | Total packets | Discarded packets |
| A | 0 | 468 | 0 |
| B | 0 | 468 | 0 |
| C | 0 | 468 | 0 |
| D | 0 | 468 | 0 |
| Mode M9 | |||
|---|---|---|---|
| Quadrant | BADHDUFLAG | Total packets | Discarded packets |
| A | 0 | 90 | 0 |
| B | 0 | 90 | 0 |
| C | 0 | 90 | 0 |
| D | 0 | 90 | 0 |
| Quadrant | Total seconds | Saturated seconds | Saturation percentage |
|---|---|---|---|
| A | 22860 | 92 | 0.402450% |
| B | 22860 | 855 | 3.740157% |
| C | 22860 | 135 | 0.590551% |
| D | 22860 | 2045 | 8.945757% |
Noise dominated data is calculated using 1-second bins in cleaned event files. If a bin has >2000 counts, and if more than 50% of those come from <1% of pixels, then it is considered to be noise-dominated and hence unusable.
| Quadrant | # 1 sec bins | Bins with >0 counts | Bins with >2000 counts | High rate bins dominated by noise | Noise dominated (total time) | Noise dominated (detector-on time) | Marked lightcurve |
|---|---|---|---|---|---|---|---|
| A | 31823 | 22865 | 59 | 59 | 0.19% | 0.26% | 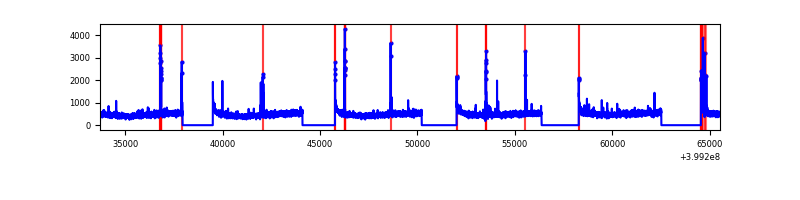 |
| B | 31823 | 22865 | 584 | 584 | 1.84% | 2.55% | 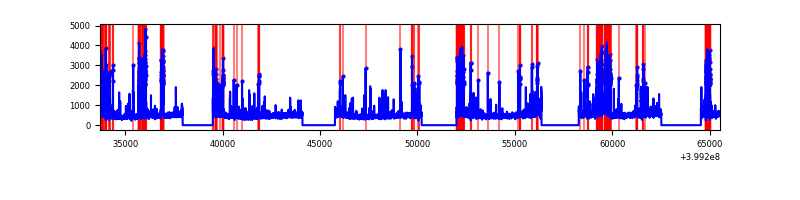 |
| C | 31823 | 22865 | 98 | 98 | 0.31% | 0.43% | 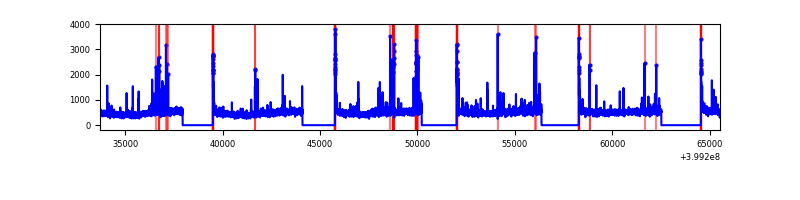 |
| D | 31823 | 22864 | 2078 | 2078 | 6.53% | 9.09% | 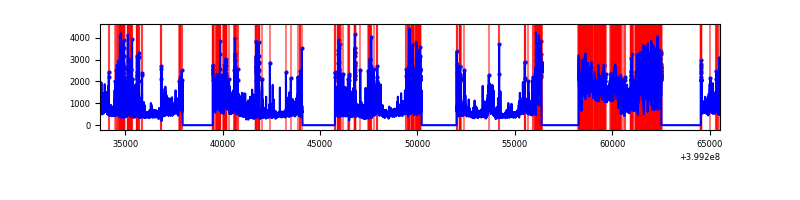 |
Top three noisy pixels from each quadrant. If the there are fewer than three noisy pixels in the level2.evt file, extra rows are filled as -1
| Pixel properties | Quadrant properties | ||||||
|---|---|---|---|---|---|---|---|
| Quadrant | DetID | PixID | Counts | Sigma | Mean | Median | Sigma |
| A | 10 | 83 | 962363 | 1824.04 | 2650 | 2602 | 526.2 |
| A | 13 | 248 | 137572 | 256.51 | 2650 | 2602 | 526.2 |
| A | 10 | 255 | 60707 | 110.43 | 2650 | 2602 | 526.2 |
| B | 5 | 255 | 1775565 | 3593.27 | 2625 | 2561 | 493.4 |
| B | 5 | 172 | 440375 | 887.3 | 2625 | 2561 | 493.4 |
| B | 0 | 190 | 438730 | 883.96 | 2625 | 2561 | 493.4 |
| C | 15 | 214 | 950460 | 1580.07 | 2605 | 2633 | 599.9 |
| C | 14 | 254 | 309309 | 511.24 | 2605 | 2633 | 599.9 |
| C | 0 | 10 | 239686 | 395.18 | 2605 | 2633 | 599.9 |
| D | 12 | 235 | 5353395 | 8883.29 | 2499 | 2432 | 602.4 |
| D | 1 | 20 | 3035044 | 5034.53 | 2499 | 2432 | 602.4 |
| D | 2 | 249 | 1439505 | 2385.73 | 2499 | 2432 | 602.4 |
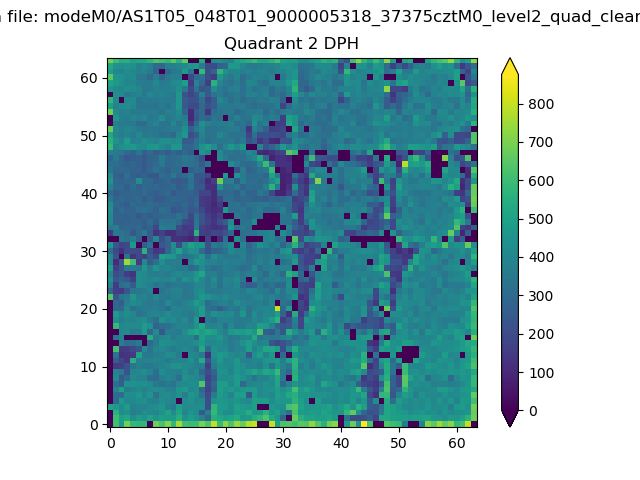
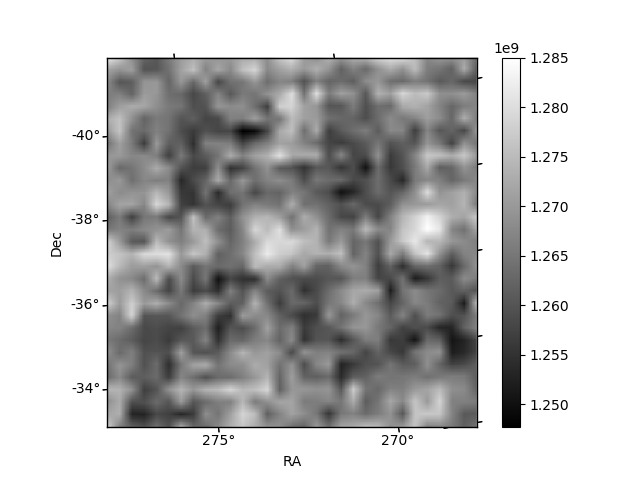
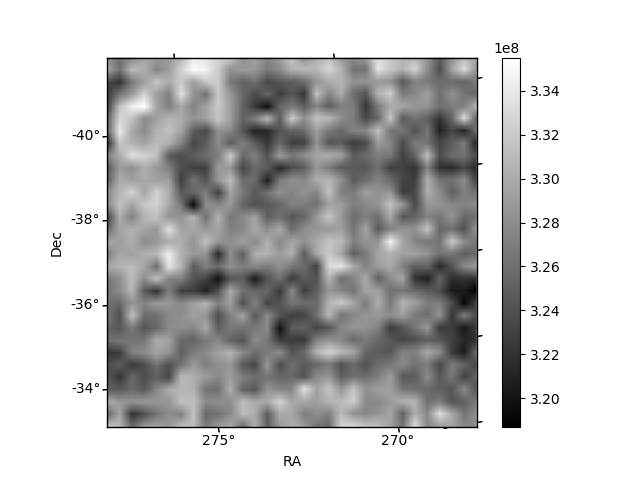
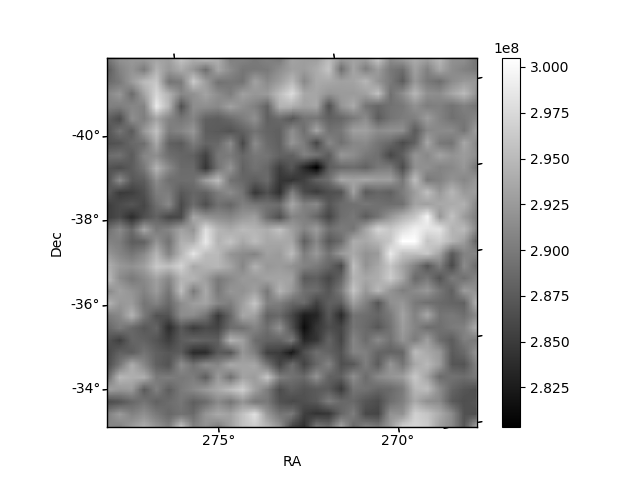
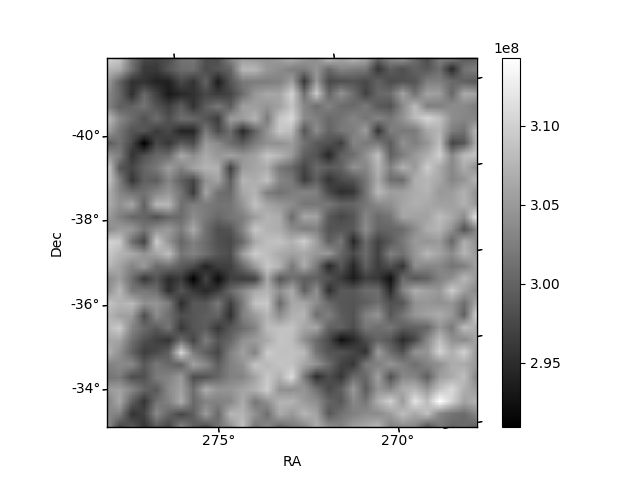
Histogram calculated using DETX and DETY for each event in the final _common_clean file
| Quadrant A | 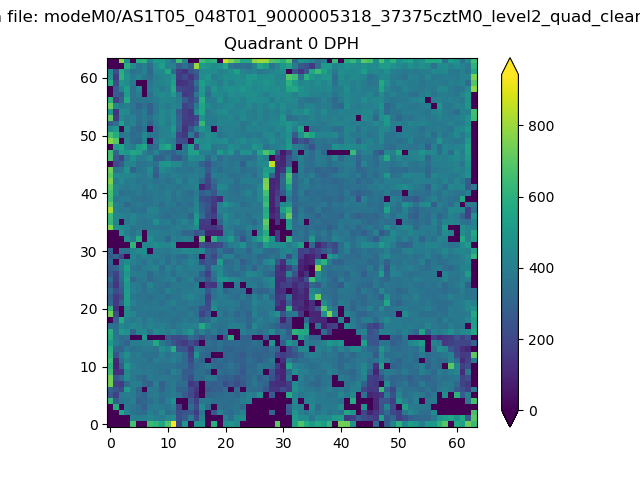 |
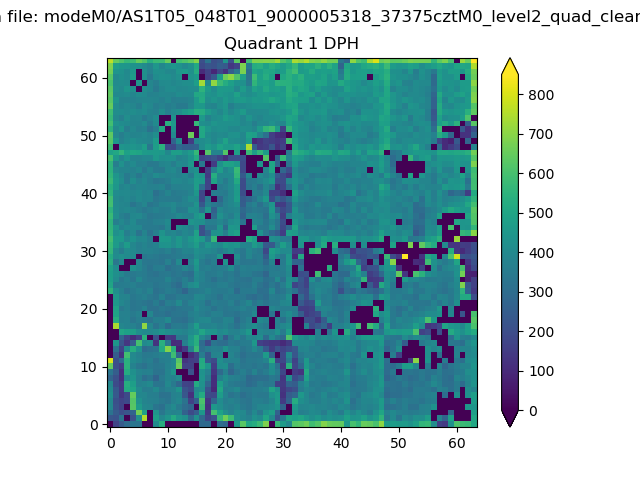 |
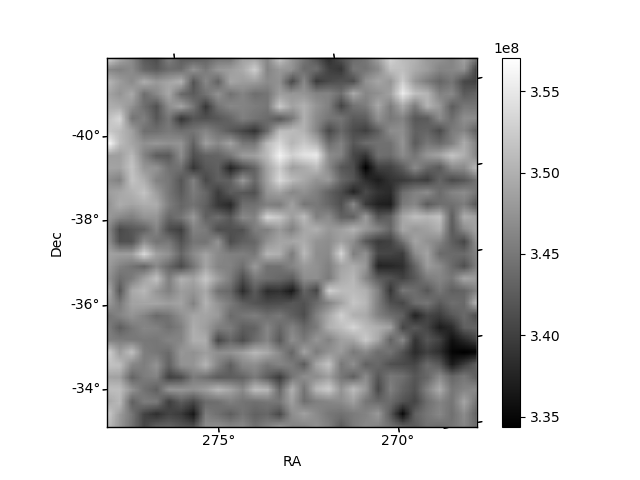
Quadrant B |
|---|---|---|---|
| Quadrant D | 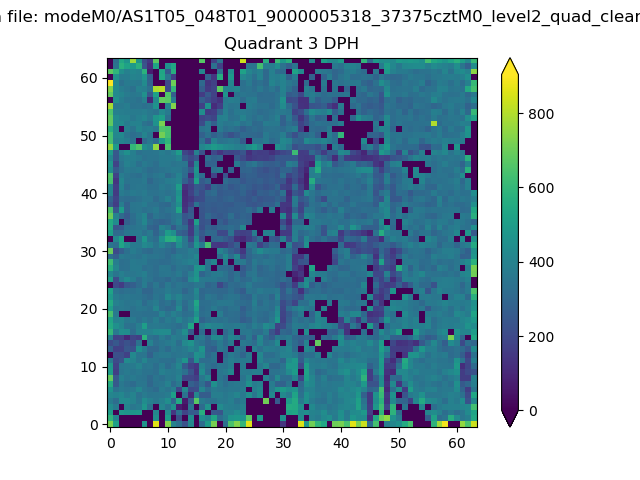 |
 |
Quadrant C |
| Plot type | Count rate plots | Images |
|---|---|---|
| Comparison with Poisson distribution Blue bars denote a histogram of data divided into 1 sec bins. Red curve is a Poisson curve with rate = median count rate of data. |
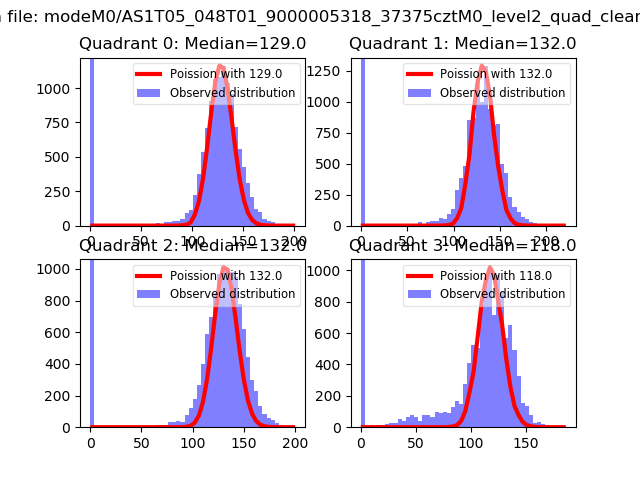 |
 |
| Quadrant-wise count rates Data is divided into 100 sec bins |
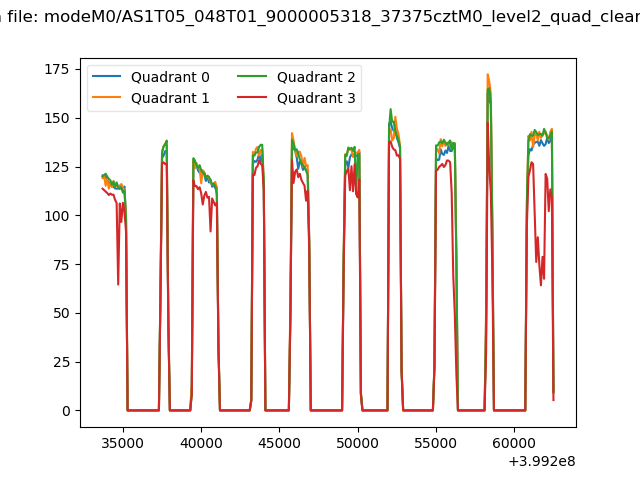 |
|
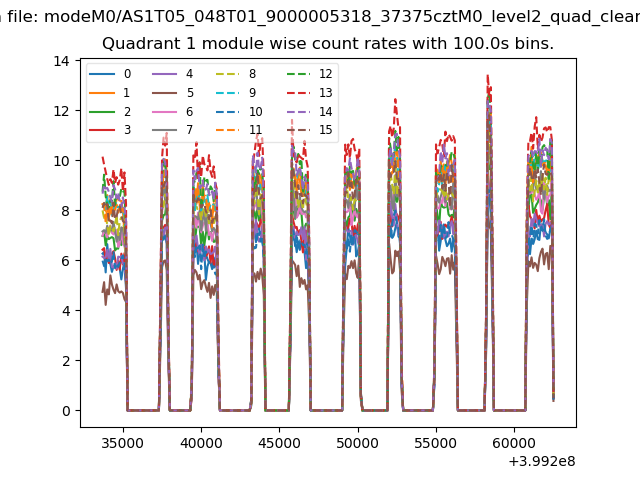
| Module-wise count rates for Quadrant A Data is divided into 100 sec bins |
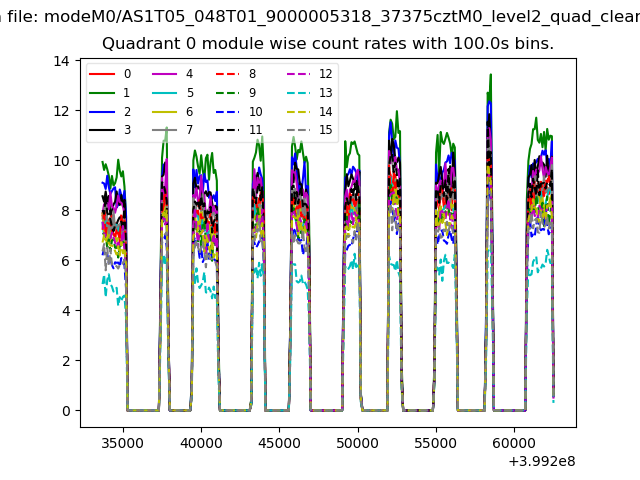 |
 |
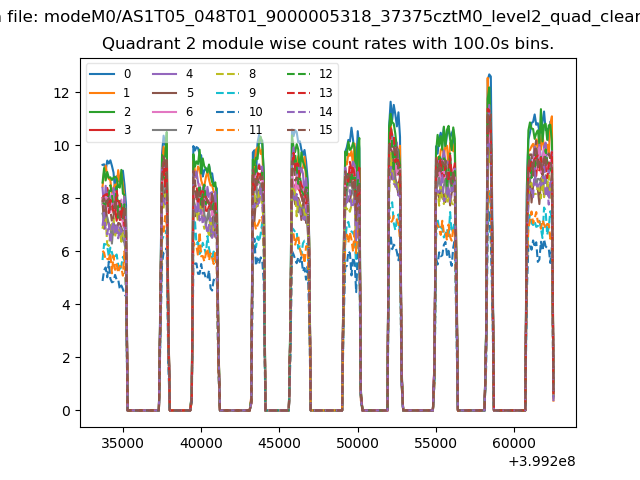
| Module-wise count rates for Quadrant B Data is divided into 100 sec bins |
 |
 |
| Module-wise count rates for Quadrant C Data is divided into 100 sec bins |
 |
 |
| Module-wise count rates for Quadrant D Data is divided into 100 sec bins |
 |
 |
| Parameter | Plot |
|---|---|
| CZT HV Monitor | 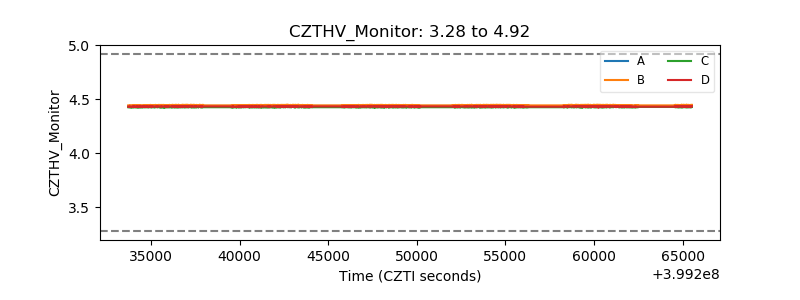 |
| D_VDD | 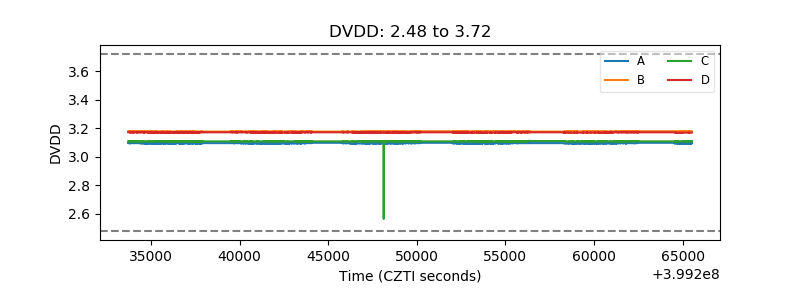 |
| Temperature 1 | 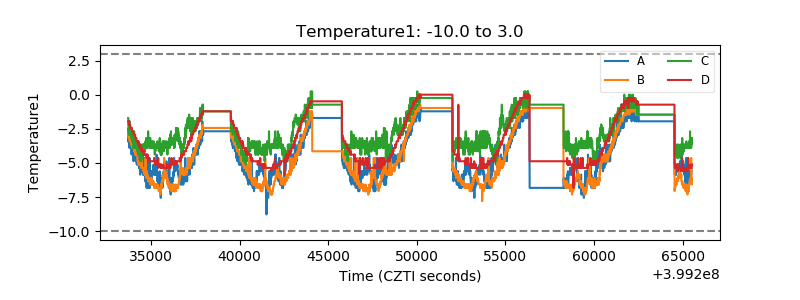 |
| Veto HV Monitor | 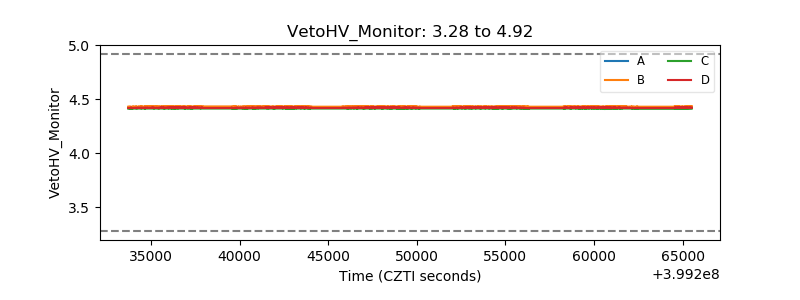 |
| Veto LLD | 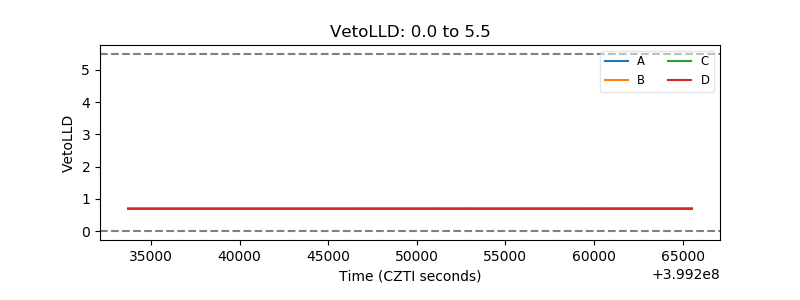 |
| Alpha Counter | 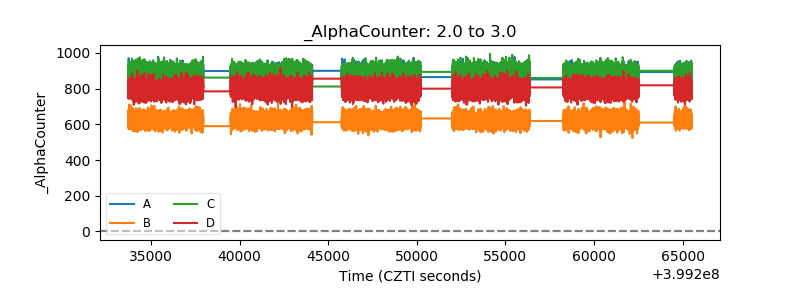 |
| _CPM_Rate | 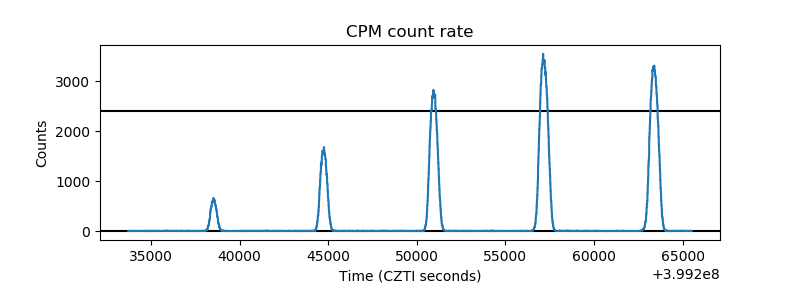 |
| CZT Counter | 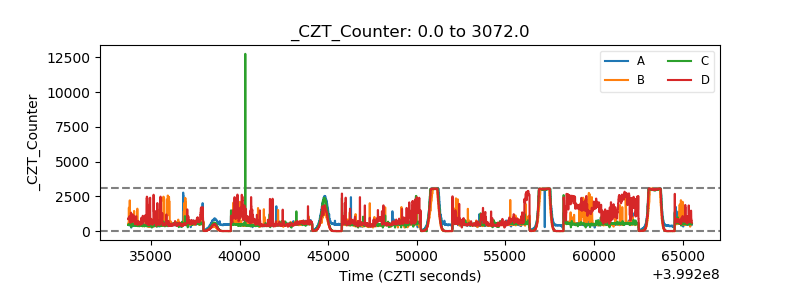 |
| +2.5 Volts monitor | 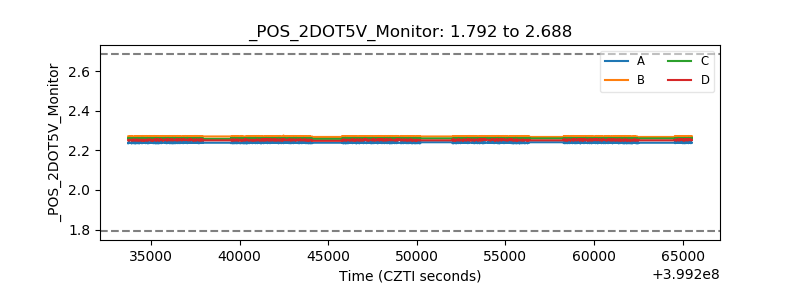 |
| +5 Volts monitor | 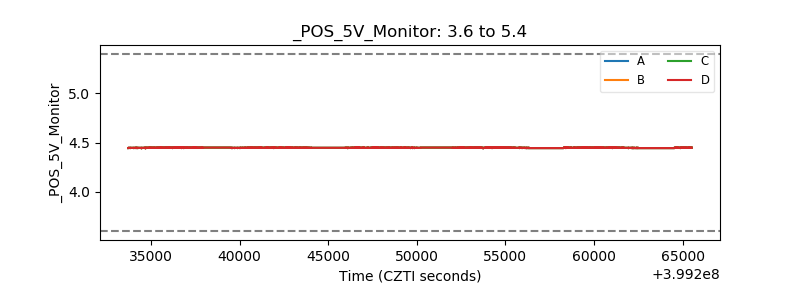 |
| _ROLL_ROT | 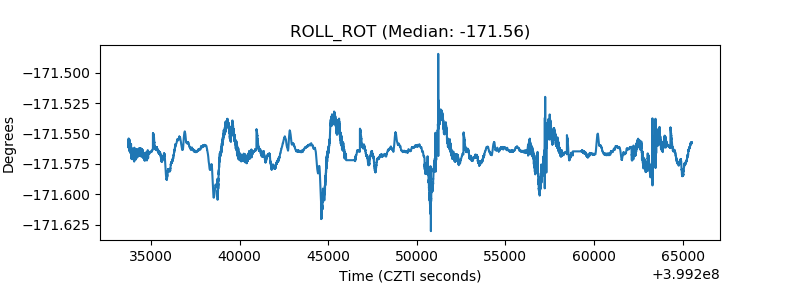 |
| _Roll_DEC | 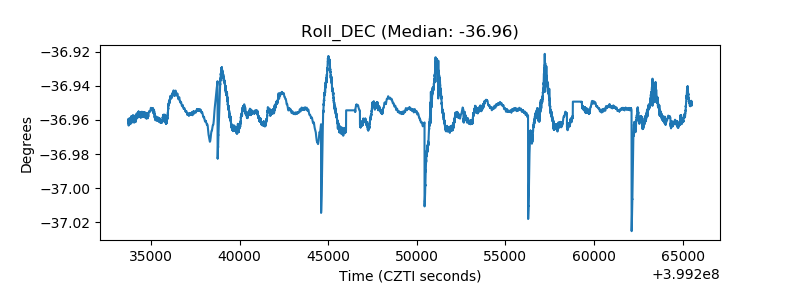 |
| _Roll_RA | 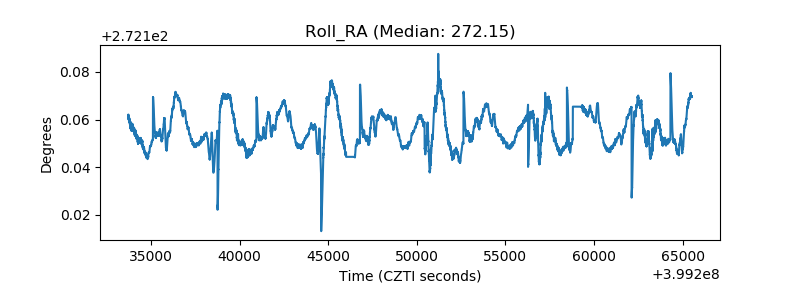 |
| Veto Counter | 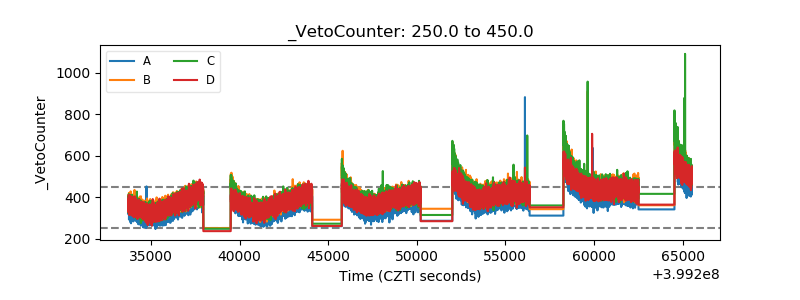 |