| Param | Original file | Final file |
|---|---|---|
| Filename | modeM0/AS1T05_048T01_9000005318_37376cztM0_level2.evt | modeM0/AS1T05_048T01_9000005318_37376cztM0_level2_quad_clean.evt |
| Size (bytes) | 622,382,400 | 46,897,920 |
| Size | 593.6 MB | 44.7 MB |
| Events in quadrant A | 2,928,176 | 285,832 |
| Events in quadrant B | 3,689,408 | 277,261 |
| Events in quadrant C | 3,998,544 | 281,854 |
| Events in quadrant D | 7,882,100 | 210,172 |
| Mode M0 | |||
|---|---|---|---|
| Quadrant | BADHDUFLAG | Total packets | Discarded packets |
| A | 0 | 11594 | 3 |
| B | 0 | 14028 | 2 |
| C | 0 | 14949 | 2 |
| D | 0 | 27064 | 2 |
| Mode SS | |||
|---|---|---|---|
| Quadrant | BADHDUFLAG | Total packets | Discarded packets |
| A | 0 | 108 | 0 |
| B | 0 | 108 | 0 |
| C | 0 | 108 | 0 |
| D | 0 | 108 | 0 |
| Mode M9 | |||
|---|---|---|---|
| Quadrant | BADHDUFLAG | Total packets | Discarded packets |
| A | 0 | 29 | 0 |
| B | 0 | 29 | 0 |
| C | 0 | 29 | 0 |
| D | 0 | 30 | 0 |
| Quadrant | Total seconds | Saturated seconds | Saturation percentage |
|---|---|---|---|
| A | 5183 | 29 | 0.559522% |
| B | 5183 | 424 | 8.180590% |
| C | 5183 | 318 | 6.135443% |
| D | 5183 | 1531 | 29.538877% |
Noise dominated data is calculated using 1-second bins in cleaned event files. If a bin has >2000 counts, and if more than 50% of those come from <1% of pixels, then it is considered to be noise-dominated and hence unusable.
| Quadrant | # 1 sec bins | Bins with >0 counts | Bins with >2000 counts | High rate bins dominated by noise | Noise dominated (total time) | Noise dominated (detector-on time) | Marked lightcurve |
|---|---|---|---|---|---|---|---|
| A | 7276 | 5184 | 23 | 23 | 0.32% | 0.44% | 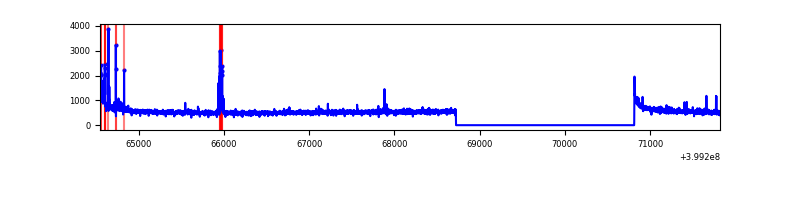 |
| B | 7276 | 5183 | 278 | 278 | 3.82% | 5.36% | 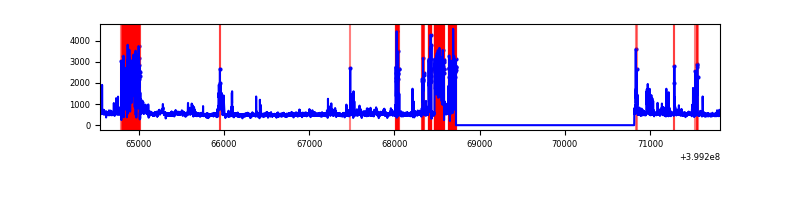 |
| C | 7276 | 5184 | 299 | 299 | 4.11% | 5.77% | 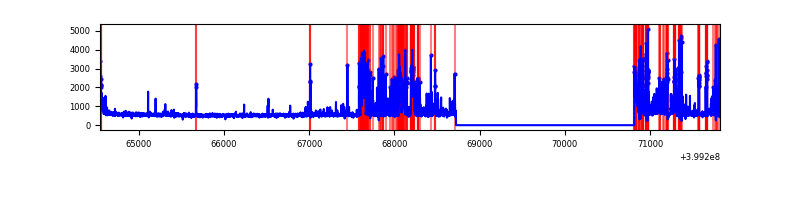 |
| D | 7276 | 5184 | 1393 | 1393 | 19.15% | 26.87% | 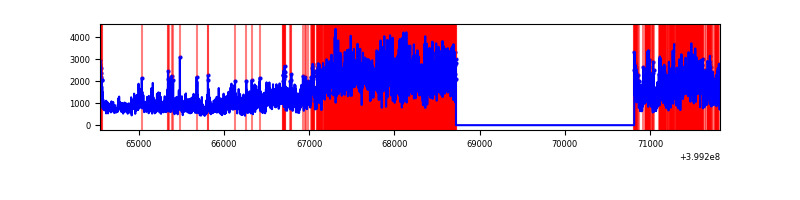 |
Top three noisy pixels from each quadrant. If the there are fewer than three noisy pixels in the level2.evt file, extra rows are filled as -1
| Pixel properties | Quadrant properties | ||||||
|---|---|---|---|---|---|---|---|
| Quadrant | DetID | PixID | Counts | Sigma | Mean | Median | Sigma |
| A | 10 | 83 | 275177 | 2095.38 | 652 | 639 | 131.0 |
| A | 13 | 248 | 91004 | 689.7 | 652 | 639 | 131.0 |
| A | 9 | 143 | 22784 | 169.02 | 652 | 639 | 131.0 |
| B | 5 | 255 | 527087 | 4511.77 | 626 | 613 | 116.7 |
| B | 0 | 190 | 368066 | 3149.0 | 626 | 613 | 116.7 |
| B | 5 | 172 | 123140 | 1050.03 | 626 | 613 | 116.7 |
| C | 1 | 23 | 1030968 | 7188.47 | 630 | 637 | 143.3 |
| C | 15 | 214 | 216473 | 1505.86 | 630 | 637 | 143.3 |
| C | 14 | 254 | 159896 | 1111.13 | 630 | 637 | 143.3 |
| D | 12 | 235 | 4775425 | 33455.09 | 584 | 569 | 142.7 |
| D | 2 | 249 | 533429 | 3733.49 | 584 | 569 | 142.7 |
| D | 12 | 227 | 215592 | 1506.56 | 584 | 569 | 142.7 |
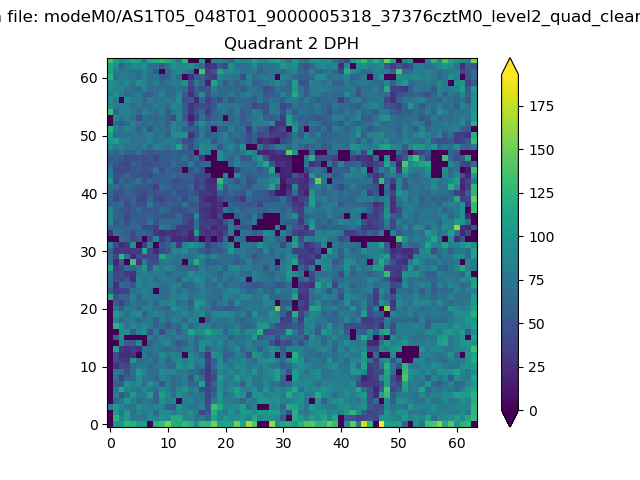
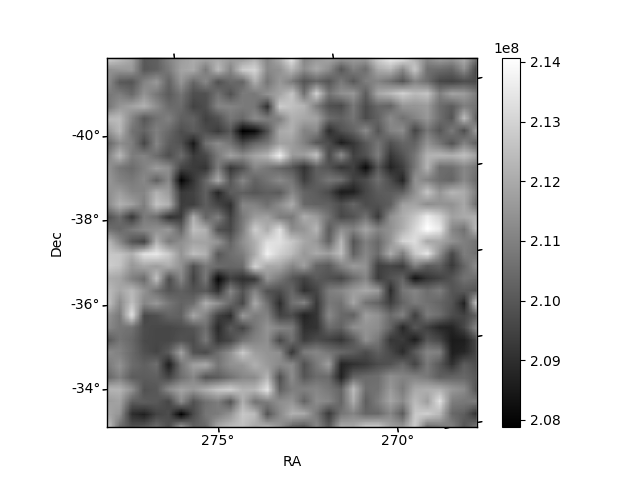
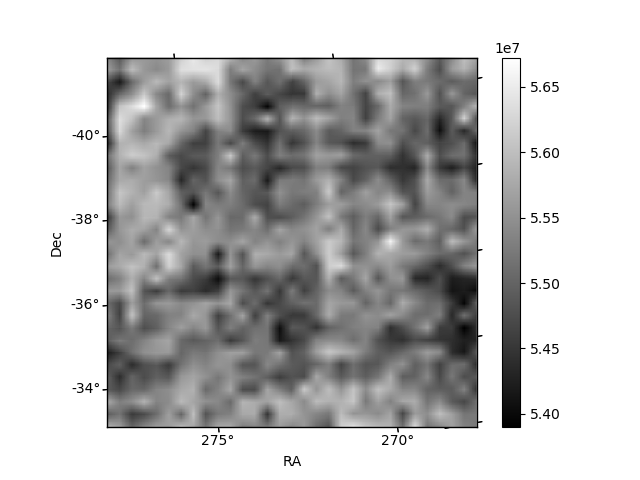
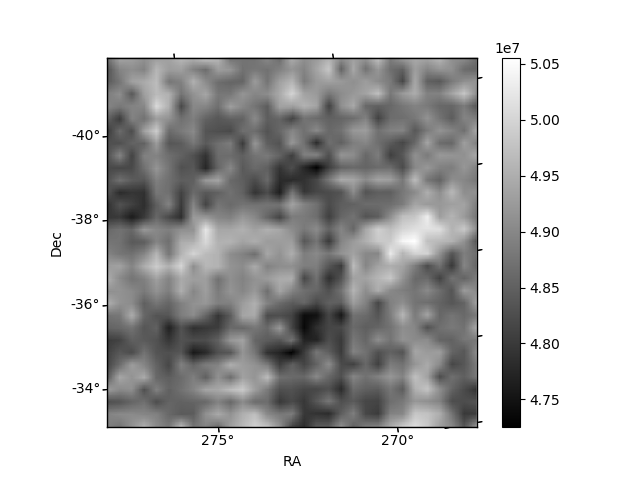
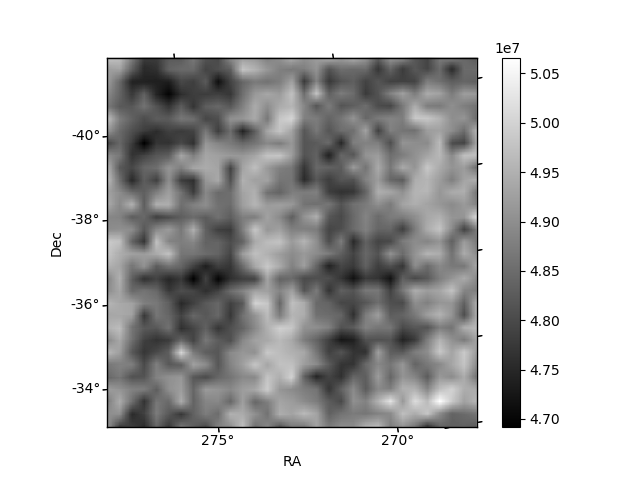
Histogram calculated using DETX and DETY for each event in the final _common_clean file
| Quadrant A | 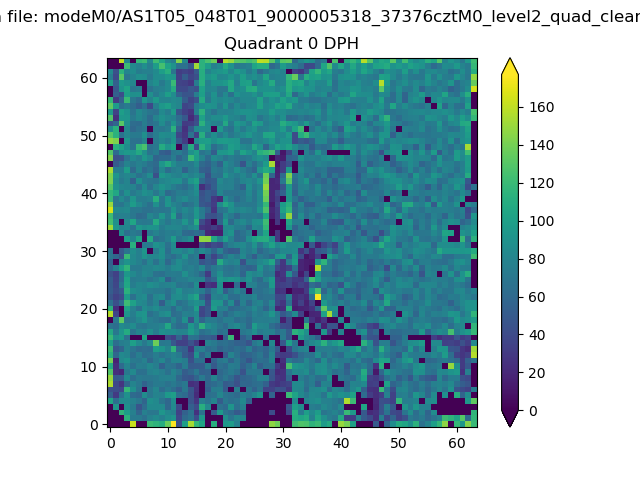 |
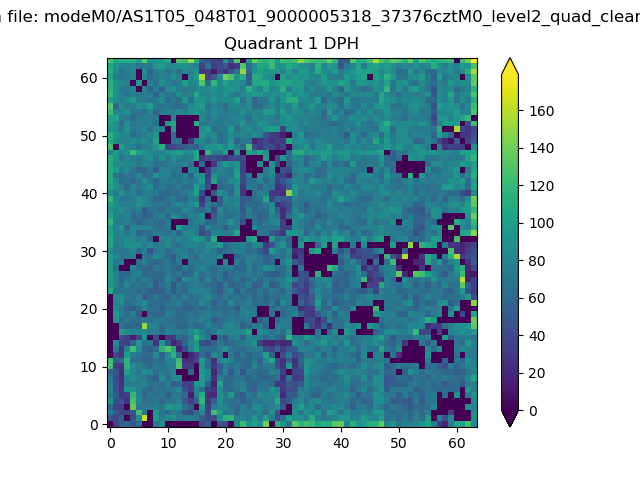 |
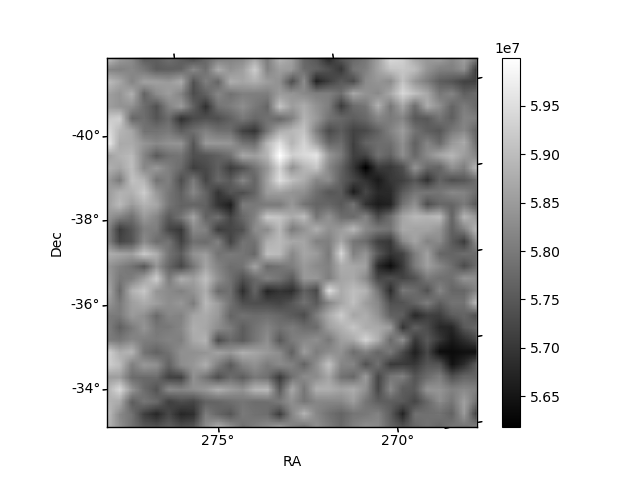
Quadrant B |
|---|---|---|---|
| Quadrant D | 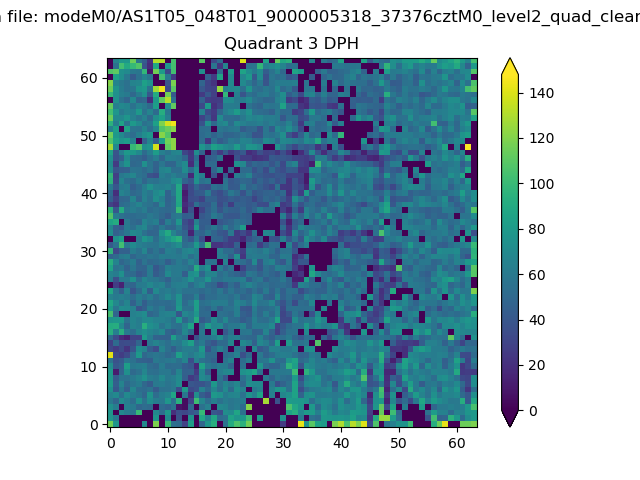 |
 |
Quadrant C |
| Plot type | Count rate plots | Images |
|---|---|---|
| Comparison with Poisson distribution Blue bars denote a histogram of data divided into 1 sec bins. Red curve is a Poisson curve with rate = median count rate of data. |
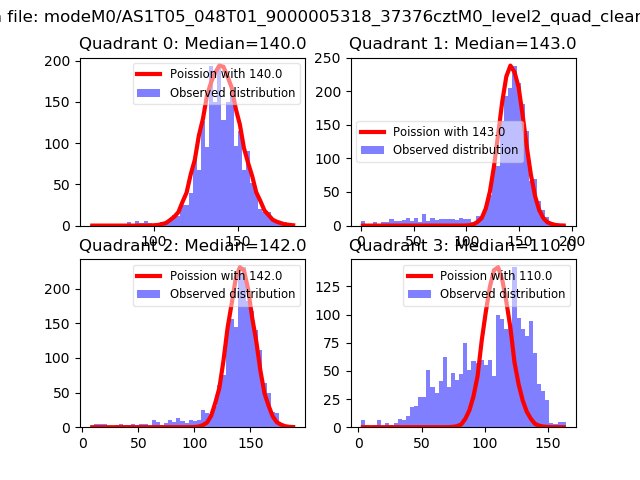 |
 |
| Quadrant-wise count rates Data is divided into 100 sec bins |
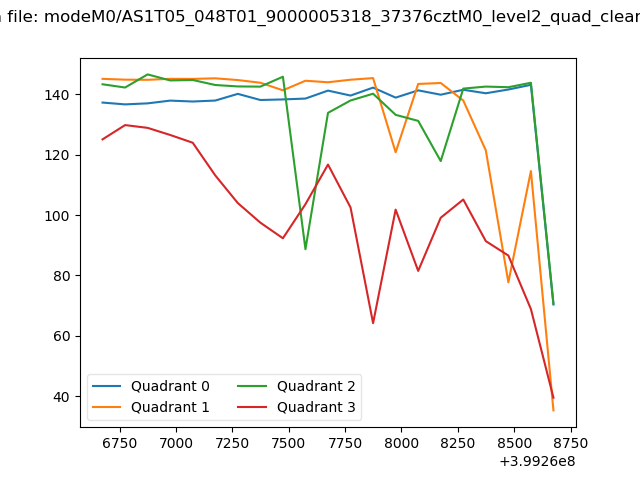 |
|
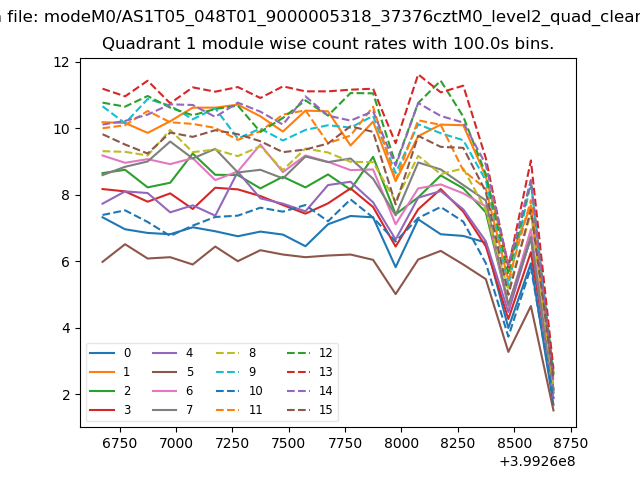
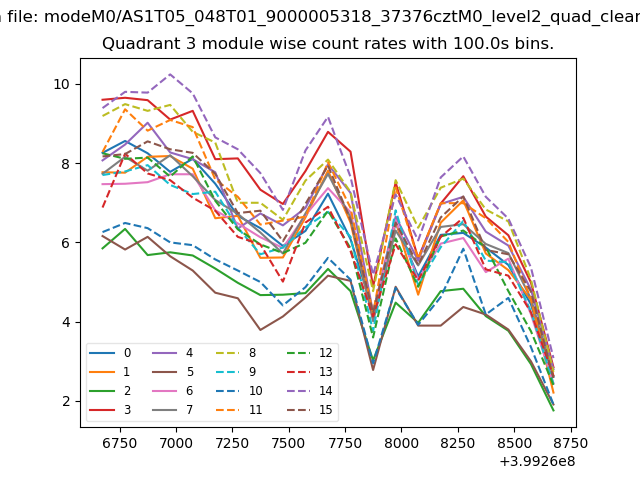
| Module-wise count rates for Quadrant A Data is divided into 100 sec bins |
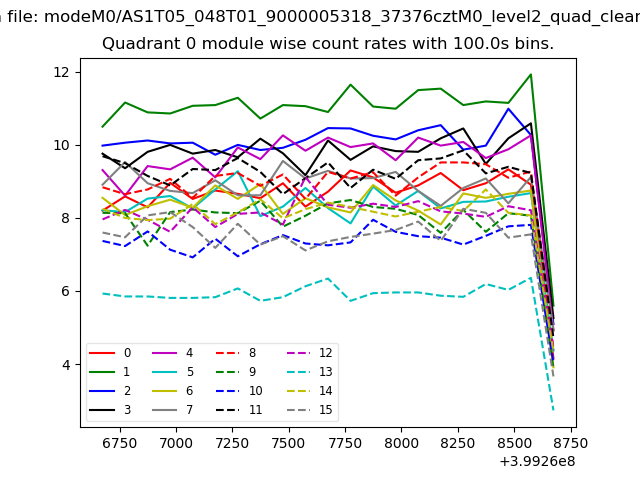 |
 |
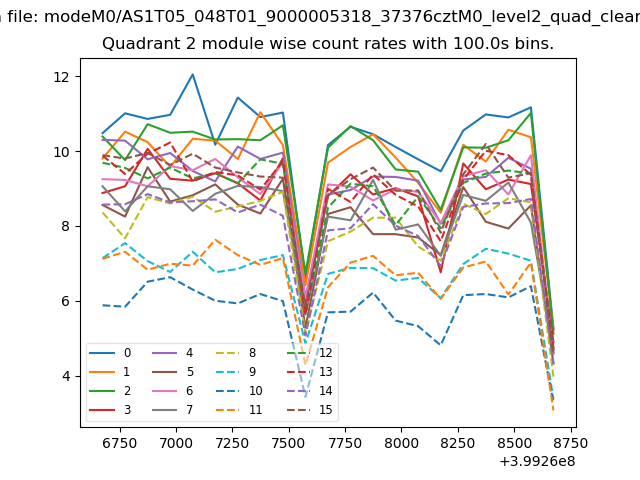
| Module-wise count rates for Quadrant B Data is divided into 100 sec bins |
 |
 |
| Module-wise count rates for Quadrant C Data is divided into 100 sec bins |
 |
 |
| Module-wise count rates for Quadrant D Data is divided into 100 sec bins |
 |
 |
| Parameter | Plot |
|---|---|
| CZT HV Monitor | 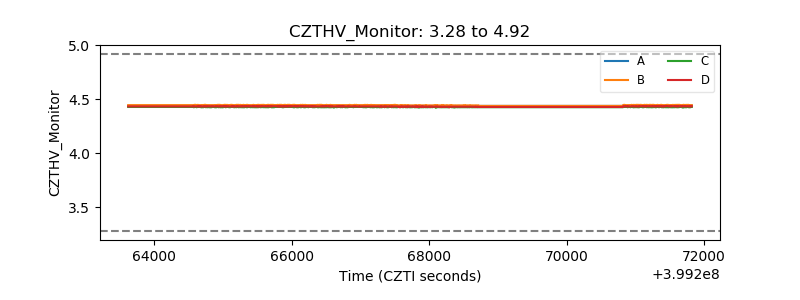 |
| D_VDD | 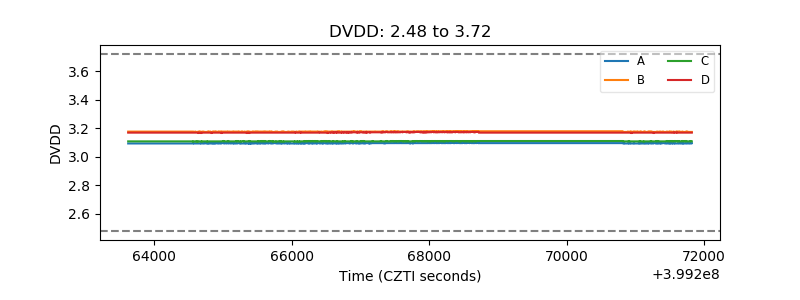 |
| Temperature 1 | 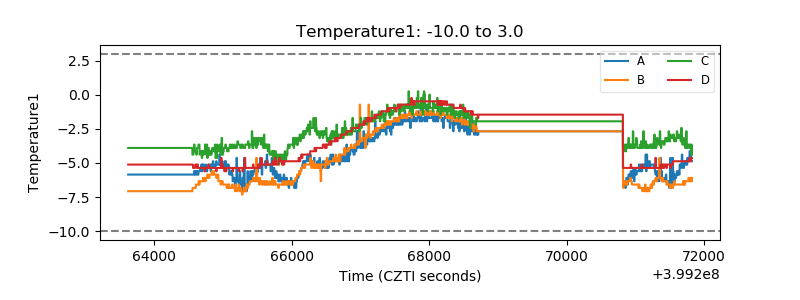 |
| Veto HV Monitor | 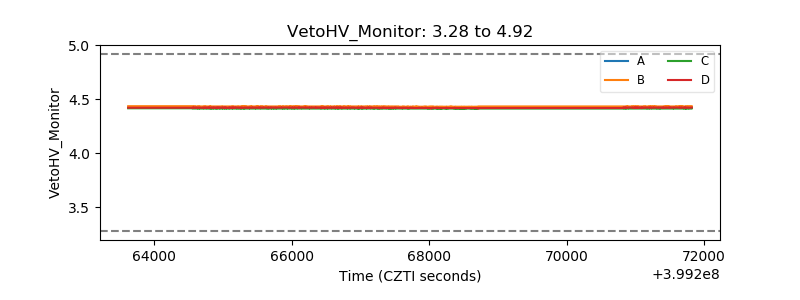 |
| Veto LLD | 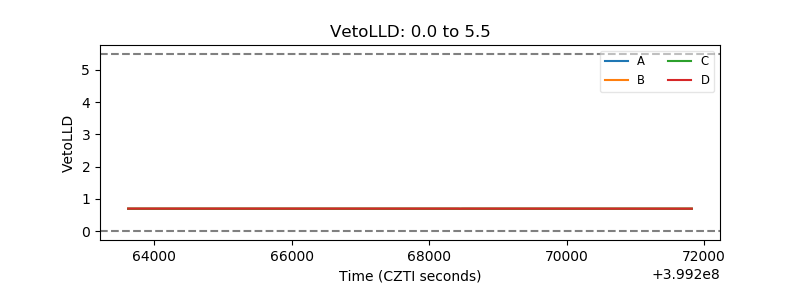 |
| Alpha Counter | 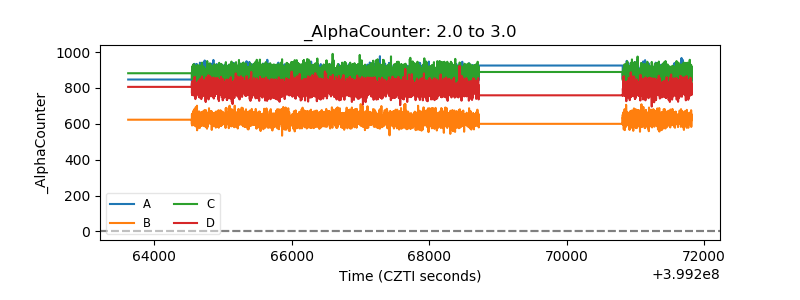 |
| _CPM_Rate | 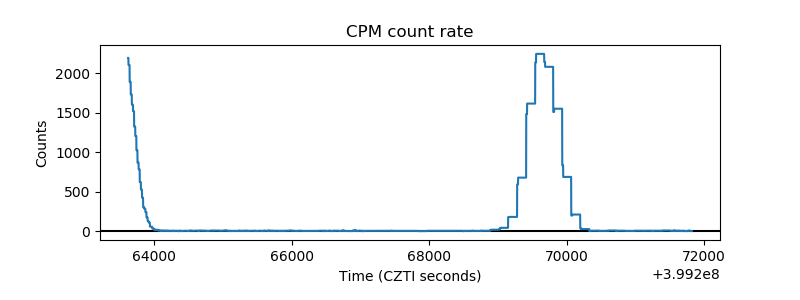 |
| CZT Counter | 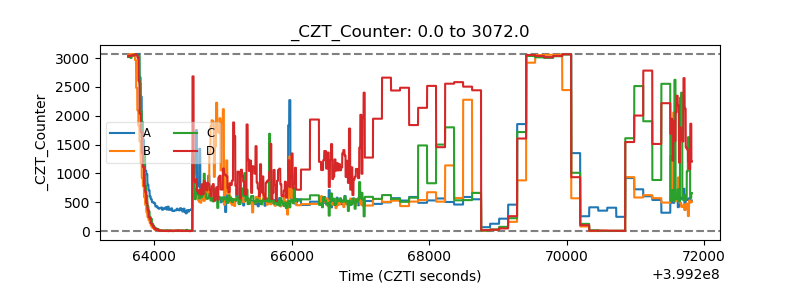 |
| +2.5 Volts monitor | 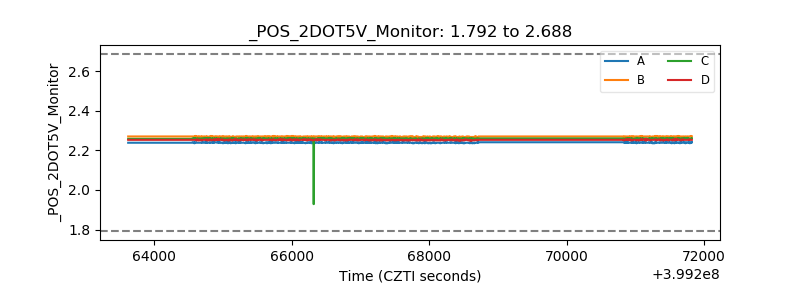 |
| +5 Volts monitor | 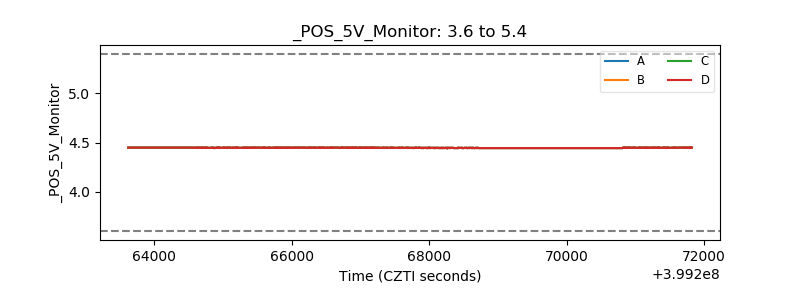 |
| _ROLL_ROT |  |
| _Roll_DEC | 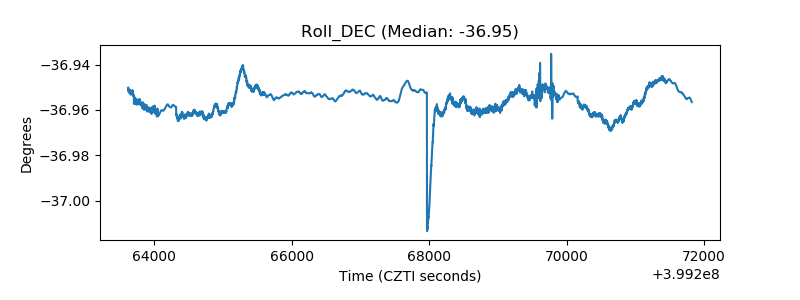 |
| _Roll_RA | 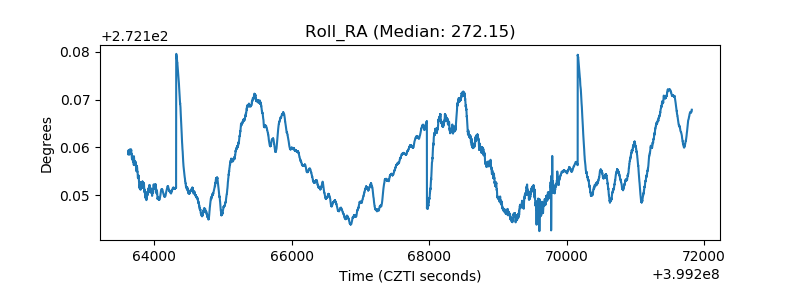 |
| Veto Counter | 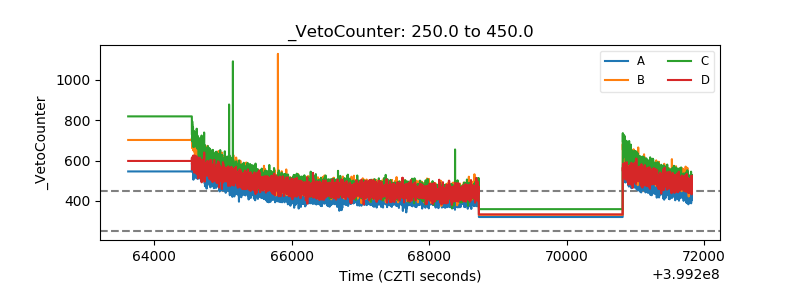 |