| Param | Original file | Final file |
|---|---|---|
| Filename | modeM0/AS1T05_048T01_9000005318_37377cztM0_level2.evt | modeM0/AS1T05_048T01_9000005318_37377cztM0_level2_quad_clean.evt |
| Size (bytes) | 575,285,760 | 54,181,440 |
| Size | 548.6 MB | 51.7 MB |
| Events in quadrant A | 2,733,321 | 337,605 |
| Events in quadrant B | 2,755,716 | 346,653 |
| Events in quadrant C | 3,275,289 | 347,697 |
| Events in quadrant D | 8,321,777 | 258,719 |
| Mode M0 | |||
|---|---|---|---|
| Quadrant | BADHDUFLAG | Total packets | Discarded packets |
| A | 0 | 10889 | 3 |
| B | 0 | 11050 | 2 |
| C | 0 | 12512 | 2 |
| D | 0 | 28216 | 2 |
| Mode SS | |||
|---|---|---|---|
| Quadrant | BADHDUFLAG | Total packets | Discarded packets |
| A | 0 | 102 | 0 |
| B | 0 | 102 | 0 |
| C | 0 | 102 | 0 |
| D | 0 | 102 | 0 |
| Mode M9 | |||
|---|---|---|---|
| Quadrant | BADHDUFLAG | Total packets | Discarded packets |
| A | 0 | 23 | 0 |
| B | 0 | 23 | 0 |
| C | 0 | 23 | 0 |
| D | 0 | 24 | 0 |
| Quadrant | Total seconds | Saturated seconds | Saturation percentage |
|---|---|---|---|
| A | 4973 | 10 | 0.201086% |
| B | 4973 | 43 | 0.864669% |
| C | 4973 | 187 | 3.760306% |
| D | 4973 | 1719 | 34.566660% |
Noise dominated data is calculated using 1-second bins in cleaned event files. If a bin has >2000 counts, and if more than 50% of those come from <1% of pixels, then it is considered to be noise-dominated and hence unusable.
| Quadrant | # 1 sec bins | Bins with >0 counts | Bins with >2000 counts | High rate bins dominated by noise | Noise dominated (total time) | Noise dominated (detector-on time) | Marked lightcurve |
|---|---|---|---|---|---|---|---|
| A | 7096 | 4974 | 3 | 3 | 0.04% | 0.06% | 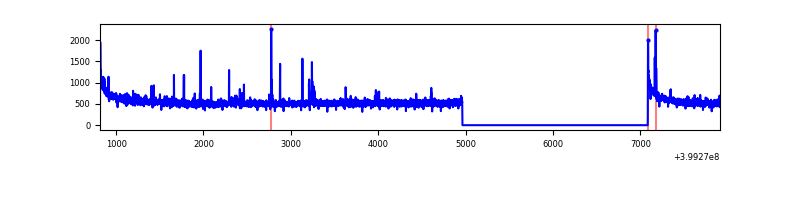 |
| B | 7096 | 4974 | 21 | 21 | 0.30% | 0.42% | 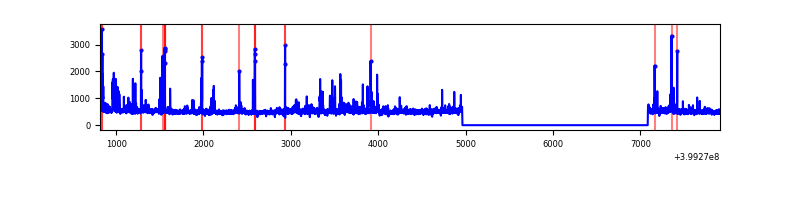 |
| C | 7096 | 4974 | 150 | 150 | 2.11% | 3.02% | 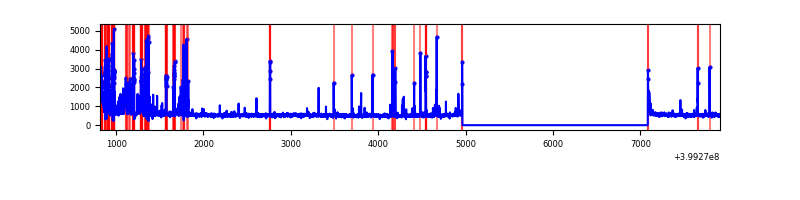 |
| D | 7096 | 4974 | 1641 | 1641 | 23.13% | 32.99% | 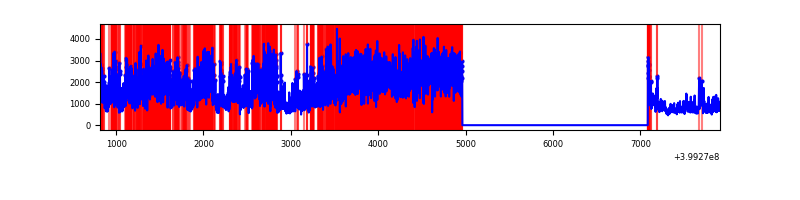 |
Top three noisy pixels from each quadrant. If the there are fewer than three noisy pixels in the level2.evt file, extra rows are filled as -1
| Pixel properties | Quadrant properties | ||||||
|---|---|---|---|---|---|---|---|
| Quadrant | DetID | PixID | Counts | Sigma | Mean | Median | Sigma |
| A | 10 | 83 | 270647 | 2200.56 | 616 | 606 | 122.7 |
| A | 13 | 248 | 63339 | 511.21 | 616 | 606 | 122.7 |
| A | 13 | 6 | 8139 | 61.39 | 616 | 606 | 122.7 |
| B | 5 | 172 | 123953 | 1063.25 | 613 | 597 | 116.0 |
| B | 0 | 229 | 60161 | 513.41 | 613 | 597 | 116.0 |
| B | 0 | 190 | 46296 | 393.9 | 613 | 597 | 116.0 |
| C | 1 | 23 | 583604 | 4217.62 | 599 | 605 | 138.2 |
| C | 15 | 214 | 212643 | 1533.96 | 599 | 605 | 138.2 |
| C | 0 | 10 | 89104 | 640.23 | 599 | 605 | 138.2 |
| D | 12 | 235 | 4811929 | 36096.69 | 545 | 530 | 133.3 |
| D | 12 | 227 | 898362 | 6735.83 | 545 | 530 | 133.3 |
| D | 2 | 249 | 376128 | 2817.86 | 545 | 530 | 133.3 |
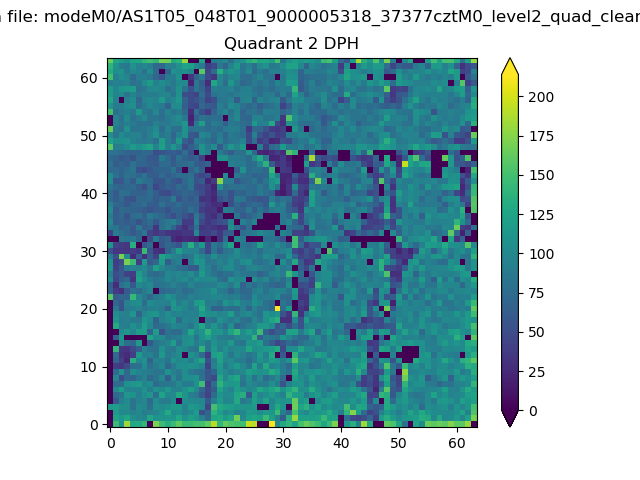
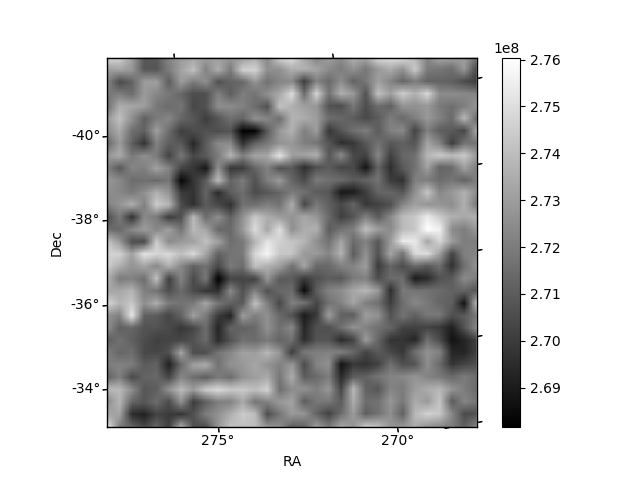
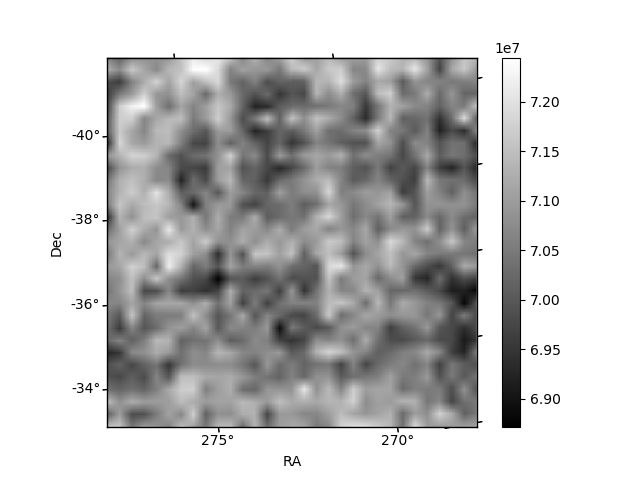
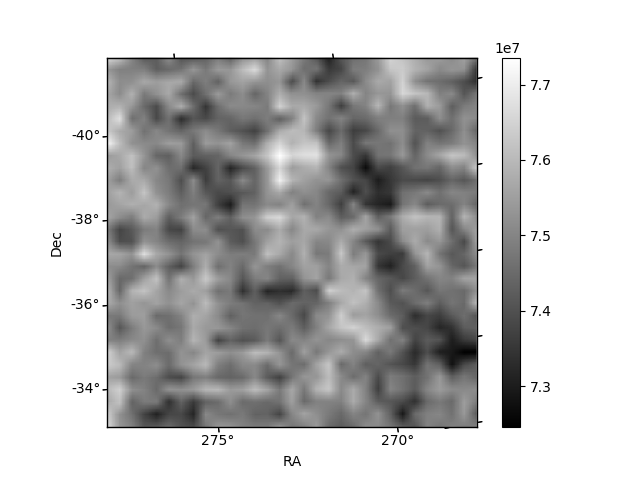
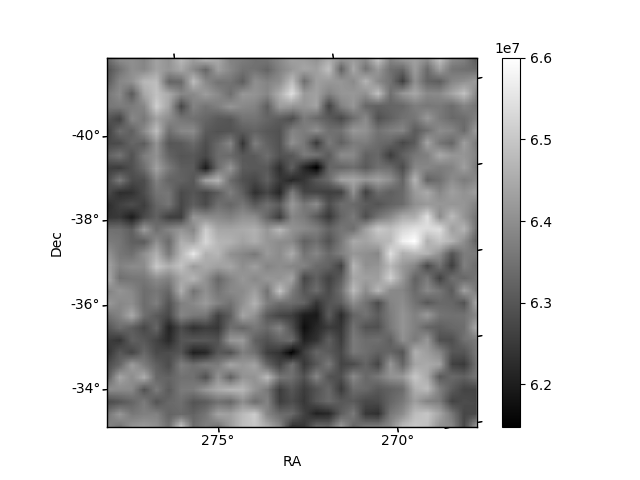
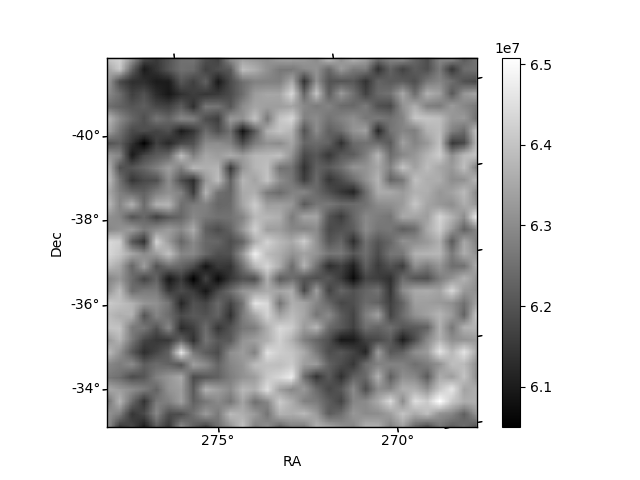
Histogram calculated using DETX and DETY for each event in the final _common_clean file
| Quadrant A | 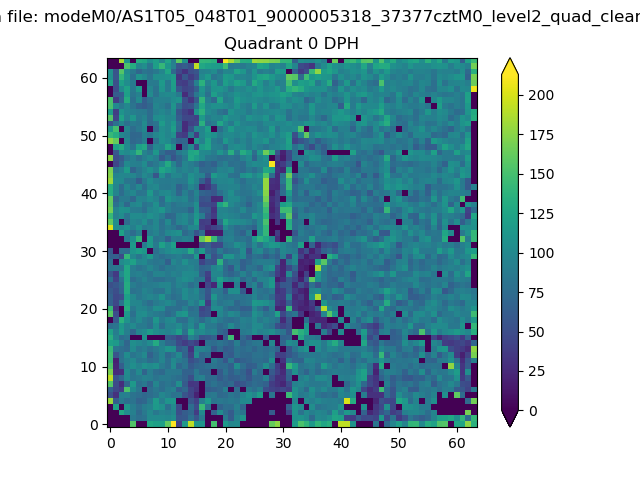 |
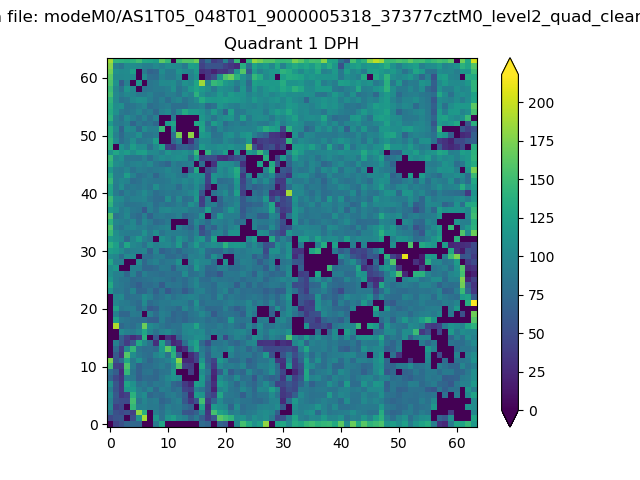 |
Quadrant B |
|---|---|---|---|
| Quadrant D | 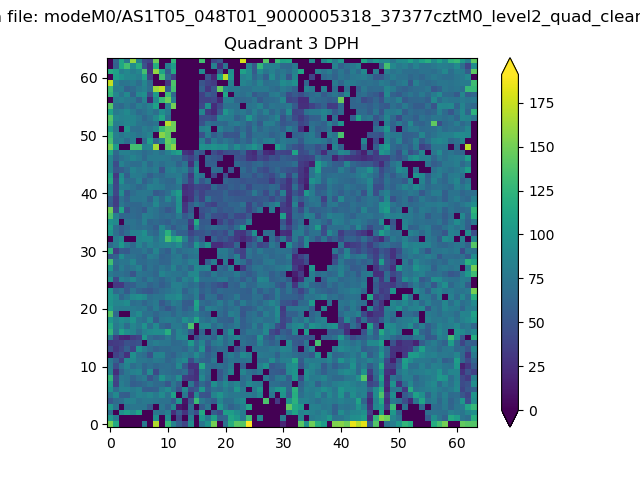 |
 |
Quadrant C |
| Plot type | Count rate plots | Images |
|---|---|---|
| Comparison with Poisson distribution Blue bars denote a histogram of data divided into 1 sec bins. Red curve is a Poisson curve with rate = median count rate of data. |
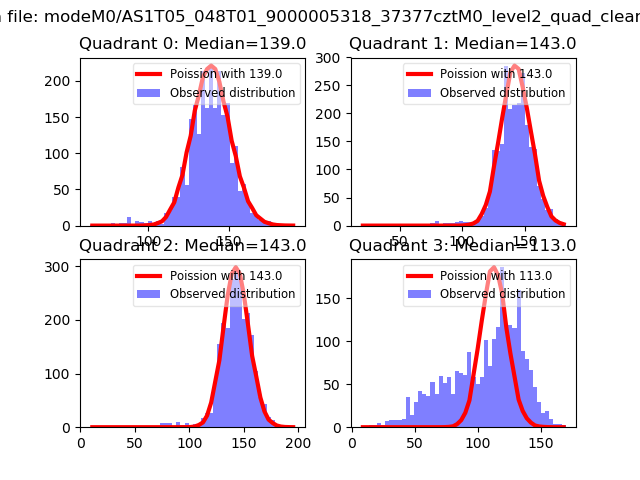 |
 |
| Quadrant-wise count rates Data is divided into 100 sec bins |
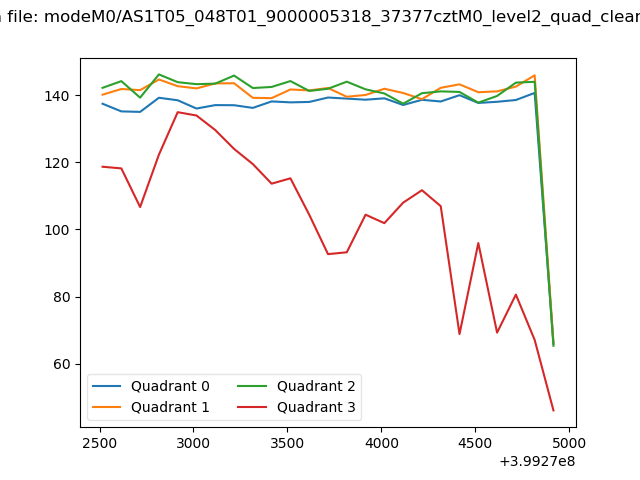 |
|
| Module-wise count rates for Quadrant A Data is divided into 100 sec bins |
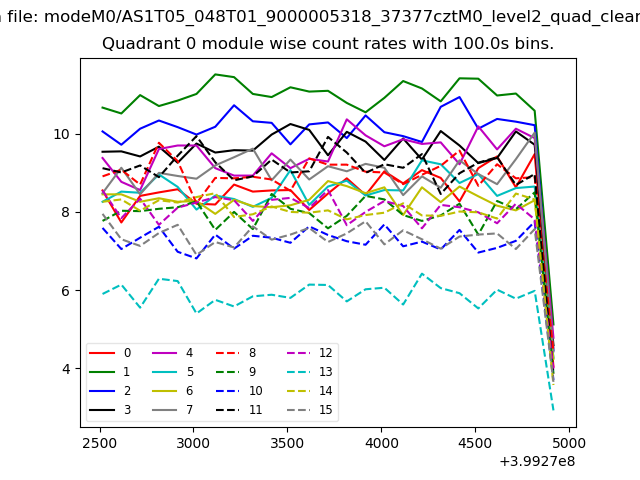 |
 |
| Module-wise count rates for Quadrant B Data is divided into 100 sec bins |
 |
 |
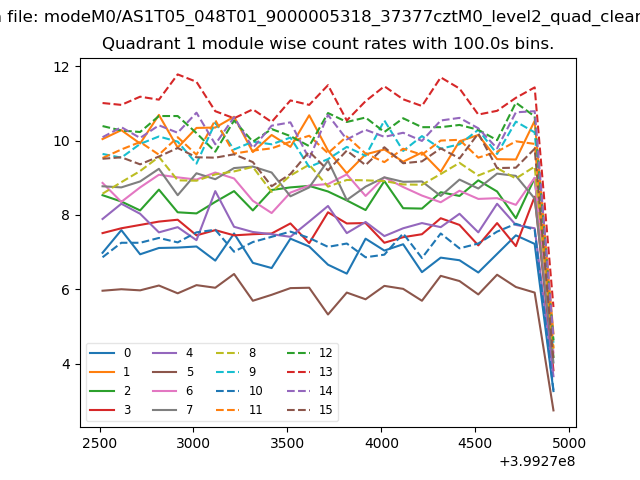
| Module-wise count rates for Quadrant C Data is divided into 100 sec bins |
 |
 |
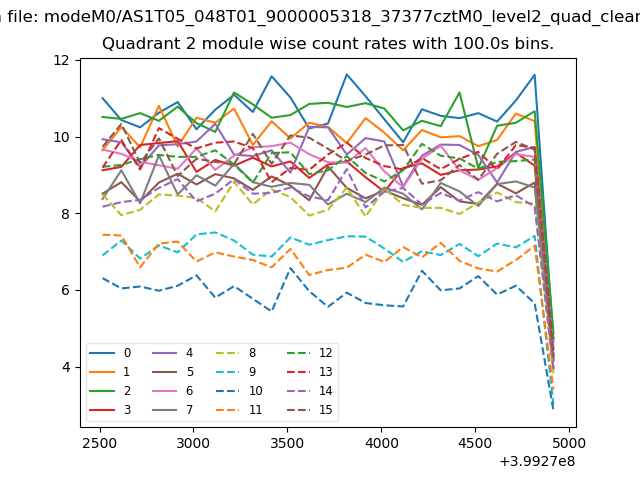
| Module-wise count rates for Quadrant D Data is divided into 100 sec bins |
 |
 |
| Parameter | Plot |
|---|---|
| CZT HV Monitor | 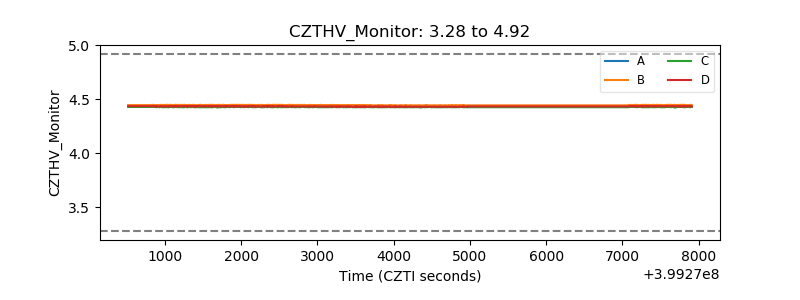 |
| D_VDD | 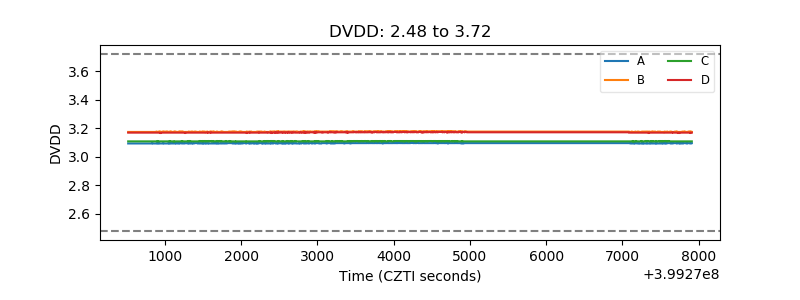 |
| Temperature 1 | 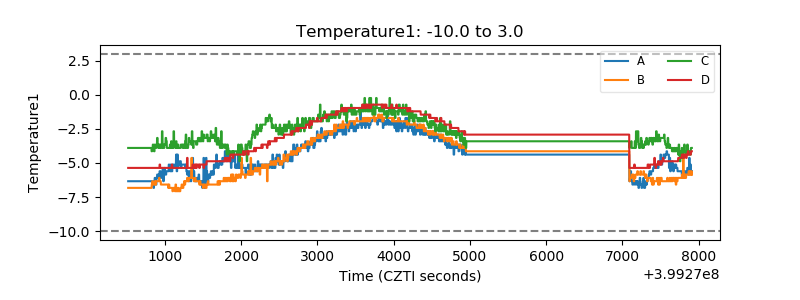 |
| Veto HV Monitor | 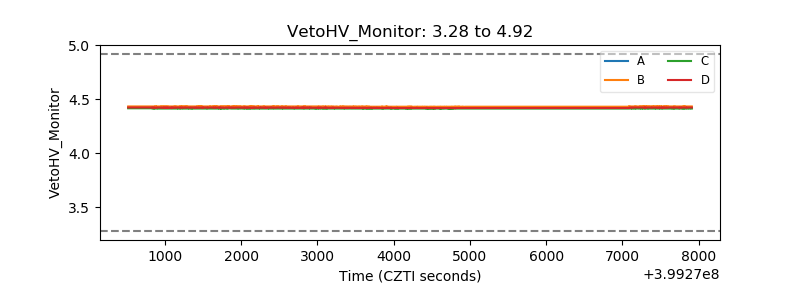 |
| Veto LLD | 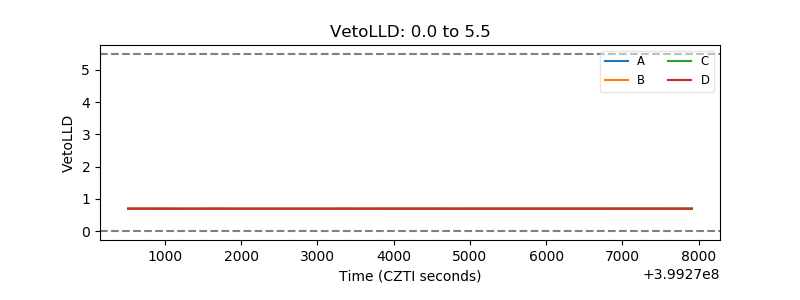 |
| Alpha Counter | 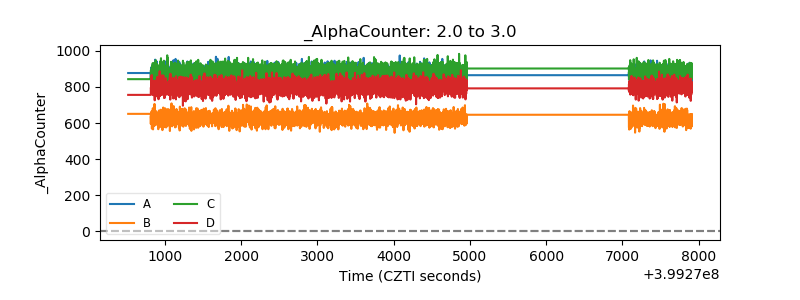 |
| _CPM_Rate | 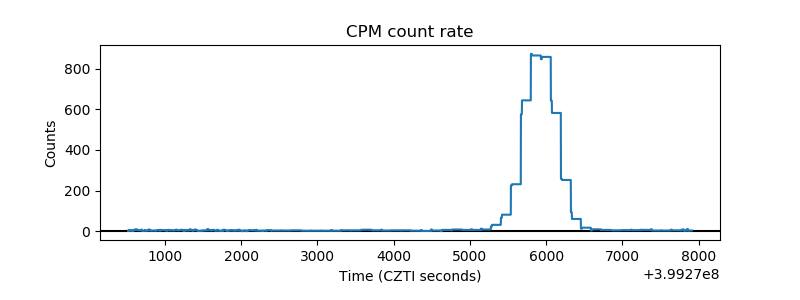 |
| CZT Counter | 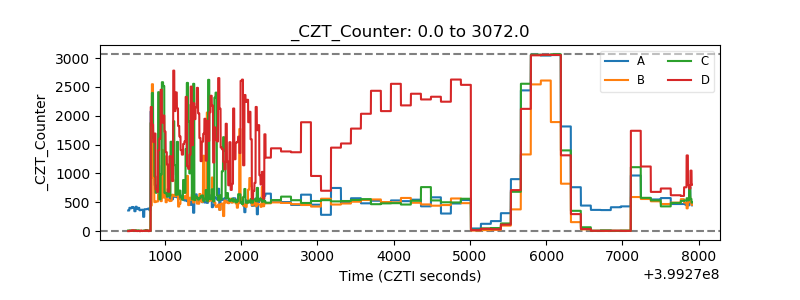 |
| +2.5 Volts monitor | 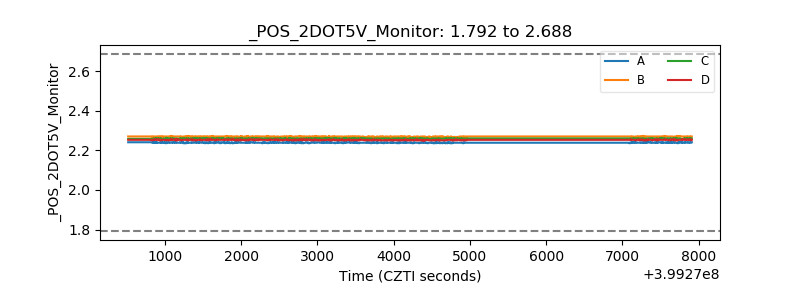 |
| +5 Volts monitor | 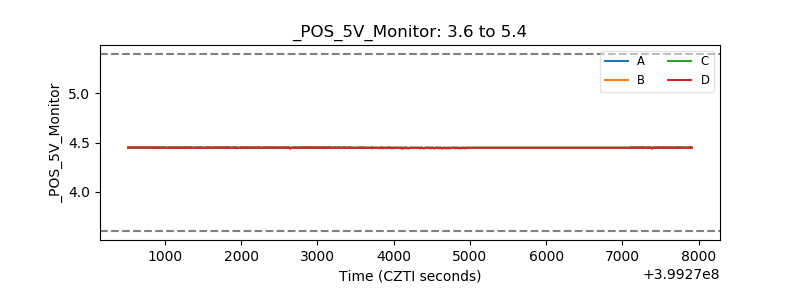 |
| _ROLL_ROT | 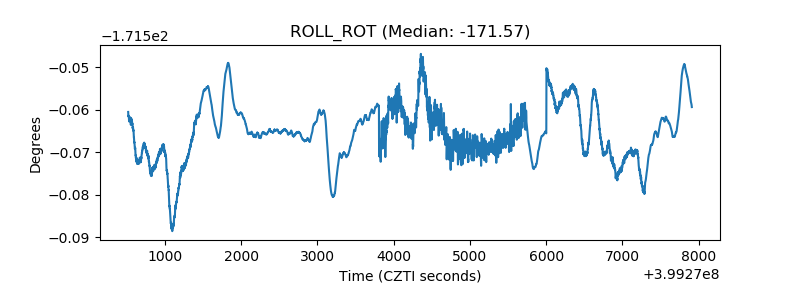 |
| _Roll_DEC | 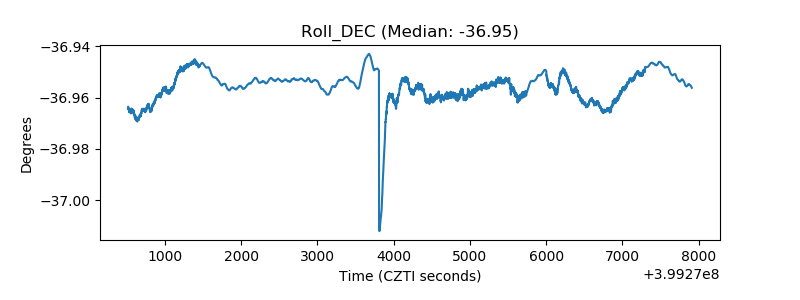 |
| _Roll_RA | 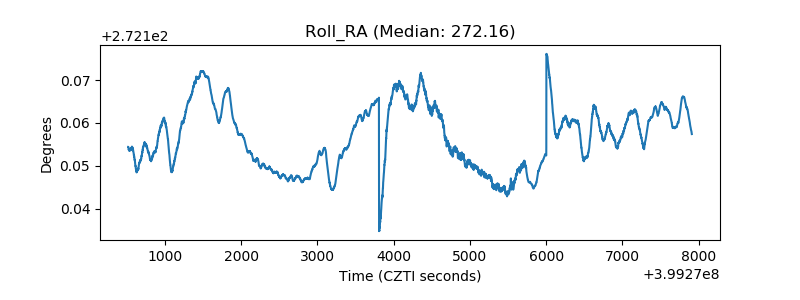 |
| Veto Counter | 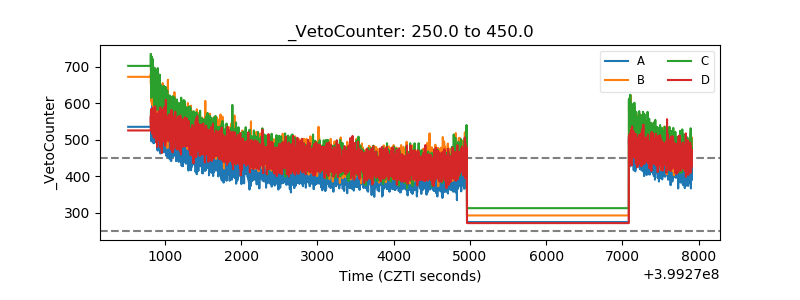 |