| Param | Original file | Final file |
|---|---|---|
| Filename | modeM0/AS1T05_048T01_9000005318_37378cztM0_level2.evt | modeM0/AS1T05_048T01_9000005318_37378cztM0_level2_quad_clean.evt |
| Size (bytes) | 513,221,760 | 61,470,720 |
| Size | 489.4 MB | 58.6 MB |
| Events in quadrant A | 2,627,892 | 391,891 |
| Events in quadrant B | 2,540,389 | 400,663 |
| Events in quadrant C | 2,625,677 | 403,549 |
| Events in quadrant D | 7,406,320 | 310,069 |
| Mode M0 | |||
|---|---|---|---|
| Quadrant | BADHDUFLAG | Total packets | Discarded packets |
| A | 0 | 10718 | 3 |
| B | 0 | 10568 | 2 |
| C | 0 | 10583 | 2 |
| D | 0 | 25605 | 2 |
| Mode SS | |||
|---|---|---|---|
| Quadrant | BADHDUFLAG | Total packets | Discarded packets |
| A | 0 | 104 | 0 |
| B | 0 | 104 | 0 |
| C | 0 | 104 | 0 |
| D | 0 | 104 | 0 |
| Mode M9 | |||
|---|---|---|---|
| Quadrant | BADHDUFLAG | Total packets | Discarded packets |
| A | 0 | 30 | 0 |
| B | 0 | 30 | 0 |
| C | 0 | 30 | 0 |
| D | 0 | 31 | 0 |
| Quadrant | Total seconds | Saturated seconds | Saturation percentage |
|---|---|---|---|
| A | 5054 | 9 | 0.178077% |
| B | 5054 | 24 | 0.474871% |
| C | 5054 | 17 | 0.336367% |
| D | 5054 | 1201 | 23.763356% |
Noise dominated data is calculated using 1-second bins in cleaned event files. If a bin has >2000 counts, and if more than 50% of those come from <1% of pixels, then it is considered to be noise-dominated and hence unusable.
| Quadrant | # 1 sec bins | Bins with >0 counts | Bins with >2000 counts | High rate bins dominated by noise | Noise dominated (total time) | Noise dominated (detector-on time) | Marked lightcurve |
|---|---|---|---|---|---|---|---|
| A | 7087 | 5055 | 3 | 3 | 0.04% | 0.06% | 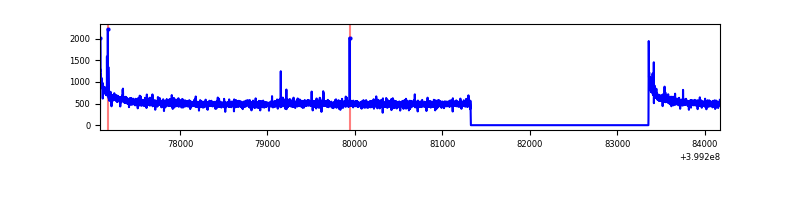 |
| B | 7087 | 5055 | 11 | 11 | 0.16% | 0.22% | 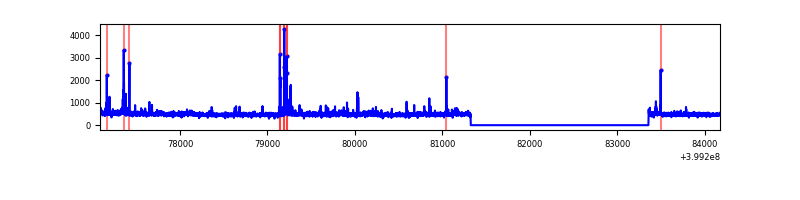 |
| C | 7087 | 5055 | 11 | 11 | 0.16% | 0.22% | 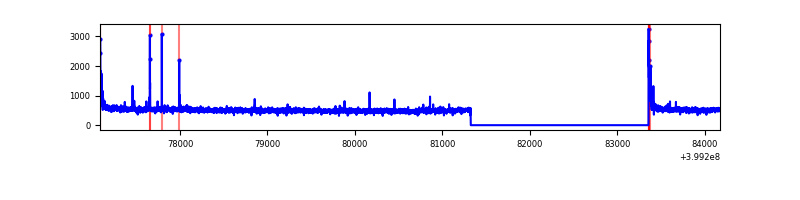 |
| D | 7087 | 5055 | 1209 | 1209 | 17.06% | 23.92% | 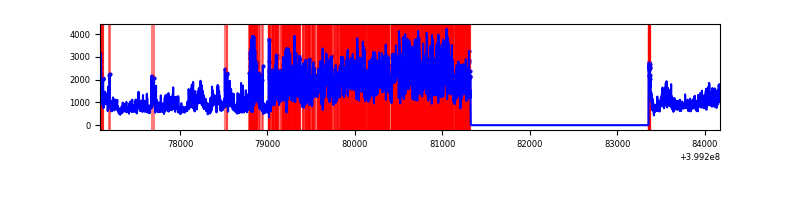 |
Top three noisy pixels from each quadrant. If the there are fewer than three noisy pixels in the level2.evt file, extra rows are filled as -1
| Pixel properties | Quadrant properties | ||||||
|---|---|---|---|---|---|---|---|
| Quadrant | DetID | PixID | Counts | Sigma | Mean | Median | Sigma |
| A | 10 | 83 | 272074 | 2257.05 | 601 | 590 | 120.3 |
| A | 13 | 248 | 14348 | 114.38 | 601 | 590 | 120.3 |
| A | 13 | 6 | 7615 | 58.4 | 601 | 590 | 120.3 |
| B | 5 | 172 | 88944 | 766.69 | 600 | 585 | 115.2 |
| B | 0 | 245 | 30876 | 262.83 | 600 | 585 | 115.2 |
| B | 0 | 190 | 14602 | 121.63 | 600 | 585 | 115.2 |
| C | 15 | 214 | 217931 | 1599.14 | 589 | 595 | 135.9 |
| C | 0 | 10 | 70203 | 512.17 | 589 | 595 | 135.9 |
| C | 15 | 208 | 9547 | 65.87 | 589 | 595 | 135.9 |
| D | 12 | 235 | 3816542 | 28512.85 | 541 | 526 | 133.8 |
| D | 2 | 249 | 1009845 | 7541.52 | 541 | 526 | 133.8 |
| D | 12 | 227 | 408153 | 3045.74 | 541 | 526 | 133.8 |
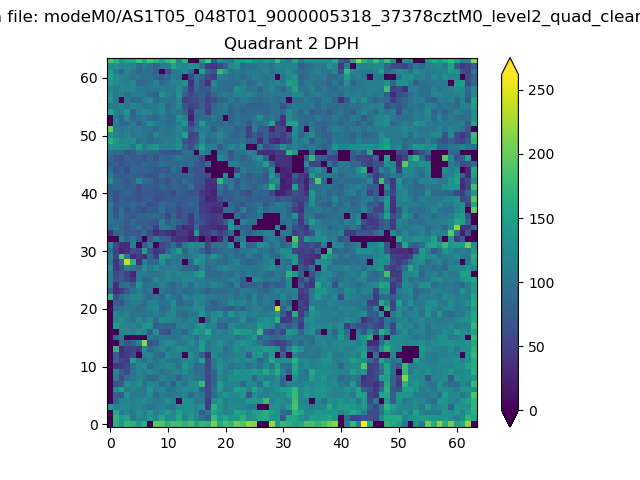
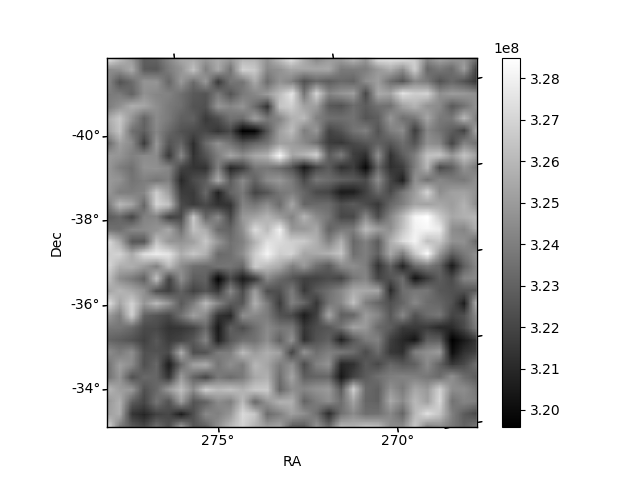
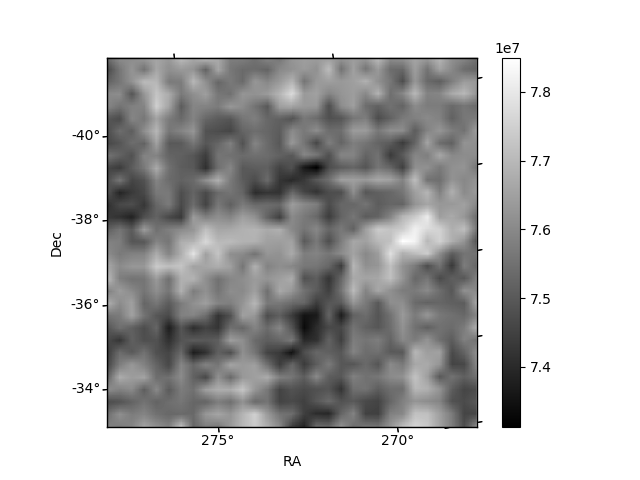
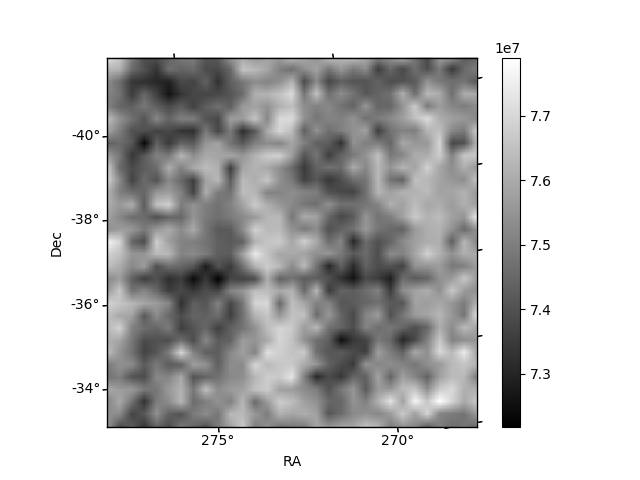
Histogram calculated using DETX and DETY for each event in the final _common_clean file
| Quadrant A | 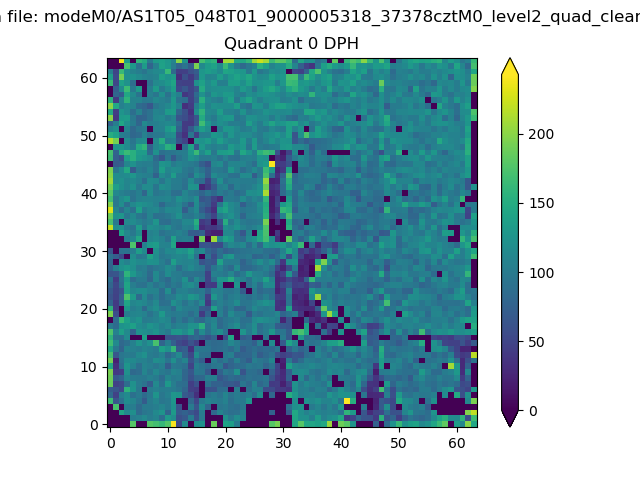 |
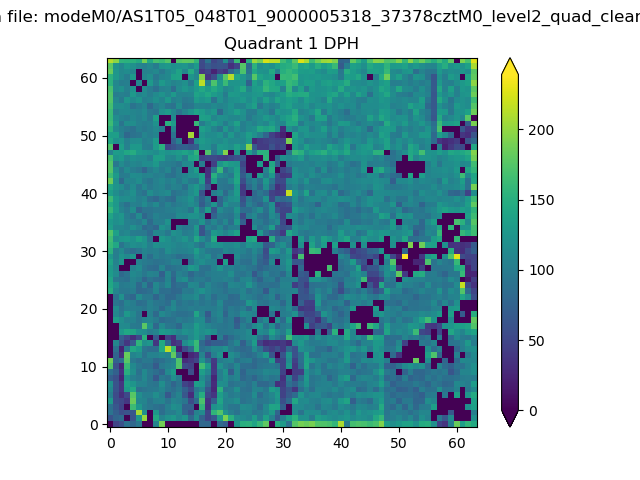 |
Quadrant B |
|---|---|---|---|
| Quadrant D | 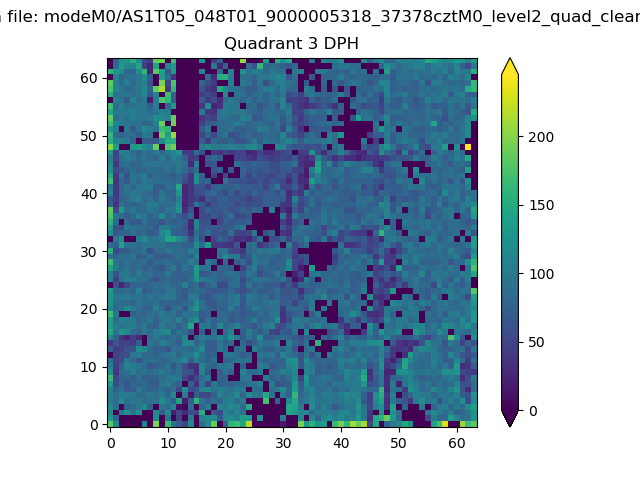 |
 |
Quadrant C |
| Plot type | Count rate plots | Images |
|---|---|---|
| Comparison with Poisson distribution Blue bars denote a histogram of data divided into 1 sec bins. Red curve is a Poisson curve with rate = median count rate of data. |
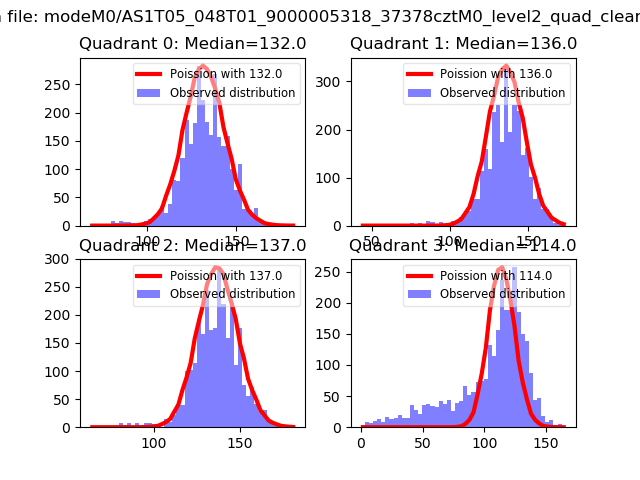 |
 |
| Quadrant-wise count rates Data is divided into 100 sec bins |
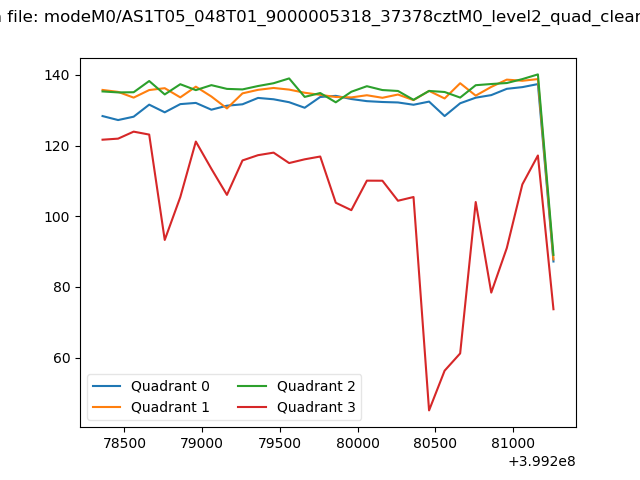 |
|
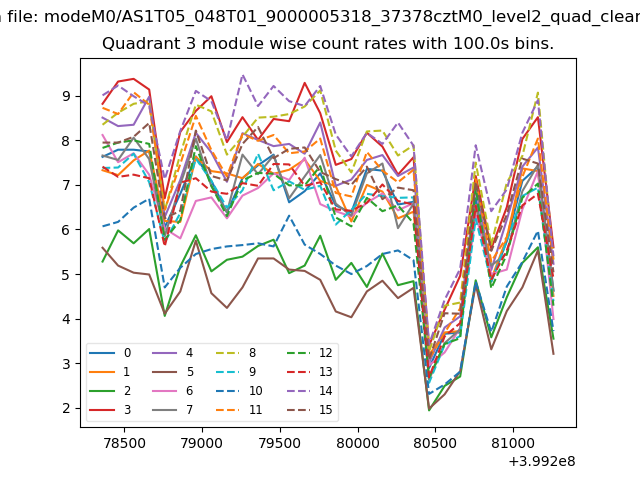
| Module-wise count rates for Quadrant A Data is divided into 100 sec bins |
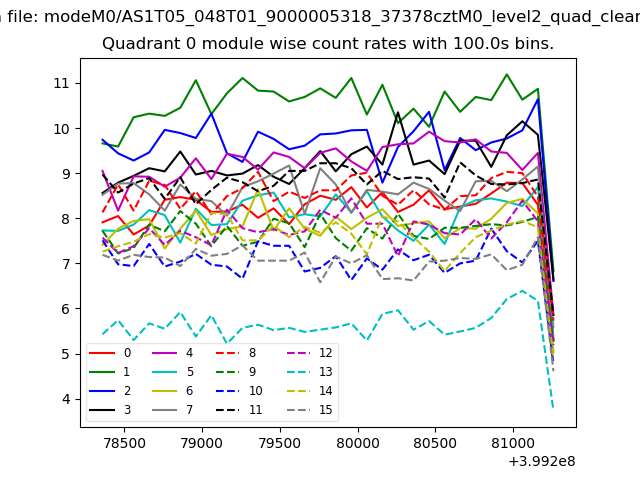 |
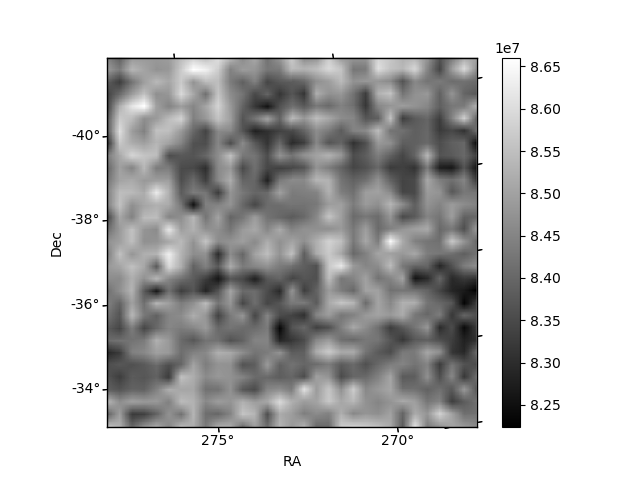 |
| Module-wise count rates for Quadrant B Data is divided into 100 sec bins |
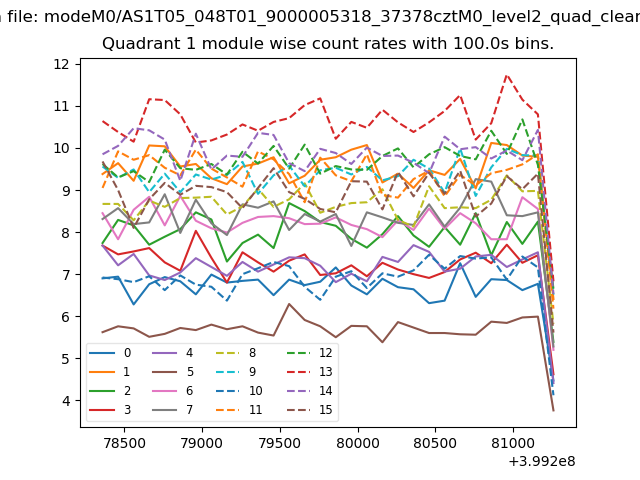 |
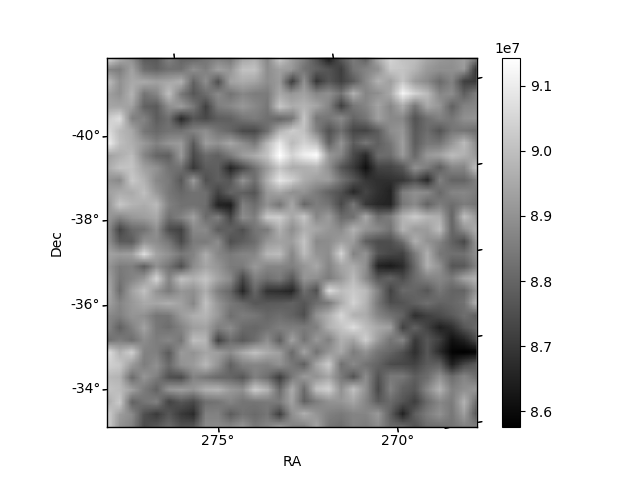 |
| Module-wise count rates for Quadrant C Data is divided into 100 sec bins |
 |
 |
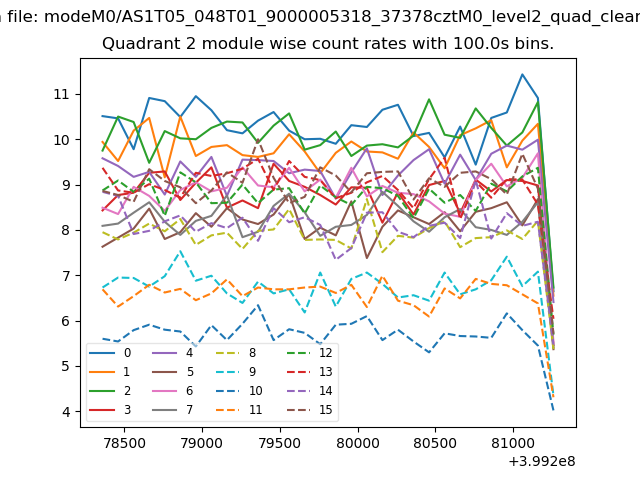
| Module-wise count rates for Quadrant D Data is divided into 100 sec bins |
 |
 |
| Parameter | Plot |
|---|---|
| CZT HV Monitor |  |
| D_VDD | 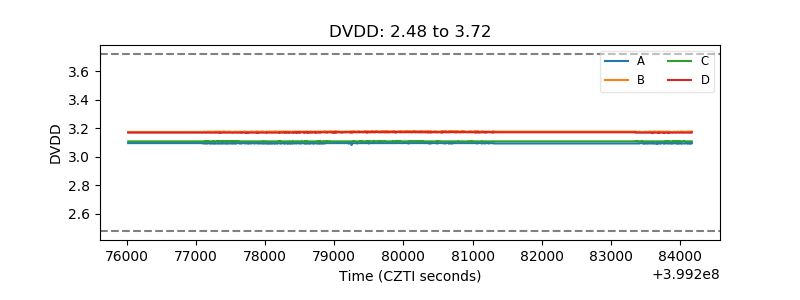 |
| Temperature 1 | 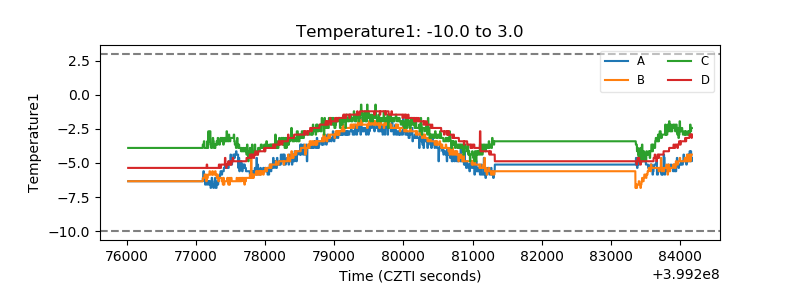 |
| Veto HV Monitor | 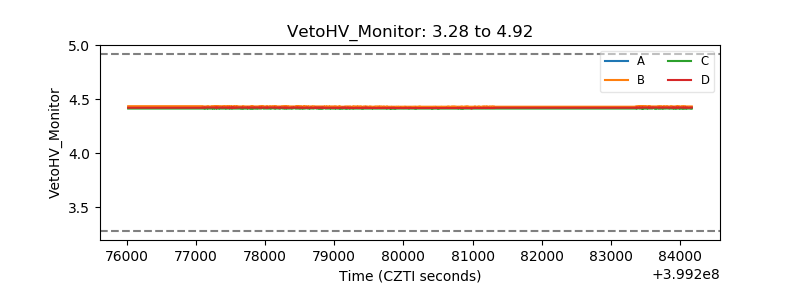 |
| Veto LLD | 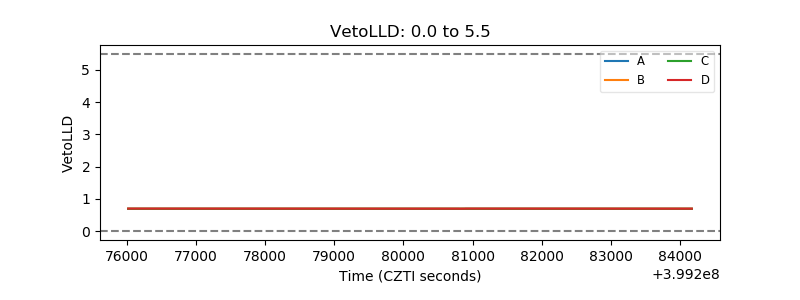 |
| Alpha Counter | 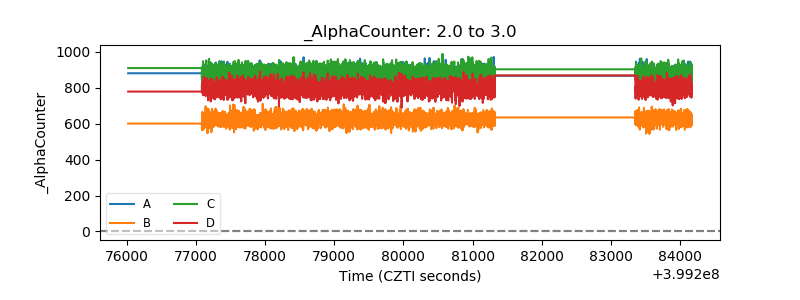 |
| _CPM_Rate | 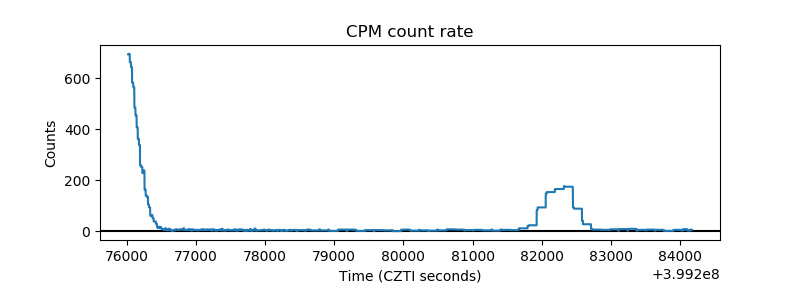 |
| CZT Counter | 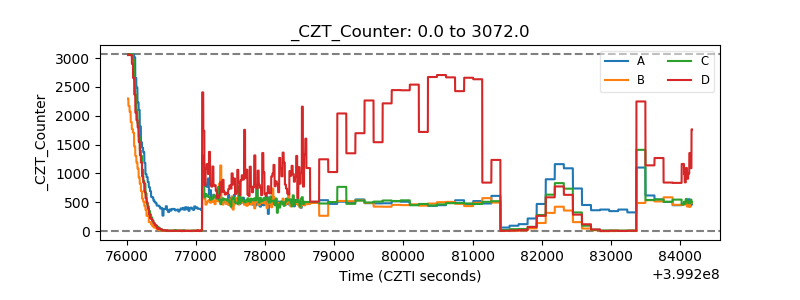 |
| +2.5 Volts monitor | 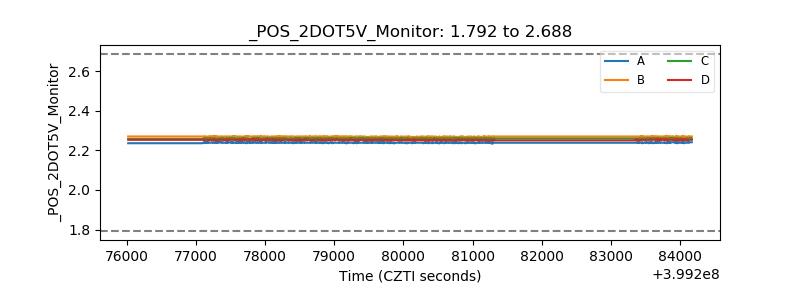 |
| +5 Volts monitor | 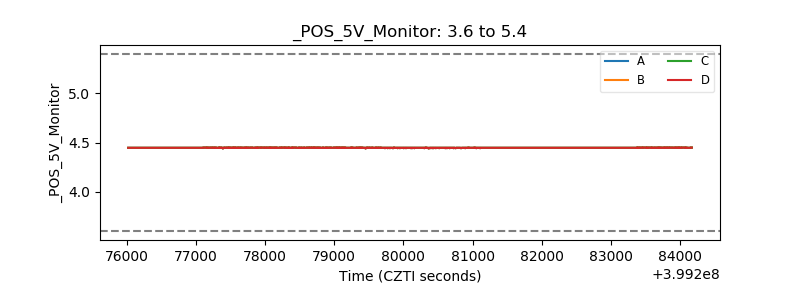 |
| _ROLL_ROT | 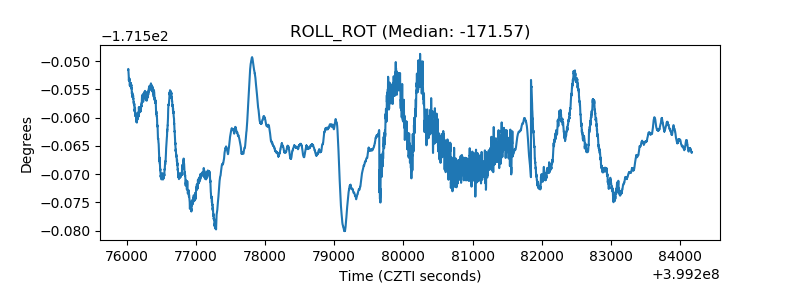 |
| _Roll_DEC | 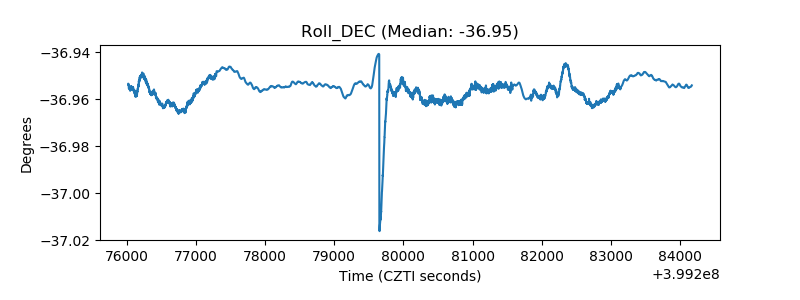 |
| _Roll_RA | 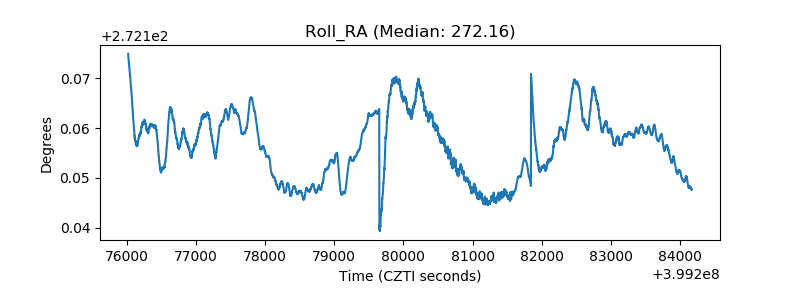 |
| Veto Counter | 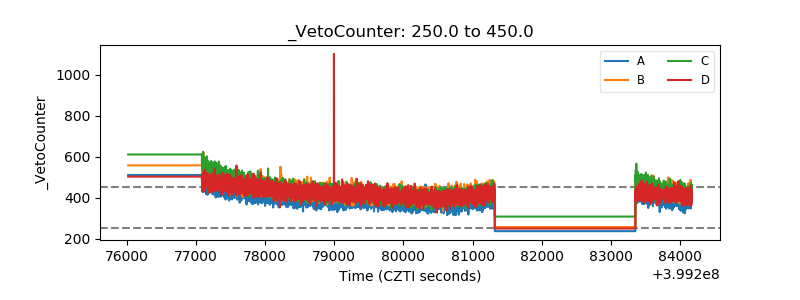 |