| Param | Original file | Final file |
|---|---|---|
| Filename | modeM0/AS1T05_048T01_9000005318_37379cztM0_level2.evt | modeM0/AS1T05_048T01_9000005318_37379cztM0_level2_quad_clean.evt |
| Size (bytes) | 591,906,240 | 75,795,840 |
| Size | 564.5 MB | 72.3 MB |
| Events in quadrant A | 2,682,655 | 507,050 |
| Events in quadrant B | 2,744,644 | 517,315 |
| Events in quadrant C | 2,864,342 | 519,377 |
| Events in quadrant D | 9,276,448 | 380,292 |
| Mode M0 | |||
|---|---|---|---|
| Quadrant | BADHDUFLAG | Total packets | Discarded packets |
| A | 0 | 11139 | 3 |
| B | 0 | 11521 | 2 |
| C | 0 | 11596 | 2 |
| D | 0 | 31230 | 2 |
| Mode SS | |||
|---|---|---|---|
| Quadrant | BADHDUFLAG | Total packets | Discarded packets |
| A | 0 | 106 | 0 |
| B | 0 | 106 | 0 |
| C | 0 | 106 | 0 |
| D | 0 | 106 | 0 |
| Mode M9 | |||
|---|---|---|---|
| Quadrant | BADHDUFLAG | Total packets | Discarded packets |
| A | 0 | 30 | 0 |
| B | 0 | 30 | 0 |
| C | 0 | 30 | 0 |
| D | 0 | 31 | 0 |
| Quadrant | Total seconds | Saturated seconds | Saturation percentage |
|---|---|---|---|
| A | 5291 | 11 | 0.207900% |
| B | 5291 | 38 | 0.718201% |
| C | 5291 | 51 | 0.963901% |
| D | 5291 | 2223 | 42.014742% |
Noise dominated data is calculated using 1-second bins in cleaned event files. If a bin has >2000 counts, and if more than 50% of those come from <1% of pixels, then it is considered to be noise-dominated and hence unusable.
| Quadrant | # 1 sec bins | Bins with >0 counts | Bins with >2000 counts | High rate bins dominated by noise | Noise dominated (total time) | Noise dominated (detector-on time) | Marked lightcurve |
|---|---|---|---|---|---|---|---|
| A | 7055 | 5292 | 2 | 2 | 0.03% | 0.04% | 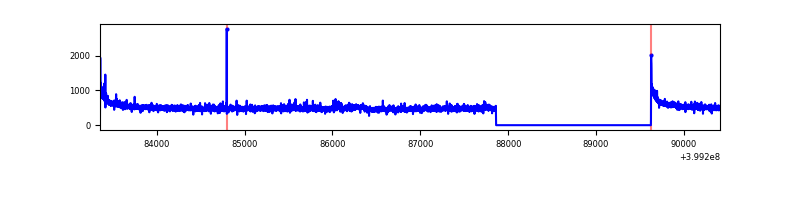 |
| B | 7055 | 5292 | 19 | 19 | 0.27% | 0.36% | 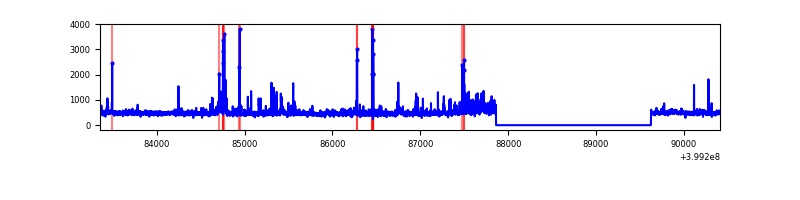 |
| C | 7055 | 5292 | 40 | 40 | 0.57% | 0.76% | 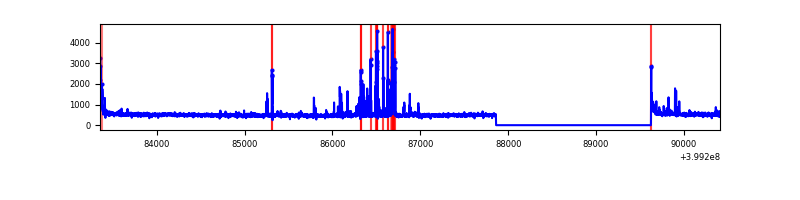 |
| D | 7055 | 5292 | 2189 | 2189 | 31.03% | 41.36% | 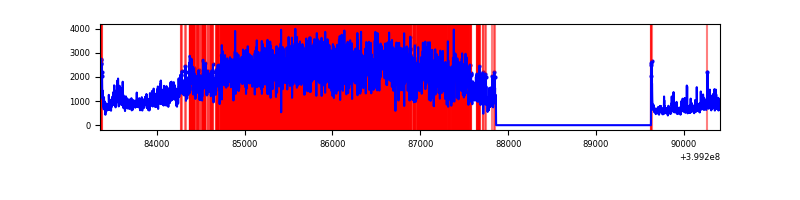 |
Top three noisy pixels from each quadrant. If the there are fewer than three noisy pixels in the level2.evt file, extra rows are filled as -1
| Pixel properties | Quadrant properties | ||||||
|---|---|---|---|---|---|---|---|
| Quadrant | DetID | PixID | Counts | Sigma | Mean | Median | Sigma |
| A | 10 | 83 | 277155 | 2246.97 | 608 | 597 | 123.1 |
| A | 13 | 6 | 23981 | 189.99 | 608 | 597 | 123.1 |
| A | 7 | 3 | 12981 | 100.62 | 608 | 597 | 123.1 |
| B | 0 | 190 | 109753 | 933.86 | 605 | 591 | 116.9 |
| B | 5 | 172 | 73589 | 624.48 | 605 | 591 | 116.9 |
| B | 0 | 229 | 47976 | 405.37 | 605 | 591 | 116.9 |
| C | 1 | 23 | 252218 | 1835.03 | 592 | 597 | 137.1 |
| C | 15 | 214 | 227072 | 1651.65 | 592 | 597 | 137.1 |
| C | 0 | 10 | 64390 | 465.23 | 592 | 597 | 137.1 |
| D | 12 | 235 | 6806414 | 52994.93 | 519 | 505 | 128.4 |
| D | 13 | 249 | 189202 | 1469.31 | 519 | 505 | 128.4 |
| D | 2 | 249 | 158708 | 1231.86 | 519 | 505 | 128.4 |
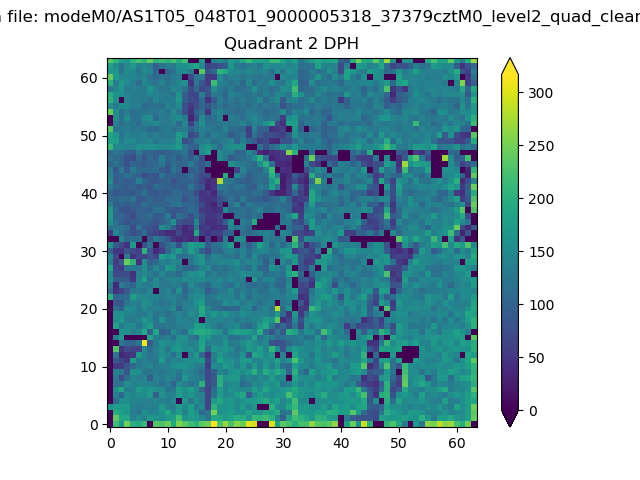
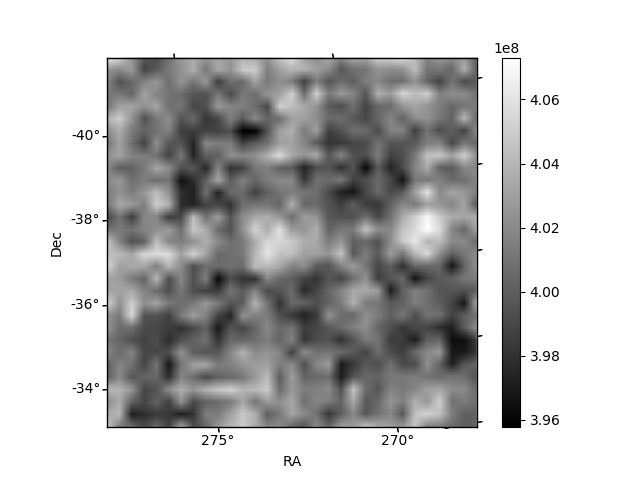
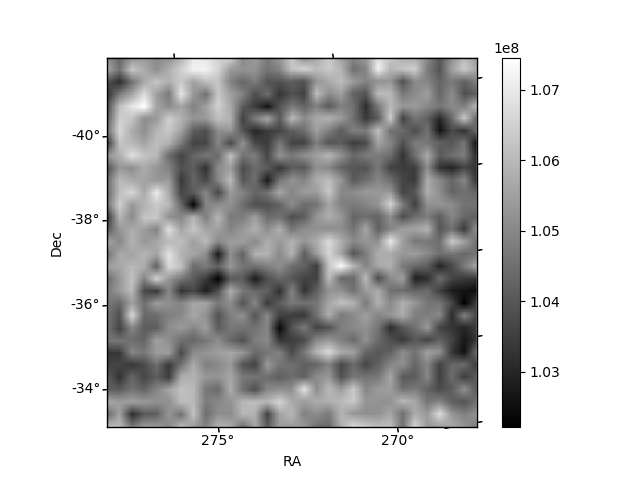
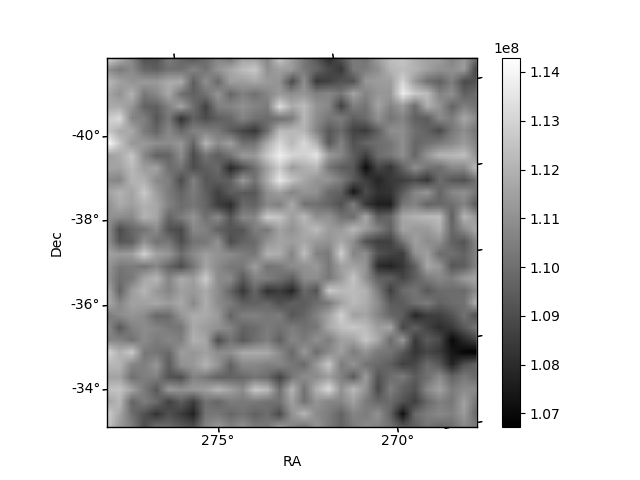
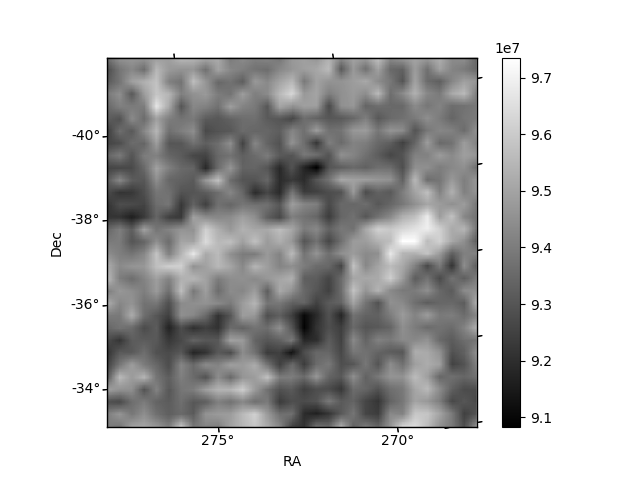
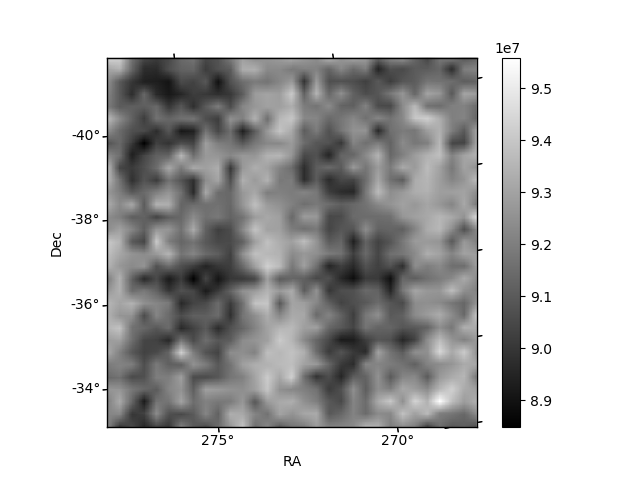
Histogram calculated using DETX and DETY for each event in the final _common_clean file
| Quadrant A | 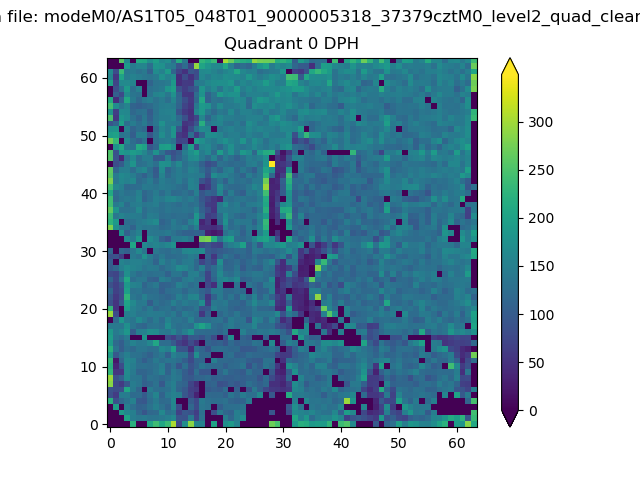 |
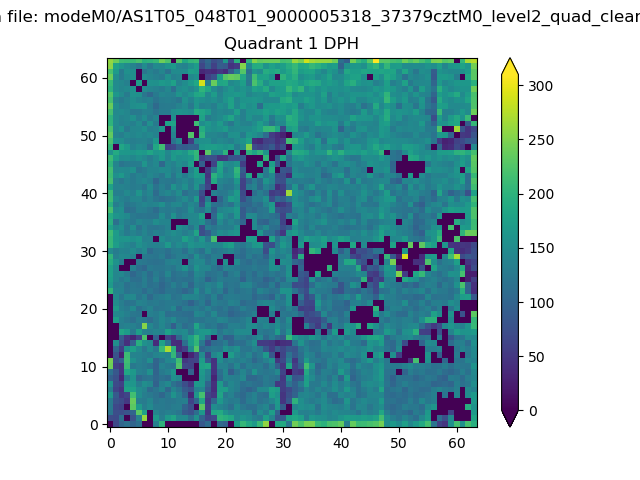 |
Quadrant B |
|---|---|---|---|
| Quadrant D | 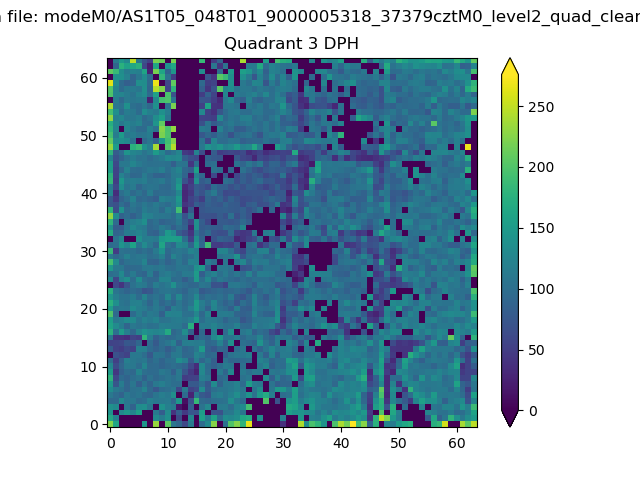 |
 |
Quadrant C |
| Plot type | Count rate plots | Images |
|---|---|---|
| Comparison with Poisson distribution Blue bars denote a histogram of data divided into 1 sec bins. Red curve is a Poisson curve with rate = median count rate of data. |
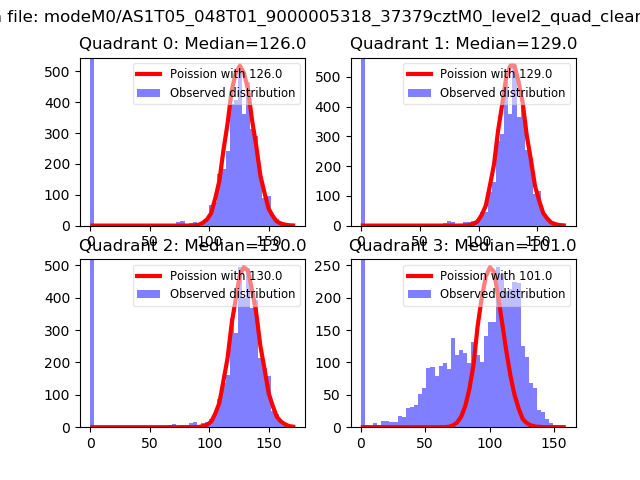 |
 |
| Quadrant-wise count rates Data is divided into 100 sec bins |
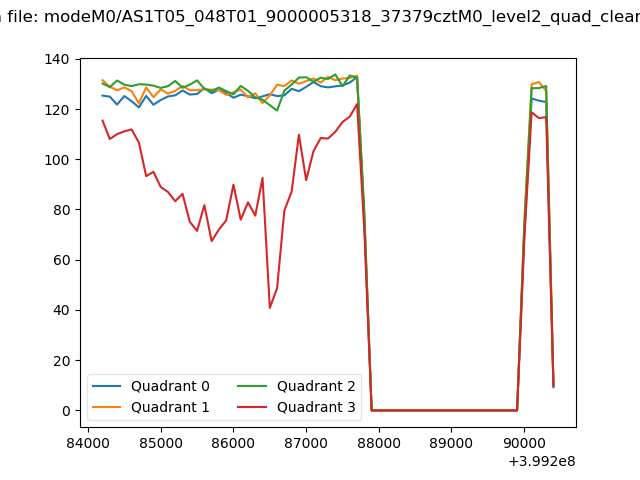 |
|
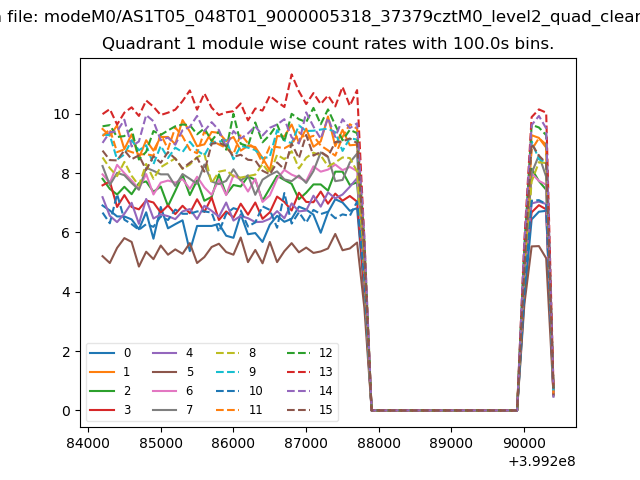
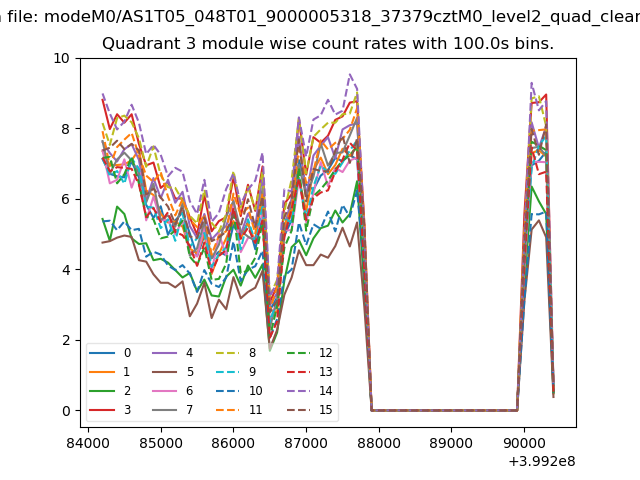
| Module-wise count rates for Quadrant A Data is divided into 100 sec bins |
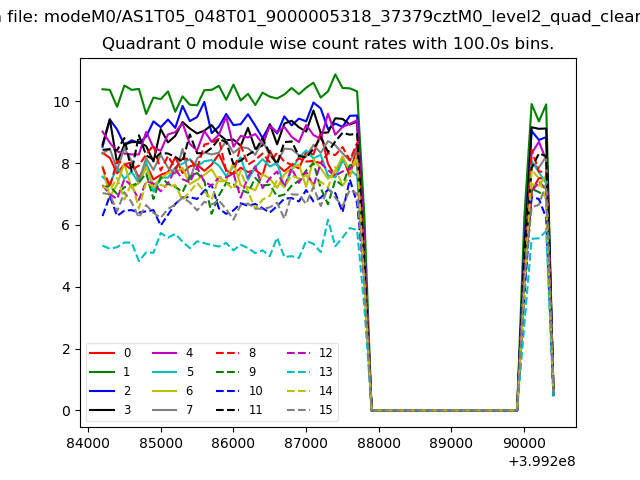 |
 |
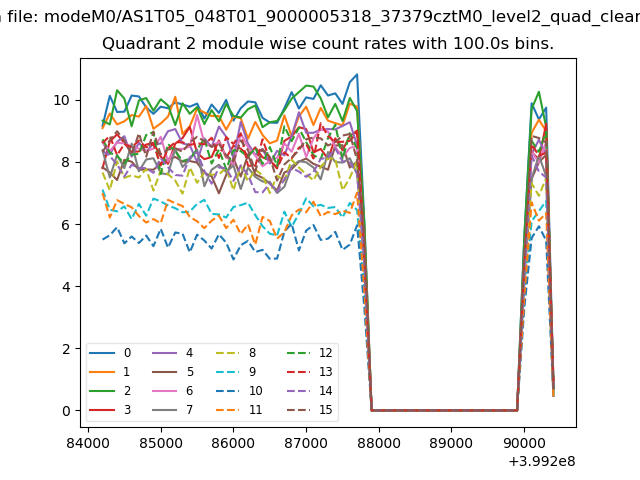
| Module-wise count rates for Quadrant B Data is divided into 100 sec bins |
 |
 |
| Module-wise count rates for Quadrant C Data is divided into 100 sec bins |
 |
 |
| Module-wise count rates for Quadrant D Data is divided into 100 sec bins |
 |
 |
| Parameter | Plot |
|---|---|
| CZT HV Monitor | 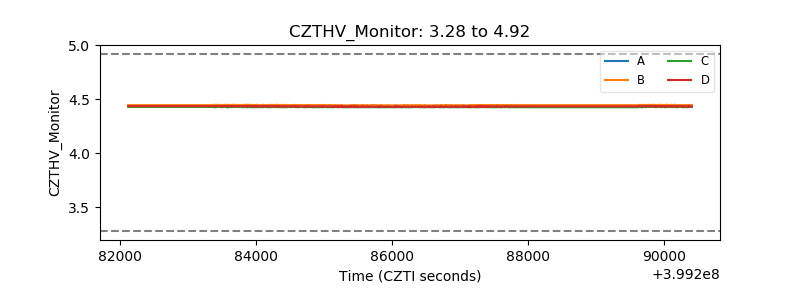 |
| D_VDD | 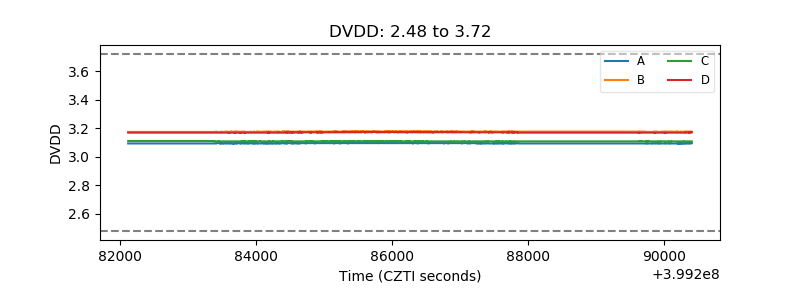 |
| Temperature 1 | 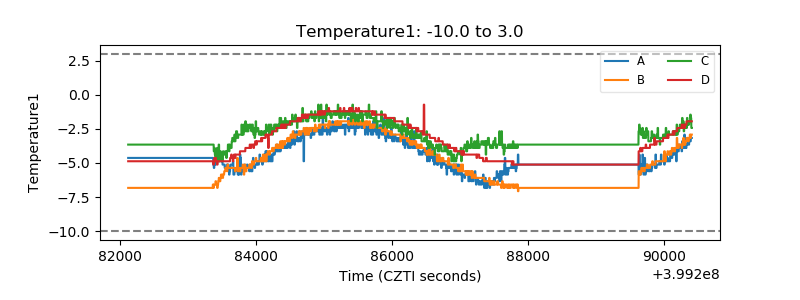 |
| Veto HV Monitor | 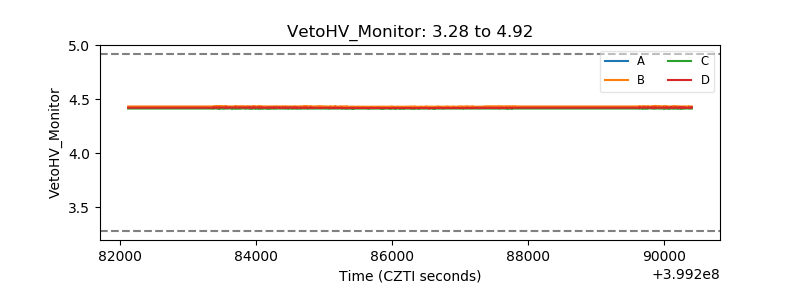 |
| Veto LLD | 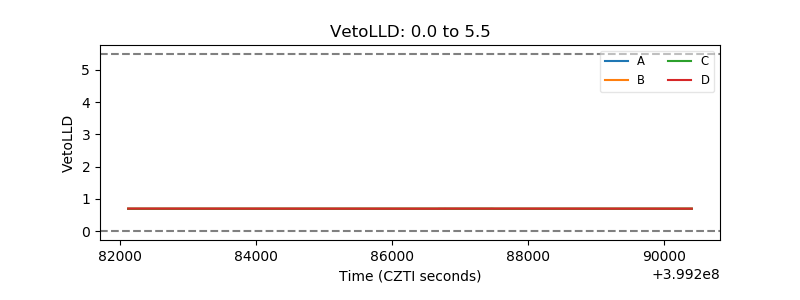 |
| Alpha Counter | 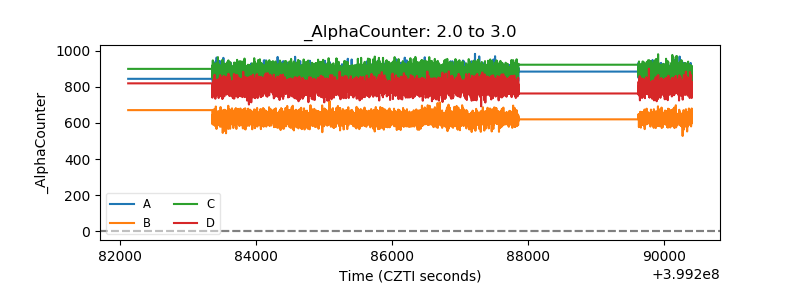 |
| _CPM_Rate | 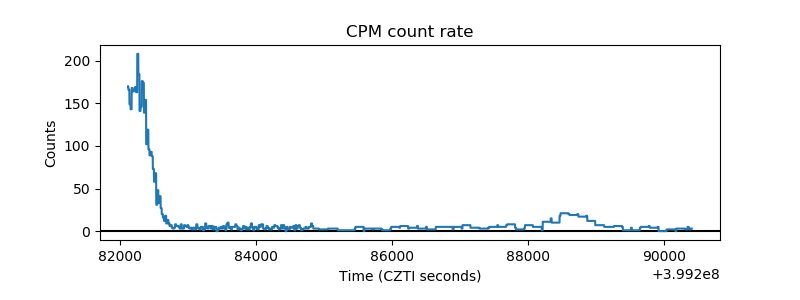 |
| CZT Counter | 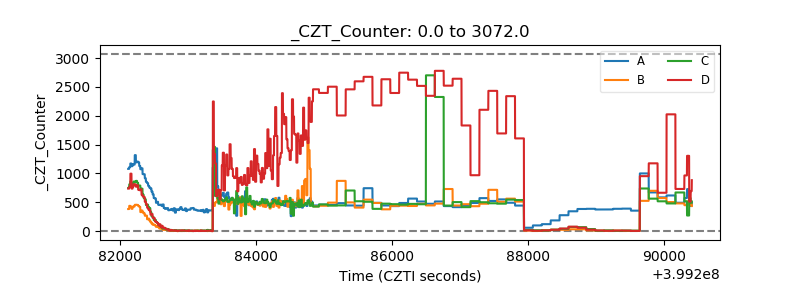 |
| +2.5 Volts monitor | 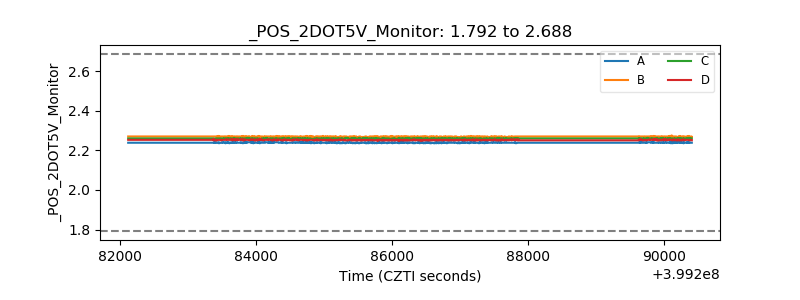 |
| +5 Volts monitor | 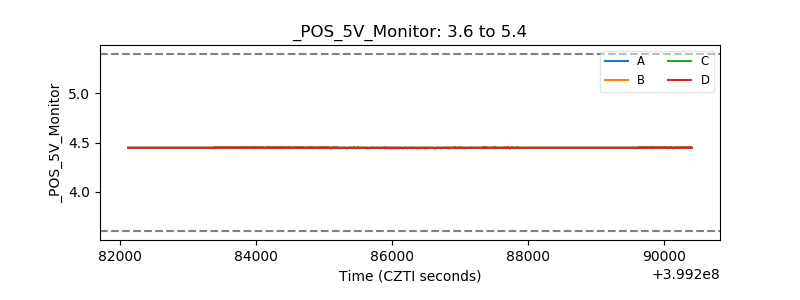 |
| _ROLL_ROT |  |
| _Roll_DEC | 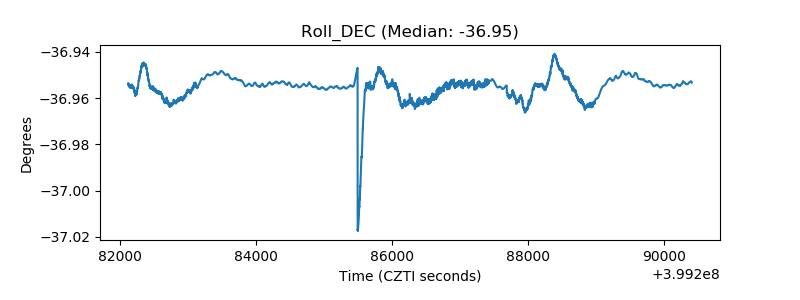 |
| _Roll_RA | 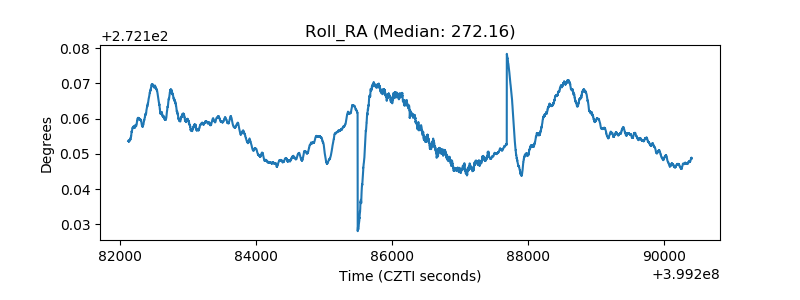 |
| Veto Counter | 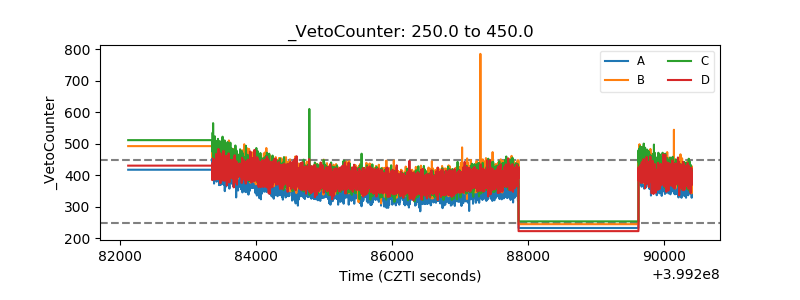 |