| Param | Original file | Final file |
|---|---|---|
| Filename | modeM0/AS1T05_048T01_9000005318_37380cztM0_level2.evt | modeM0/AS1T05_048T01_9000005318_37380cztM0_level2_quad_clean.evt |
| Size (bytes) | 610,274,880 | 89,092,800 |
| Size | 582.0 MB | 85.0 MB |
| Events in quadrant A | 2,989,925 | 582,742 |
| Events in quadrant B | 3,097,953 | 596,082 |
| Events in quadrant C | 2,999,191 | 598,107 |
| Events in quadrant D | 8,997,948 | 509,843 |
| Mode M0 | |||
|---|---|---|---|
| Quadrant | BADHDUFLAG | Total packets | Discarded packets |
| A | 0 | 12529 | 3 |
| B | 0 | 12984 | 2 |
| C | 0 | 12484 | 2 |
| D | 0 | 30821 | 2 |
| Mode SS | |||
|---|---|---|---|
| Quadrant | BADHDUFLAG | Total packets | Discarded packets |
| A | 0 | 122 | 0 |
| B | 0 | 122 | 0 |
| C | 0 | 122 | 0 |
| D | 0 | 122 | 0 |
| Mode M9 | |||
|---|---|---|---|
| Quadrant | BADHDUFLAG | Total packets | Discarded packets |
| A | 0 | 32 | 0 |
| B | 0 | 32 | 0 |
| C | 0 | 32 | 0 |
| D | 0 | 32 | 0 |
| Quadrant | Total seconds | Saturated seconds | Saturation percentage |
|---|---|---|---|
| A | 5877 | 16 | 0.272248% |
| B | 5877 | 60 | 1.020929% |
| C | 5877 | 28 | 0.476434% |
| D | 5877 | 1145 | 19.482729% |
Noise dominated data is calculated using 1-second bins in cleaned event files. If a bin has >2000 counts, and if more than 50% of those come from <1% of pixels, then it is considered to be noise-dominated and hence unusable.
| Quadrant | # 1 sec bins | Bins with >0 counts | Bins with >2000 counts | High rate bins dominated by noise | Noise dominated (total time) | Noise dominated (detector-on time) | Marked lightcurve |
|---|---|---|---|---|---|---|---|
| A | 9104 | 5879 | 5 | 5 | 0.05% | 0.09% | 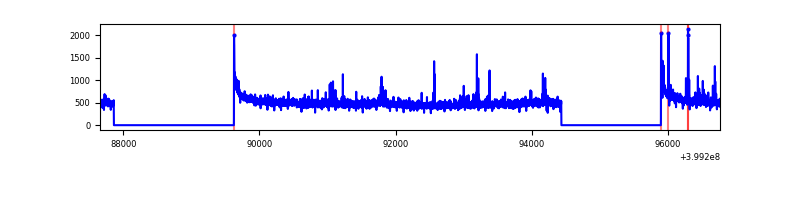 |
| B | 9104 | 5879 | 40 | 40 | 0.44% | 0.68% | 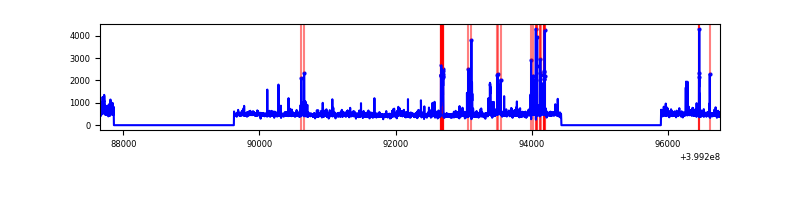 |
| C | 9104 | 5879 | 22 | 22 | 0.24% | 0.37% | 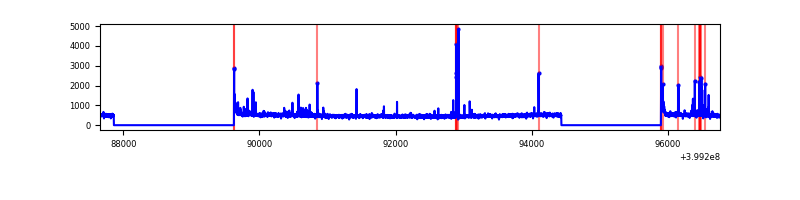 |
| D | 9104 | 5879 | 1554 | 1554 | 17.07% | 26.43% | 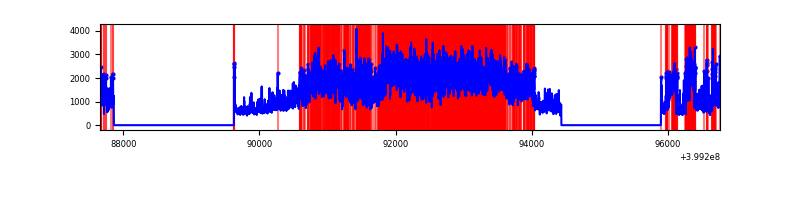 |
Top three noisy pixels from each quadrant. If the there are fewer than three noisy pixels in the level2.evt file, extra rows are filled as -1
| Pixel properties | Quadrant properties | ||||||
|---|---|---|---|---|---|---|---|
| Quadrant | DetID | PixID | Counts | Sigma | Mean | Median | Sigma |
| A | 10 | 83 | 295057 | 2153.64 | 671 | 657 | 136.7 |
| A | 9 | 143 | 42926 | 309.21 | 671 | 657 | 136.7 |
| A | 7 | 3 | 40145 | 288.87 | 671 | 657 | 136.7 |
| B | 5 | 172 | 144017 | 1110.59 | 664 | 646 | 129.1 |
| B | 0 | 190 | 85533 | 657.56 | 664 | 646 | 129.1 |
| B | 4 | 141 | 57524 | 440.59 | 664 | 646 | 129.1 |
| C | 15 | 214 | 251013 | 1647.61 | 652 | 657 | 152.0 |
| C | 1 | 23 | 104499 | 683.39 | 652 | 657 | 152.0 |
| C | 0 | 10 | 60486 | 393.74 | 652 | 657 | 152.0 |
| D | 12 | 235 | 5730687 | 37593.96 | 625 | 608 | 152.4 |
| D | 10 | 253 | 505450 | 3312.17 | 625 | 608 | 152.4 |
| D | 12 | 227 | 178738 | 1168.68 | 625 | 608 | 152.4 |
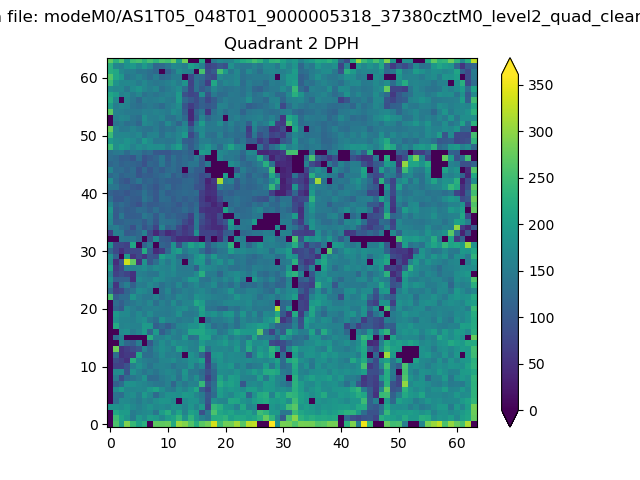
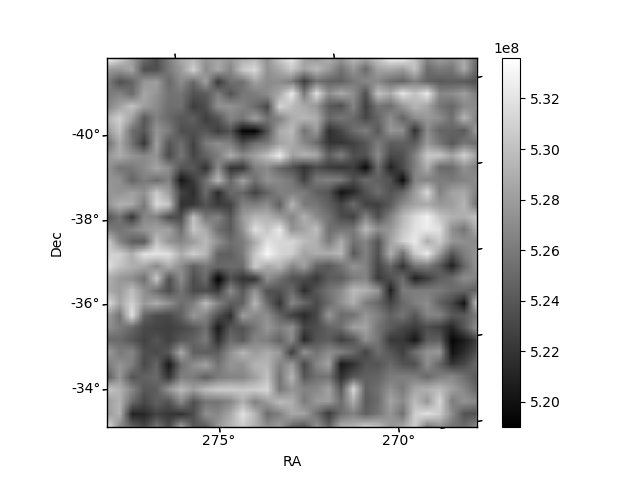
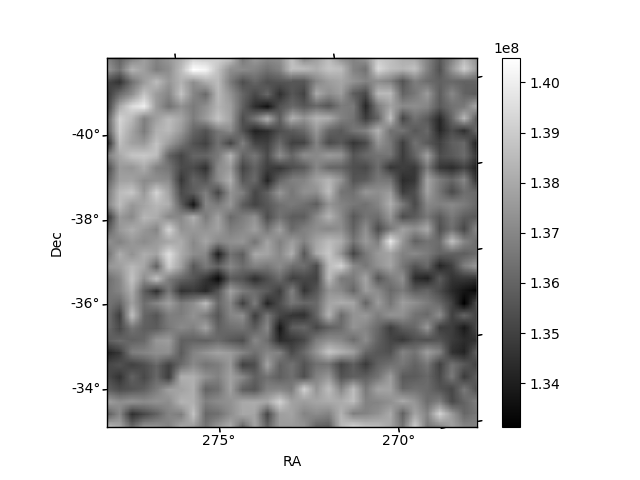
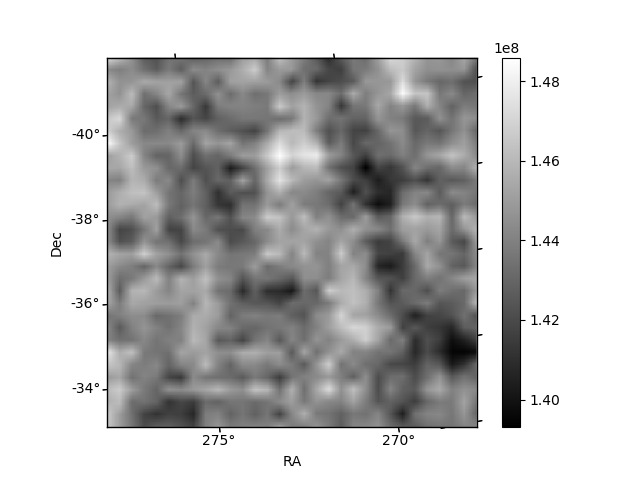
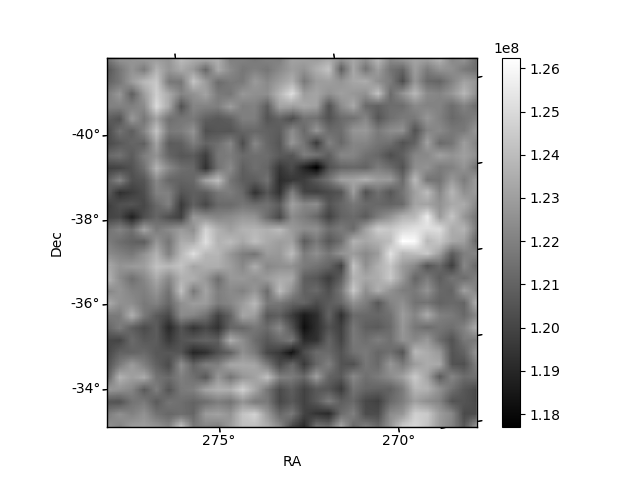
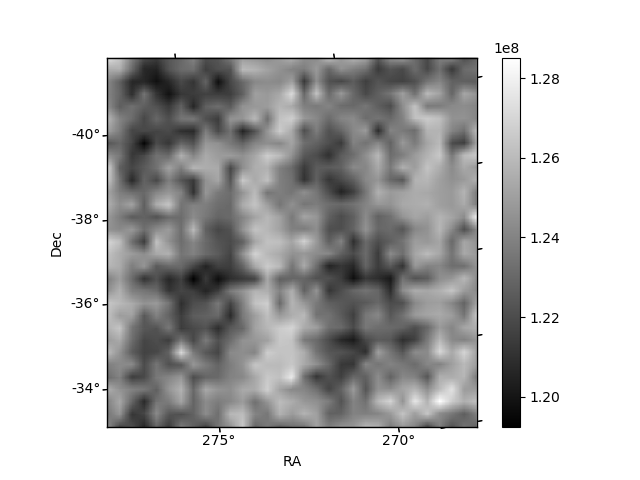
Histogram calculated using DETX and DETY for each event in the final _common_clean file
| Quadrant A | 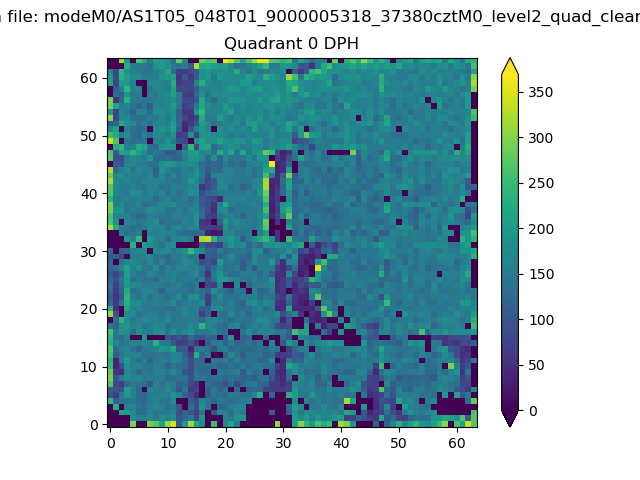 |
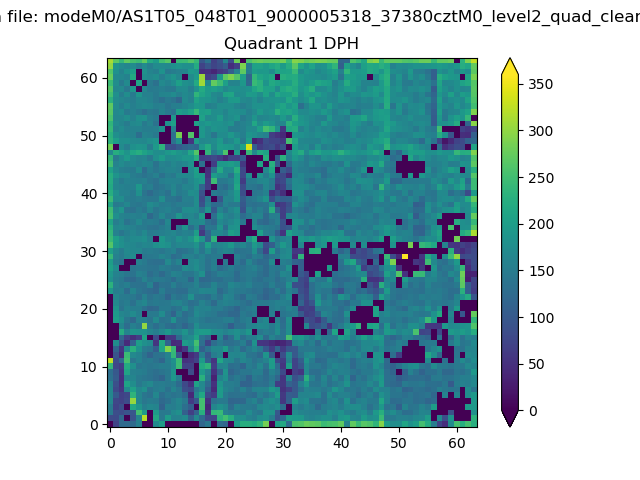 |
Quadrant B |
|---|---|---|---|
| Quadrant D | 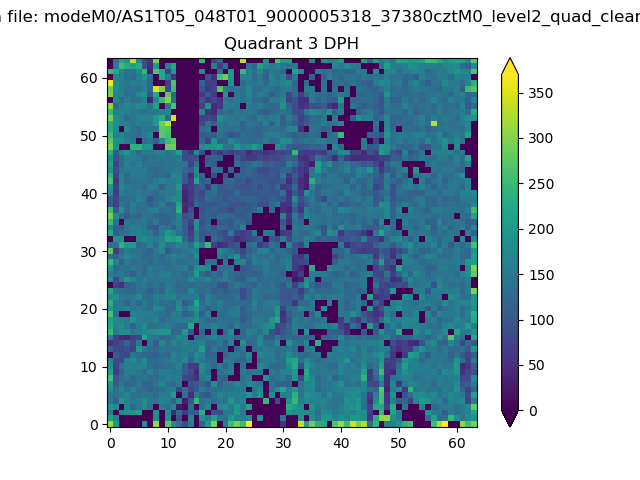 |
 |
Quadrant C |
| Plot type | Count rate plots | Images |
|---|---|---|
| Comparison with Poisson distribution Blue bars denote a histogram of data divided into 1 sec bins. Red curve is a Poisson curve with rate = median count rate of data. |
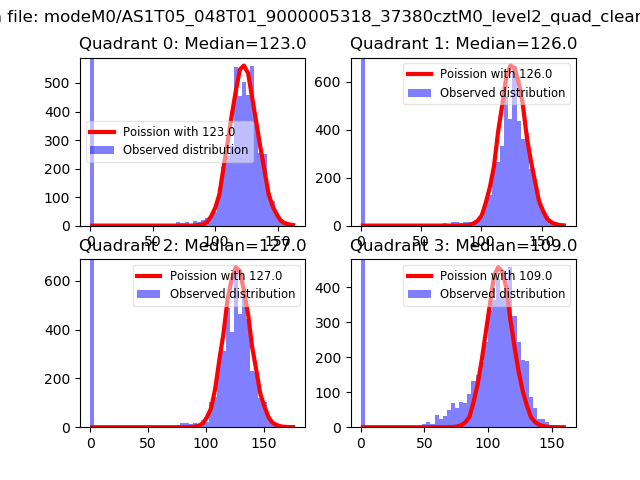 |
 |
| Quadrant-wise count rates Data is divided into 100 sec bins |
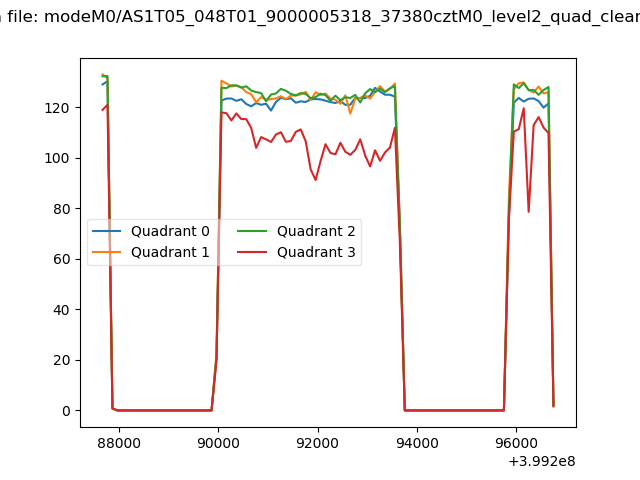 |
|
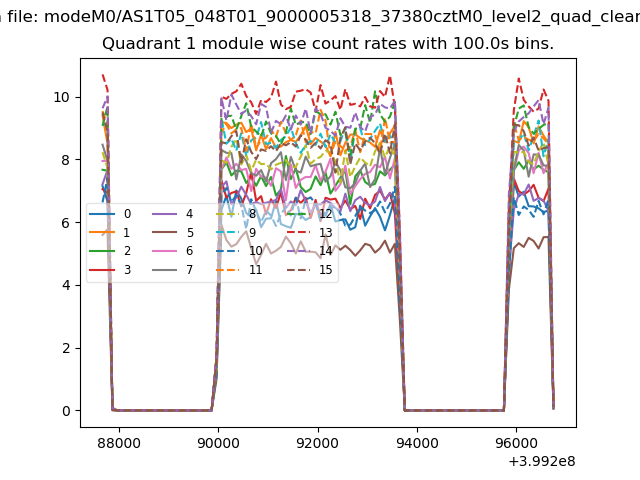
| Module-wise count rates for Quadrant A Data is divided into 100 sec bins |
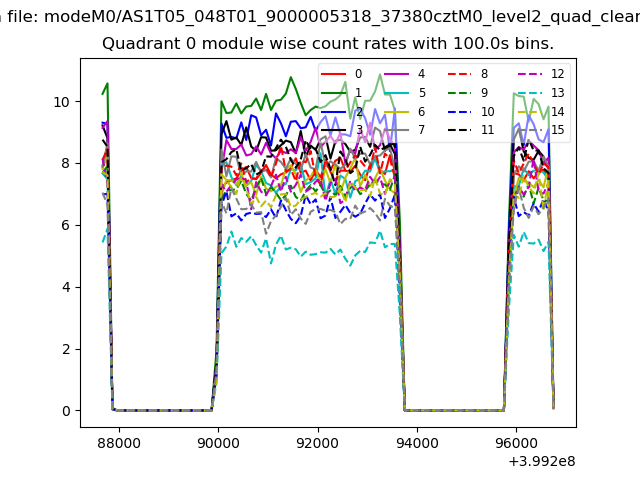 |
 |
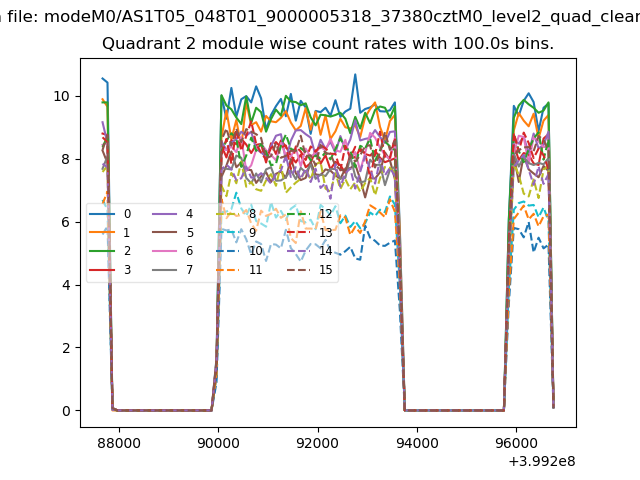
| Module-wise count rates for Quadrant B Data is divided into 100 sec bins |
 |
 |
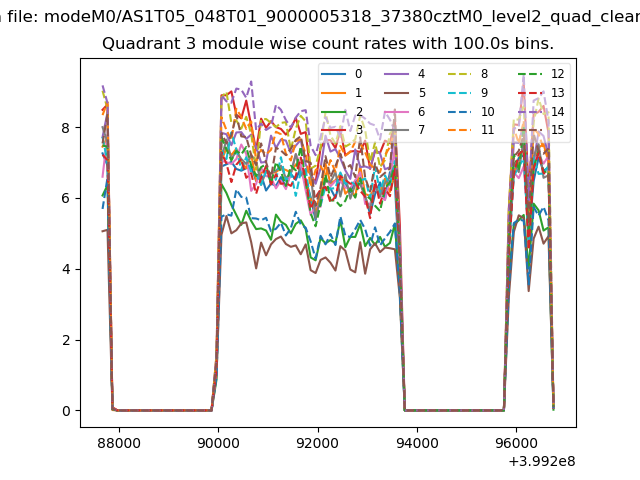
| Module-wise count rates for Quadrant C Data is divided into 100 sec bins |
 |
 |
| Module-wise count rates for Quadrant D Data is divided into 100 sec bins |
 |
 |
| Parameter | Plot |
|---|---|
| CZT HV Monitor | 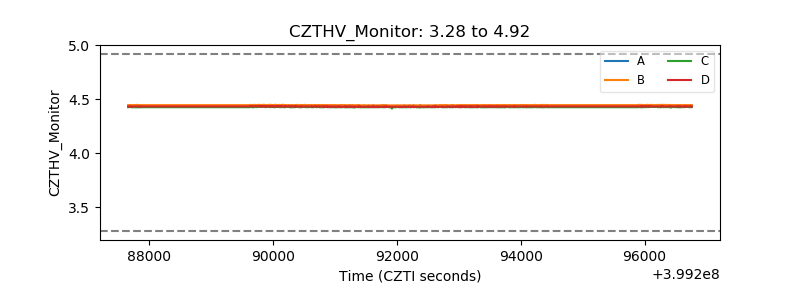 |
| D_VDD | 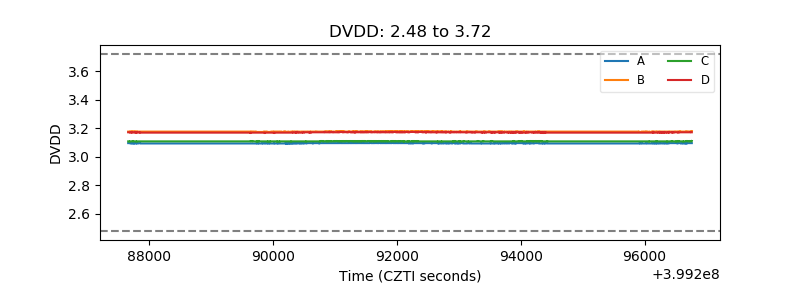 |
| Temperature 1 | 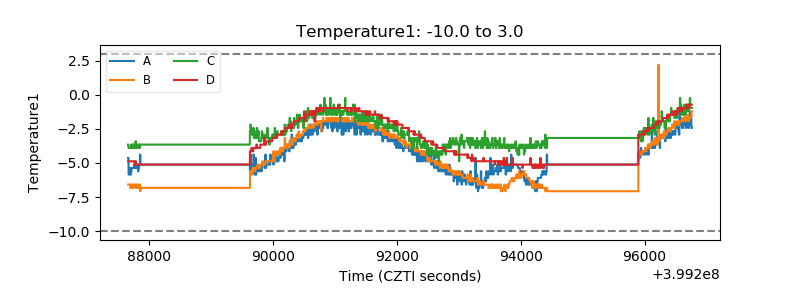 |
| Veto HV Monitor | 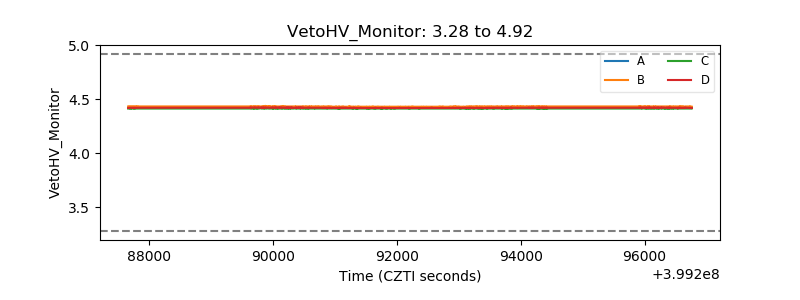 |
| Veto LLD | 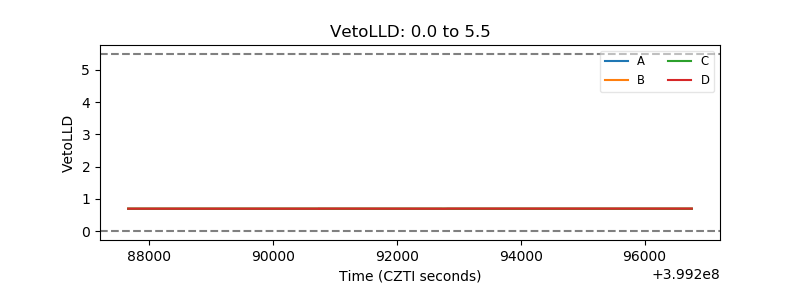 |
| Alpha Counter | 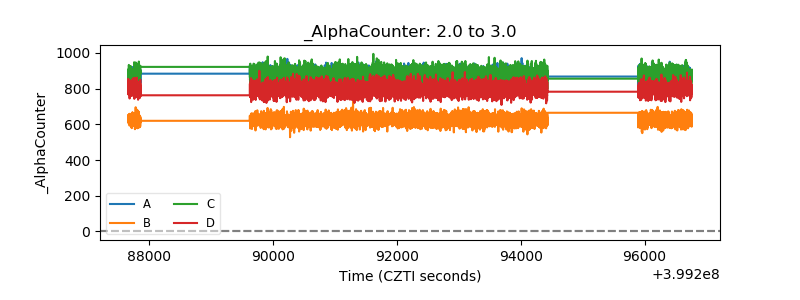 |
| _CPM_Rate | 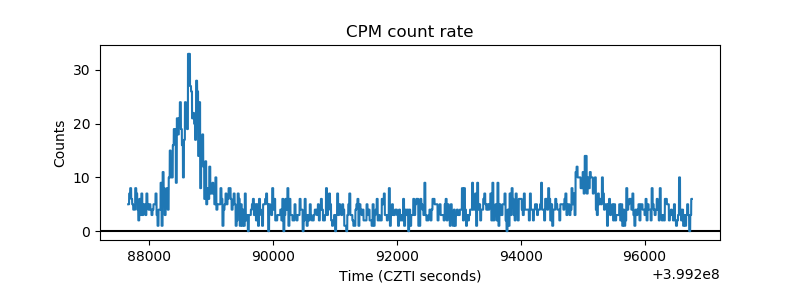 |
| CZT Counter | 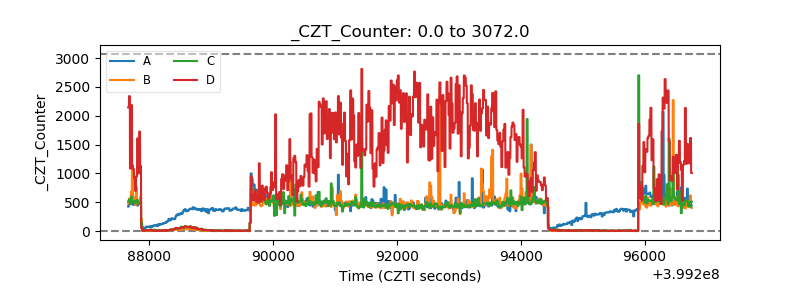 |
| +2.5 Volts monitor | 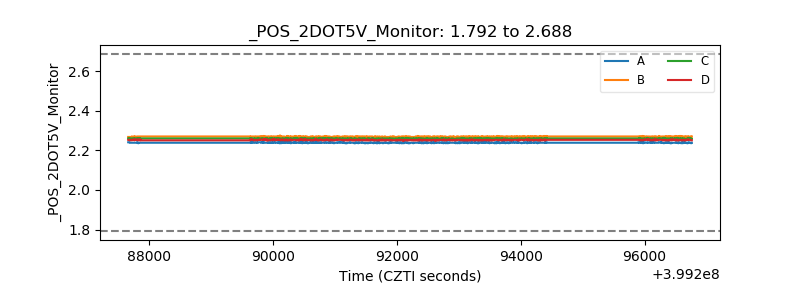 |
| +5 Volts monitor | 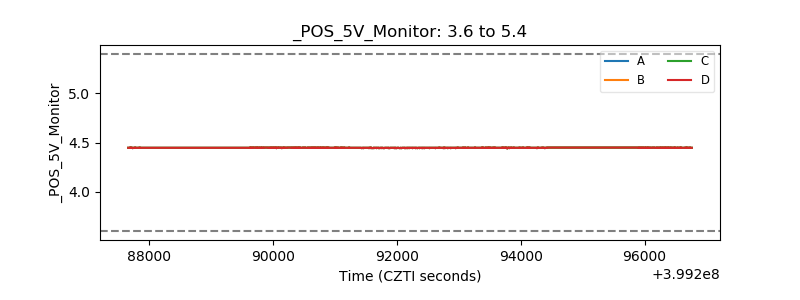 |
| _ROLL_ROT | 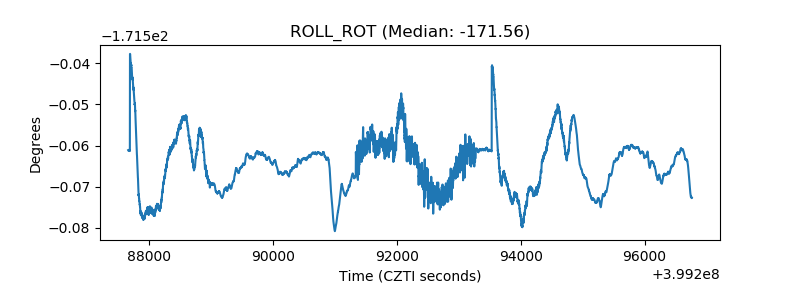 |
| _Roll_DEC | 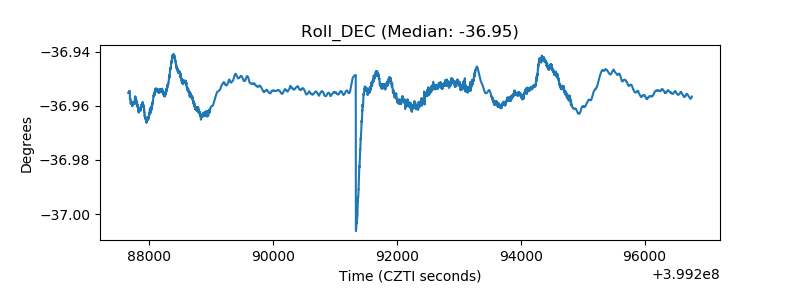 |
| _Roll_RA | 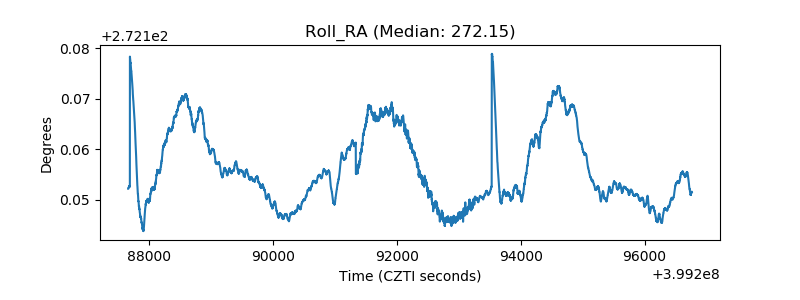 |
| Veto Counter | 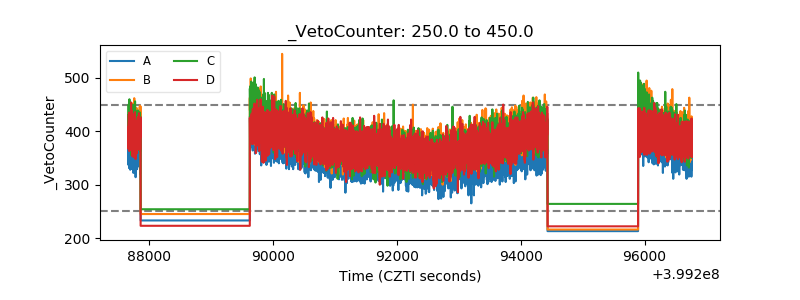 |