| Param | Original file | Final file |
|---|---|---|
| Filename | modeM0/AS1T05_048T01_9000005318_37381cztM0_level2.evt | modeM0/AS1T05_048T01_9000005318_37381cztM0_level2_quad_clean.evt |
| Size (bytes) | 581,512,320 | 85,893,120 |
| Size | 554.6 MB | 81.9 MB |
| Events in quadrant A | 3,088,829 | 558,267 |
| Events in quadrant B | 4,183,087 | 558,318 |
| Events in quadrant C | 3,065,303 | 566,939 |
| Events in quadrant D | 6,875,632 | 505,822 |
| Mode M0 | |||
|---|---|---|---|
| Quadrant | BADHDUFLAG | Total packets | Discarded packets |
| A | 0 | 12921 | 13 |
| B | 0 | 16317 | 16 |
| C | 0 | 12758 | 13 |
| D | 0 | 24529 | 19 |
| Mode SS | |||
|---|---|---|---|
| Quadrant | BADHDUFLAG | Total packets | Discarded packets |
| A | 0 | 120 | 0 |
| B | 0 | 120 | 0 |
| C | 0 | 120 | 0 |
| D | 0 | 120 | 0 |
| Mode M9 | |||
|---|---|---|---|
| Quadrant | BADHDUFLAG | Total packets | Discarded packets |
| A | 0 | 16 | 0 |
| B | 0 | 16 | 0 |
| C | 0 | 16 | 0 |
| D | 0 | 17 | 0 |
| Quadrant | Total seconds | Saturated seconds | Saturation percentage |
|---|---|---|---|
| A | 5886 | 28 | 0.475705% |
| B | 5888 | 475 | 8.067255% |
| C | 5885 | 48 | 0.815633% |
| D | 5889 | 580 | 9.848871% |
Noise dominated data is calculated using 1-second bins in cleaned event files. If a bin has >2000 counts, and if more than 50% of those come from <1% of pixels, then it is considered to be noise-dominated and hence unusable.
| Quadrant | # 1 sec bins | Bins with >0 counts | Bins with >2000 counts | High rate bins dominated by noise | Noise dominated (total time) | Noise dominated (detector-on time) | Marked lightcurve |
|---|---|---|---|---|---|---|---|
| A | 7207 | 5891 | 12 | 12 | 0.17% | 0.20% | 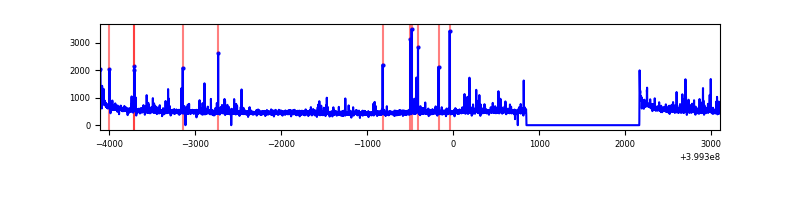 |
| B | 7207 | 5893 | 323 | 323 | 4.48% | 5.48% | 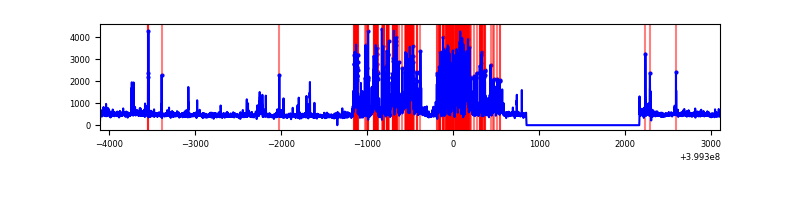 |
| C | 7207 | 5891 | 40 | 40 | 0.56% | 0.68% | 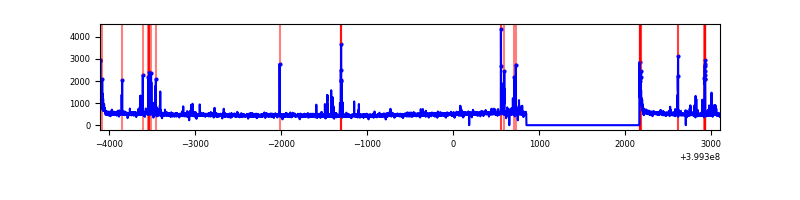 |
| D | 7207 | 5893 | 615 | 615 | 8.53% | 10.44% | 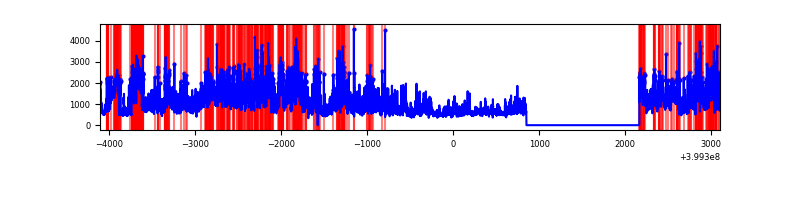 |
Top three noisy pixels from each quadrant. If the there are fewer than three noisy pixels in the level2.evt file, extra rows are filled as -1
| Pixel properties | Quadrant properties | ||||||
|---|---|---|---|---|---|---|---|
| Quadrant | DetID | PixID | Counts | Sigma | Mean | Median | Sigma |
| A | 10 | 83 | 304292 | 2248.53 | 670 | 656 | 135.0 |
| A | 9 | 143 | 114102 | 840.11 | 670 | 656 | 135.0 |
| A | 13 | 248 | 35029 | 254.54 | 670 | 656 | 135.0 |
| B | 5 | 255 | 1266126 | 10057.78 | 646 | 629 | 125.8 |
| B | 5 | 172 | 196223 | 1554.52 | 646 | 629 | 125.8 |
| B | 0 | 190 | 56879 | 447.06 | 646 | 629 | 125.8 |
| C | 15 | 214 | 249737 | 1640.7 | 650 | 654 | 151.8 |
| C | 14 | 254 | 126414 | 828.38 | 650 | 654 | 151.8 |
| C | 0 | 10 | 75376 | 492.19 | 650 | 654 | 151.8 |
| D | 12 | 235 | 3058098 | 19669.35 | 634 | 617 | 155.4 |
| D | 10 | 253 | 529896 | 3404.95 | 634 | 617 | 155.4 |
| D | 12 | 227 | 433820 | 2786.88 | 634 | 617 | 155.4 |
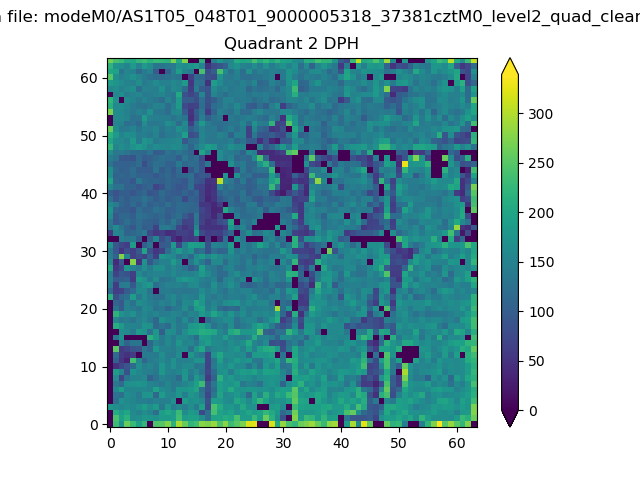
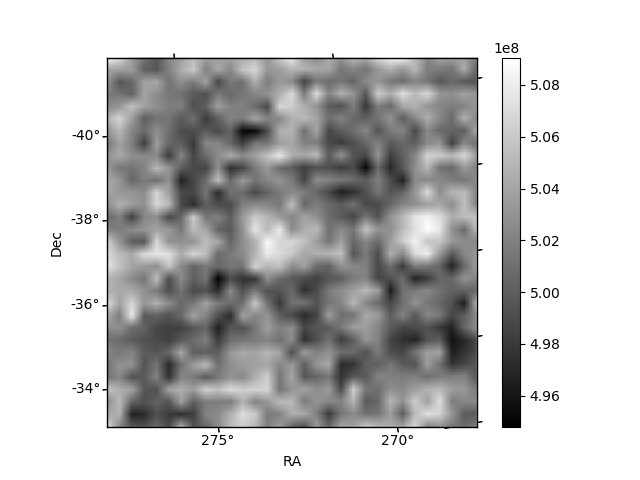
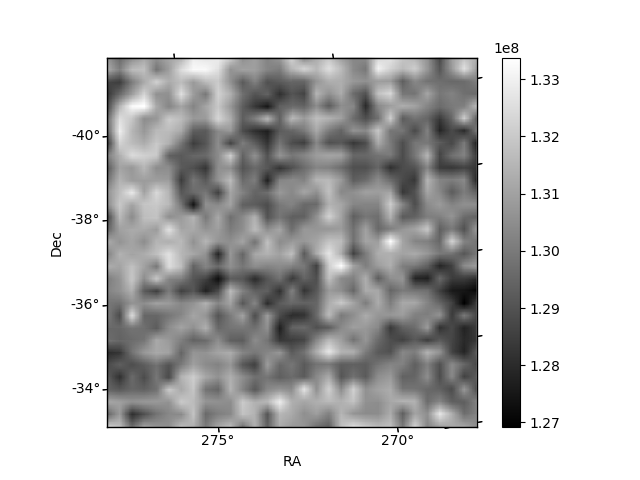
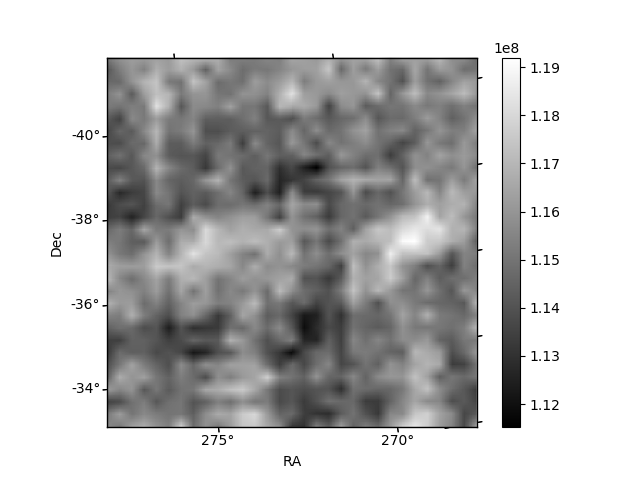
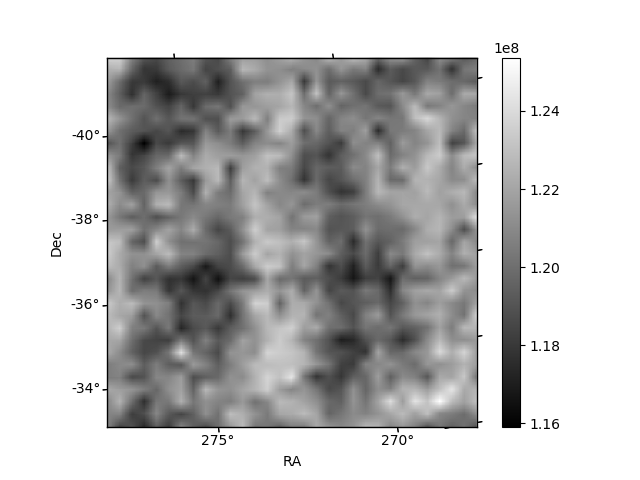
Histogram calculated using DETX and DETY for each event in the final _common_clean file
| Quadrant A | 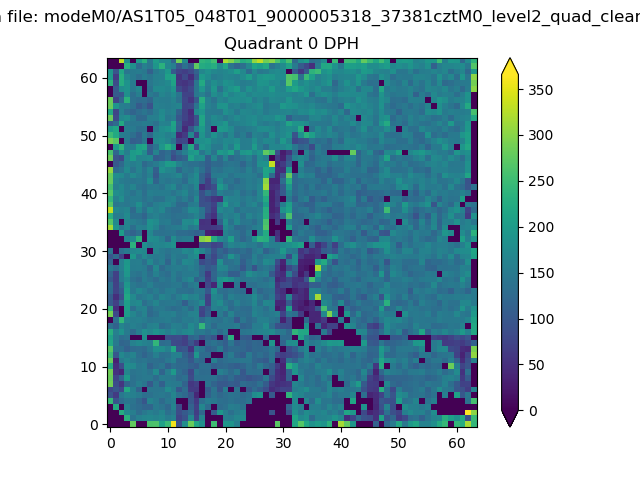 |
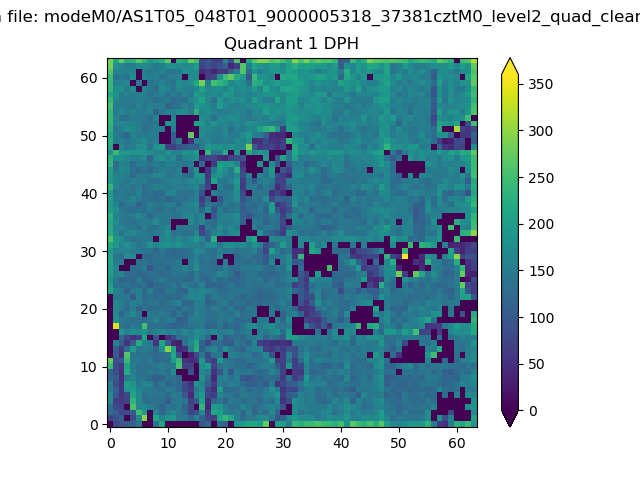 |
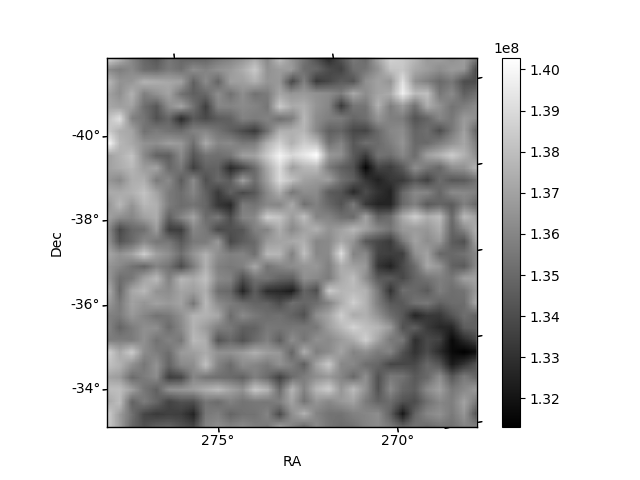
Quadrant B |
|---|---|---|---|
| Quadrant D | 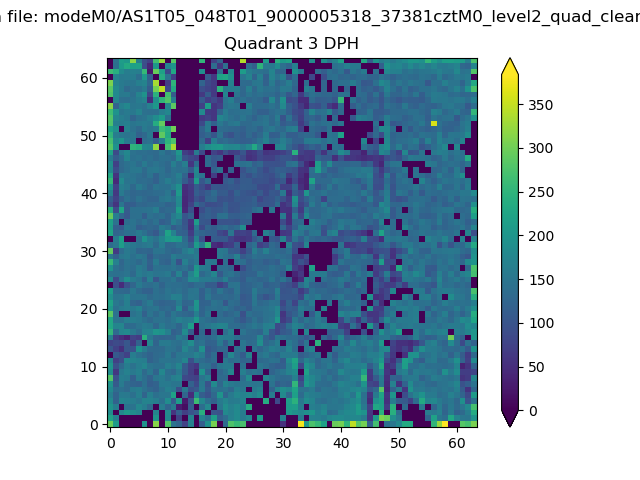 |
 |
Quadrant C |
| Plot type | Count rate plots | Images |
|---|---|---|
| Comparison with Poisson distribution Blue bars denote a histogram of data divided into 1 sec bins. Red curve is a Poisson curve with rate = median count rate of data. |
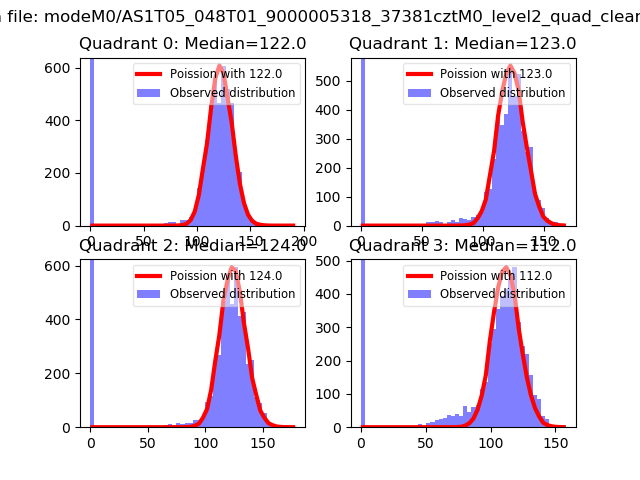 |
 |
| Quadrant-wise count rates Data is divided into 100 sec bins |
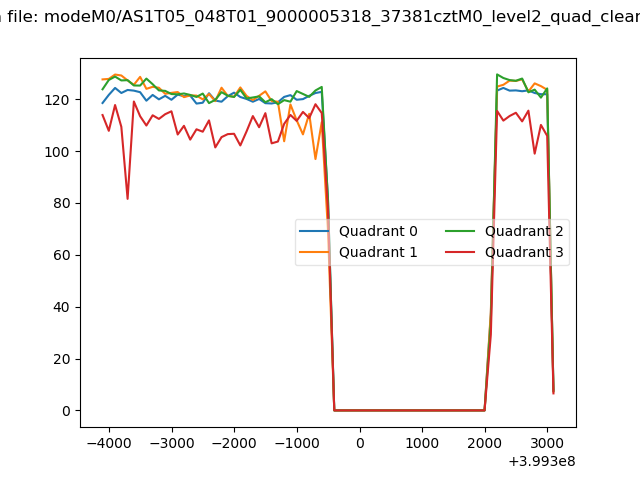 |
|
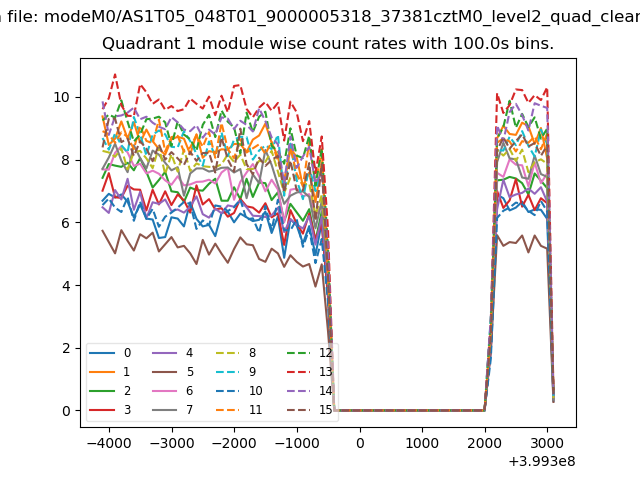
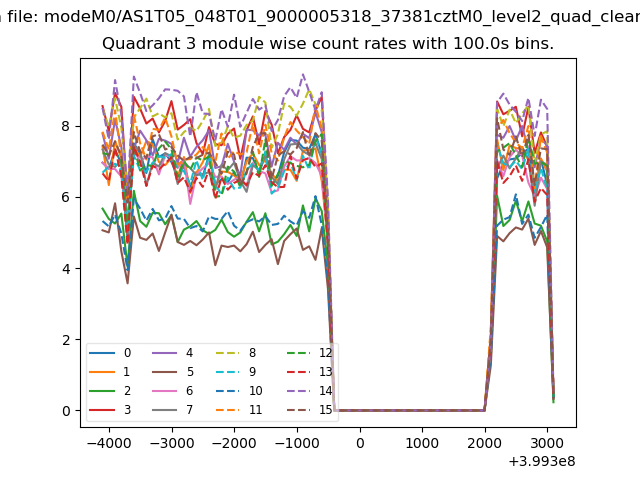
| Module-wise count rates for Quadrant A Data is divided into 100 sec bins |
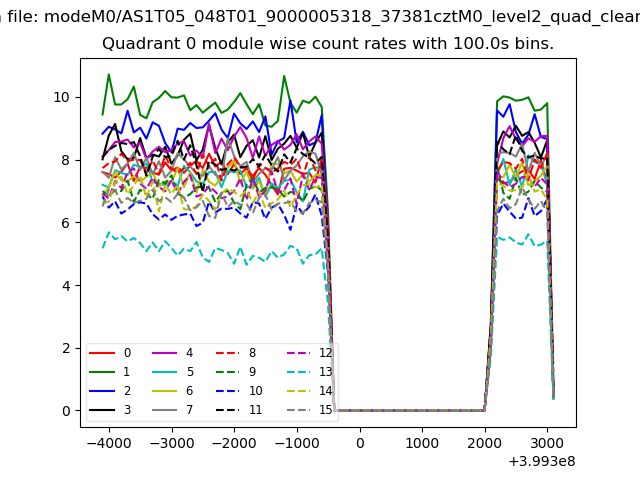 |
 |
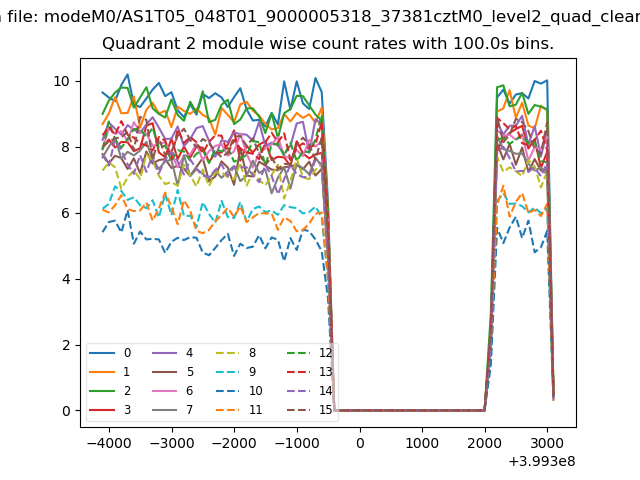
| Module-wise count rates for Quadrant B Data is divided into 100 sec bins |
 |
 |
| Module-wise count rates for Quadrant C Data is divided into 100 sec bins |
 |
 |
| Module-wise count rates for Quadrant D Data is divided into 100 sec bins |
 |
 |
| Parameter | Plot |
|---|---|
| CZT HV Monitor | 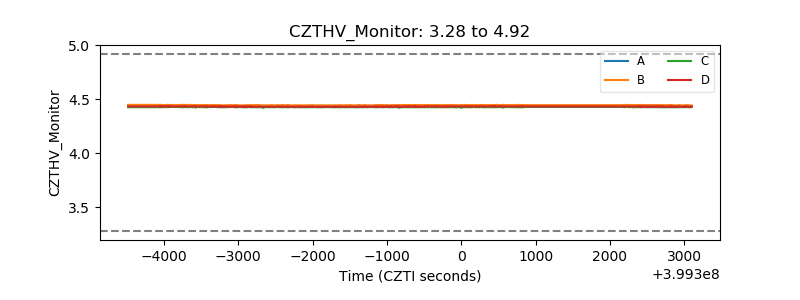 |
| D_VDD | 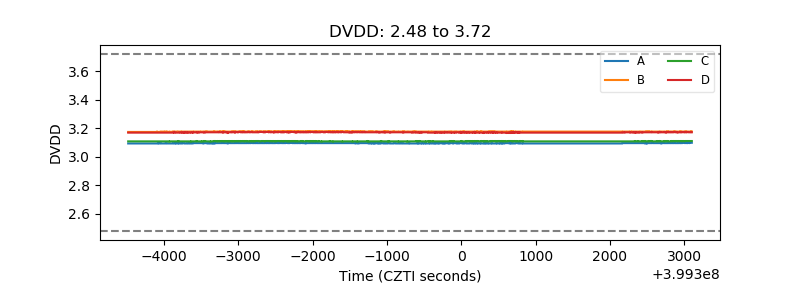 |
| Temperature 1 | 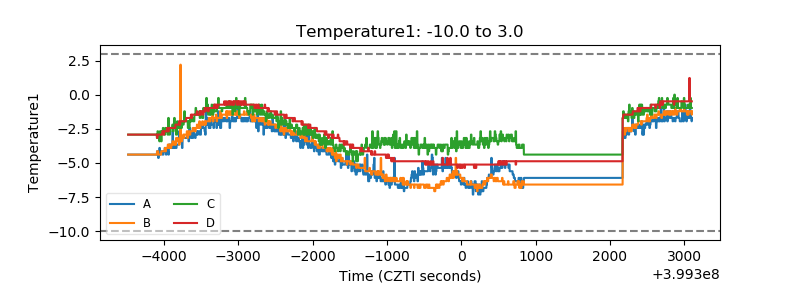 |
| Veto HV Monitor | 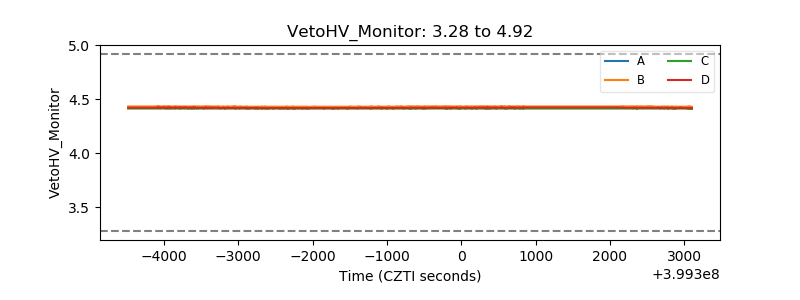 |
| Veto LLD | 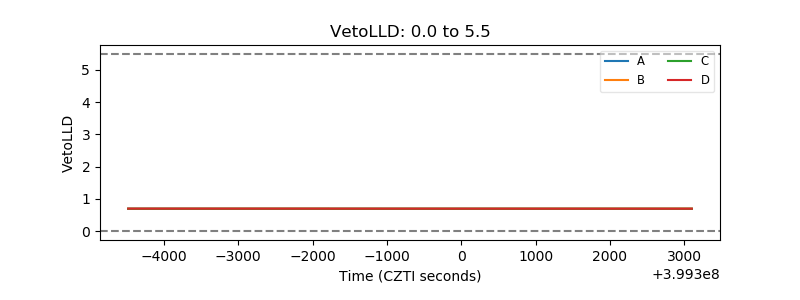 |
| Alpha Counter | 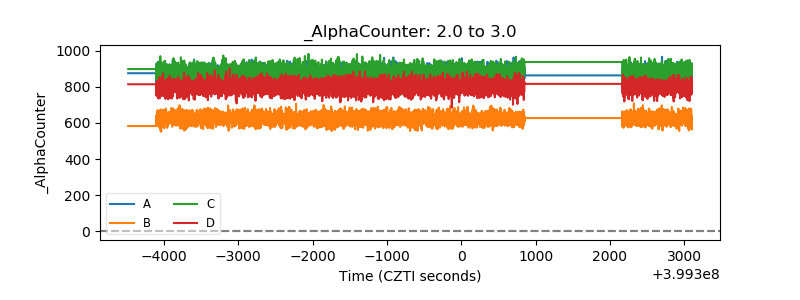 |
| _CPM_Rate | 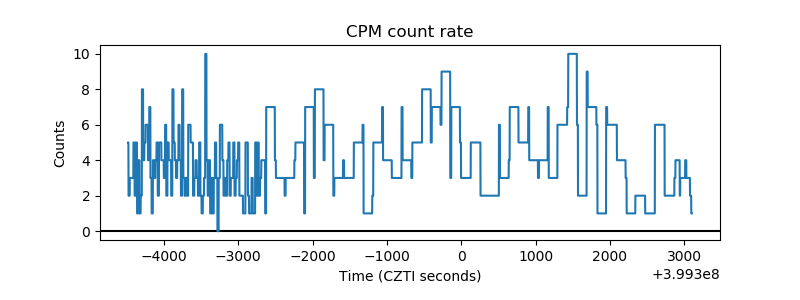 |
| CZT Counter | 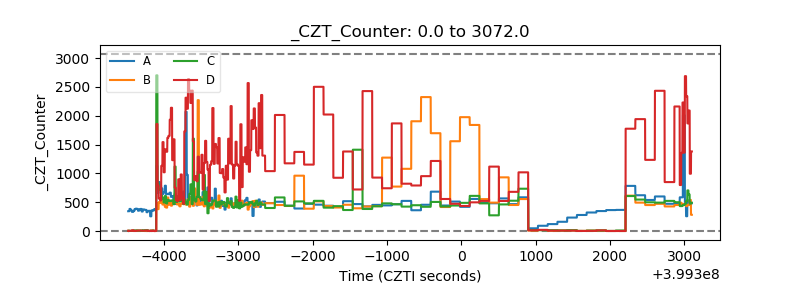 |
| +2.5 Volts monitor | 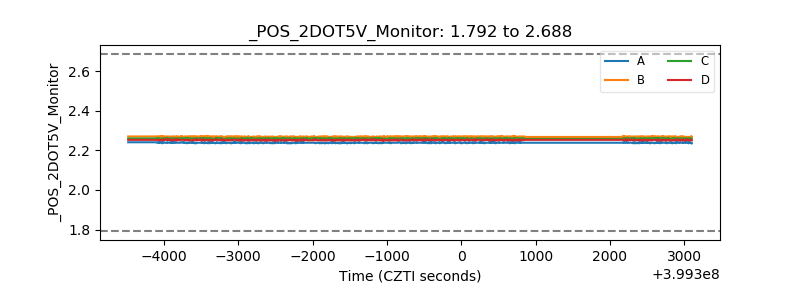 |
| +5 Volts monitor | 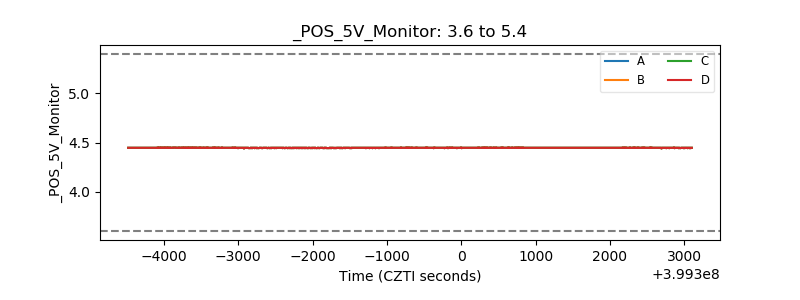 |
| _ROLL_ROT | 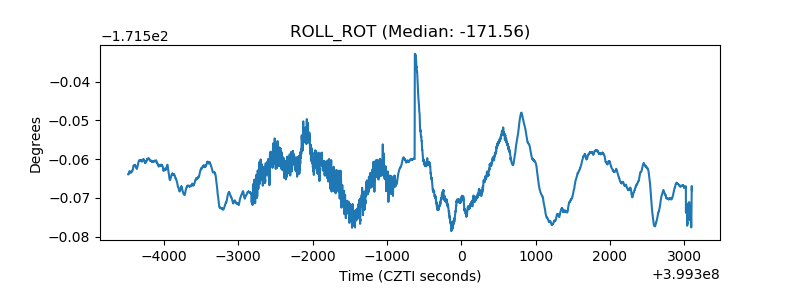 |
| _Roll_DEC | 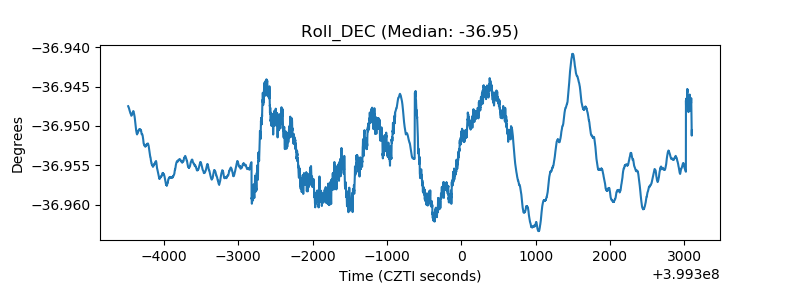 |
| _Roll_RA | 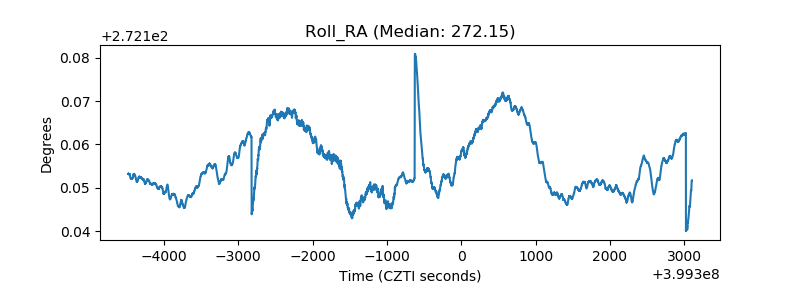 |
| Veto Counter | 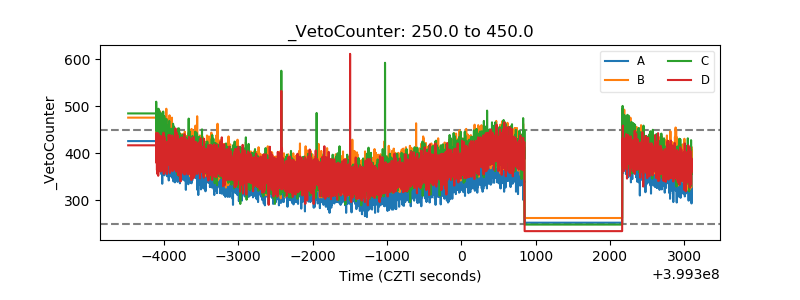 |